HC2091: Finance for Business
Woolworths Limited is UK based company established by Frank Winfield Woolworth Association in 1980 in the United Kingdom.
It is headquartered In London U.K. and mainly deals in clothing footwear, footwear, bedding, furniture, jewelry, beauty products, and electronics and house wares (Woolworth Group, 2018). In addition to this, the first Woolworths stores started in 1878 named as Woolworths’ Great Five Cent Store”.
It is the original pioneer of “Five-and-Dime stores. It has started the trend of directs sales, purchase and customer service practices that are very popular and accepted by most of the organization in this field.
Moreover, the revenue of the company is $56, 965 Million with the sales growth of 3.51% and net income is $ 1,605 with a growth rate of 187 in 2018.
In regards to this, the biggest marketing advantage is that it is well established and significantly setting the benchmark in the various fields of the market.
At the same time, the marketing elements that distinguish Woolworths from its competitors are high-quality products, sustainable price and value and continually increasing goodwill.
The various divisions of business and diverse range of business are the biggest elements that stands the company in the favorable market position (Woolworth Group, 2018).
2.0 Calculation and analysis of financial ratios
Profitability ratios are sued to determine the profitable situation of the company that reflects the adequate returns for the shareholders. These ratios include the net profit margin, return on assets, return on equity, gross profit margin and operating profit margin (Gitman et al., 2015).
For Woolworths, these ratios are calculated and summarized in the table and graph below:
| All figures in ($’M) | Formulas | Woolworths | |
| Profitability ratios | 2017 | 2018 | |
| Net profit margin | Net income / Net sales | 2.89% | 3.15% |
| Net income | 1,593 | 1795 | |
| Net sales | 55,034 | 56965 | |
| Return on assets | Net income / Total assets | 6.91% | 7.62% |
| Net income | 1,593 | 1795 | |
| Total assets | 23,043 | 23558 | |
| Return on equity | Net income / Average shareholder equity | 16.13% | 16.55% |
| Net income | 1,593 | 1795 | |
| Shareholder equity | 9876 | 10849 | |
| Gross profit margin | Gross profit / Sales | 28.94% | 29.33% |
| Sales | 55,034 | 56965 | |
| Gross profit | 15929 | 16709 | |
| Operating profit margin | Operating profit or EBIT / sales | 4.23% | 4.47% |
| sales | 55,034 | 56965 | |
| Operating profit or EBIT | 2326 | 2548 | |
Figure 1: Profitability ratios
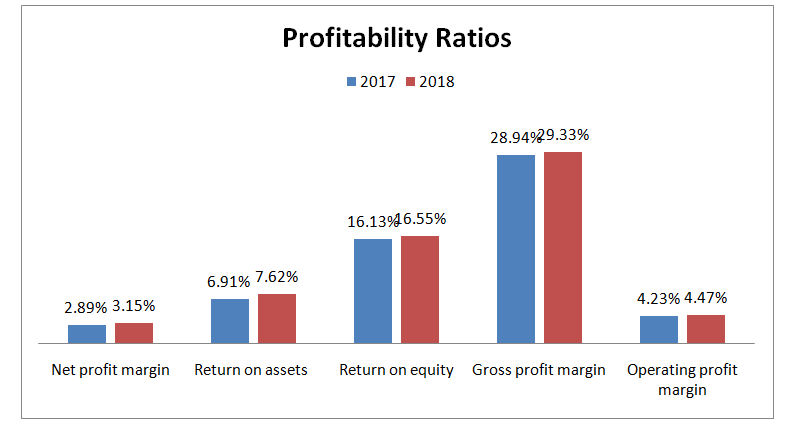
Based on the above ratios calculated, it can be determined that net profit margin of Woolworths increased from 2.89% in the year 2017 to 3.15% in the year 2018 showing the ability of the firm to generate profits for the investors (Woolworth Group, 2018). At the same time, return on assets and return on equity also increased during this period showing the ability of the firm to utilize the available assets and shareholder equity to generate the profit. Woolworths uses the equity and assets adequately to generate the profitability. In addition, gross profit margin also increased from 28.94% to 29.33% in the year 2018 implies the company is able to generate adequate sales and reduce the costs of goods sold to keep the high gross profit margin. Along with this, the operating profit margin of Woolworths also increased from 4.23% to 4.47% during this period. It means the firm is capable of controlling the operating expenses adequately to generate profits (Woolworth Group, 2018). So overall, it can be depicted that Woolworths is showing a good position at the profitability level as there is an increasing trend in all profitability ratios during 2017 and 2018.
Liquidity ratios are used to determine the ability of the firm to meet its short term obligations or current liabilities. It is required for the company to be in a liquidated state to operate the daily operations and avoid the bankrupt situation in future (Lee et al., 2015). These ratios include the current ratio and liquid ratio that are calculated and summarized in the table below and graph:
| Liquidity ratios | 2017 | 2018 | |
| Current ratio | (Current Assets/Current Liabilities) | 0.80 | 0.78 |
| Current Assets | 7,121 | 7181 | |
| Current Liabilities | 8,952 | 9196 | |
| Liquid ratio | (Liquid assets/current liabilities) | 0.33 | 0.32 |
| Quick Assets | 2,914 | 2,948 | |
| Current Liabilities | 8,952 | 9196 | |
| Inventory | 4,207 | 4233 |
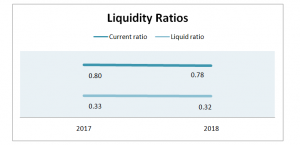
From the above table and graph, it can be depicted that current and liquid ratio slightly declined from year 2017 to year 2018. The current ratio declined from 0.80 to 0.78 during this period means the ability of the firm slightly declined to meet its current obligations. At the same time, the decline in a liquid ratio from 0.33 to 0.32 also shows the decreased ability of the firm to meet its current obligations in the future contingencies. So overall, it can be depicted that the liquidity position of Woolworths slightly declined from the year 2017 to the year 2018. The reason behind this decline may be related to the comparative increase in current liabilities as compared to current assets (Woolworth Group, 2018). However, the value of the current ratio in the year 2018 is less than ideal ratio of 2:1 means the firm is not adequately capable of meeting the current assets because current liabilities are more than current assets. At the same time, the liquid ratio is also very low as compared to the ideal ratio of 1:1 means the firm is not capable of meeting the current obligations in a future contingency.
Market value ratios are used to evaluate the current share price of the company. It tells about the performance of the shares of the company in terms of under-pricing and overpricing. The most common market value ratios include book value per share, price earnings ratio, market-to-book ratio and dividend yield (Fernández-Amador et al., 2016). These ratios are calculated and summarized as below:
| Market value Ratios: | 2017 | 2018 | |
| Price-earnings (PE) Ratio | Market price per share/ Earning per share | 0.22 | 0.20 |
| Market price per share | 26.5 | 26.29 | |
| Earnings per share | 119.4 | 132.6 | |
| Market-to-book ratio | Market price per share/ Book value per share | 3.59 | 3.28 |
| Market price per share | 26.5 | 26.29 | |
| Book value per share | 7.39 | 8.01 | |
| Dividend Yield | Annual dividend/current stock price | 3.17% | 3.92% |
| Annual dividend | 0.84 | 1.03 | |
| current stock price | 26.5 | 26.3 |
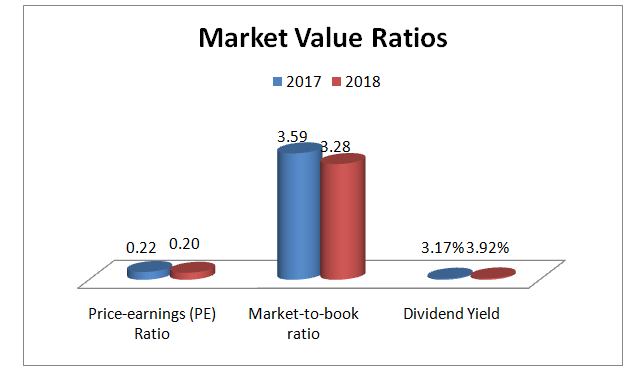
Price/earnings ratio is used to determine whether the shares are over-priced or under-priced. It is useful to compare the market price of the stock of the firm to its earnings per share. From the ratio calculated, it can be depicted that price earnings ratio declined from 0.22 to 0.20 from the year 2017 to the year 2018. It means the trust of the investors regarding the improvement in the company’s earnings declined during this period (Woolworth Group, 2018). However, this ratio is low then there is more chance for the stock price to move even higher. So there is a low risk that the share price will slide down in the future. Based on this, it can be depicted that the stock of the company is overvalued. On the other hand, the market-to-book ratio is related to the firm’s market value per share to its book value per share. It indicates the ability of the management to create value for the stakeholders (Fraser et al., 2015). From the ratios, it can be determined that the market-to-book ratio is low and also declined from 3.59 in the year 2017 to 3.28 in the year 2018. Based on this, it can be depicted that the possibility regarding investors’ willing to pay to acquire or sell the stock in the secondary markets is declined. At the same time, the book value is lower than the market value as the stock of the company is overvalued. Overvalued stocks are ideal for the investors who look to short a position and are selling shares with the intention of purchasing them when the prices are according to the market. In addition, overvalued stocks of the company can also be traded by investors at a premium due to the brand and goodwill and effective management. In addition, dividend yield also increased from 3.17% to 3.92% in the year 2018 showing the increasing ability of the firm to pay dividends to its investors (Woolworth Group, 2018). The company believes in paying dividends to its investors developing trust among them for future investments. So, in perspective of the investment, it can be stated that it will be good for the investors to invest in the company’s stock.
3.0 Graphs and comparison of share price movements
For comparing the share price movements, the stock prices for Woolworths, S&P/ASX 20, S&P/ASX 200, S&P/ASX 50, and S&P/ASX 300 are determined for the two years period between 1 April 2016 and 31 March 2018 on monthly basis (Woolworth Group, 2018). For Woolworths, stock prices for two years period are plotted in a graph as below:
Figure 4: Share price movements in Woolworths
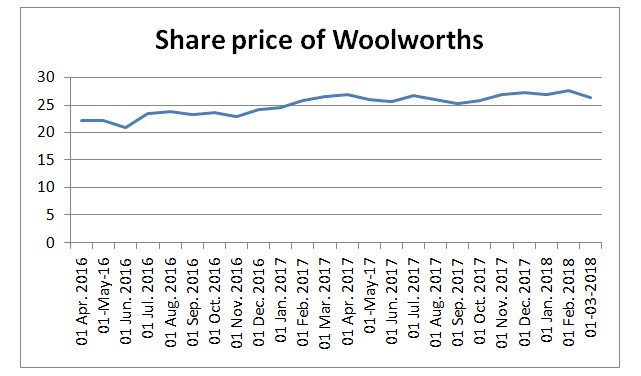
The above graph shows that there is an increasing trend in share prices of Woolworths in the last two years from April 2016 to March 2018. At the same time, it can be noticed that there are little fluctuations in the share prices of the company during this period. So, it can be depicted that there is low volatility in share prices of the company (García-Meca et al., 2017).
To compare the share price movements of Woolworths, ordinary indices of Australia are also considered that are presented below:
Figure 5: Share price movements
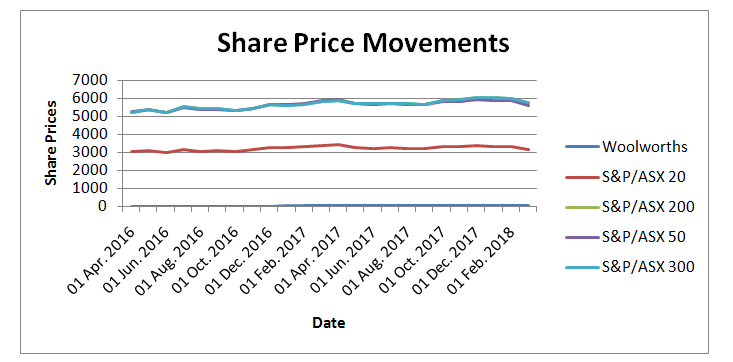
Based on the above graph, it can be determined that the movements in All Ordinaries Index are more than the share price movements in Woolworths. There are more fluctuations in share prices of all indices as compared to Woolworths. It means the company price trend is less volatile compared to the index (Woolworth Group, 2018). It is highly closely correlated with the all ordinaries index as the share prices of the company are increasing along with the increase in the all ordinaries index. But at the same time, the prices of the company are below the index because the values of share prices of the company are lower than the index.
Price movements are affected by factors like increasing competition as the competition in the supermarket of Australia increased dramatically because different companies like Aldi, Costco, and potential other newcomers challenged the margins of the company (STONER and WERNER, 2018). But at the same time, the increased customer services by Woolworths helped in bringing innovation and competing with the competitors to increase share prices significantly. Its dividend strategy also contributed to the price movements because Woolworths had 21 consecutive dividend increases showing the ability of the firm to attract more investors to invest that also contributed to the price movements.
4.0 Calculation cost of equity
The required rate of return for equity is the return that is required for a business to finance the operation by using equity rather than debt. It is required for the investors for holding the firm’s stock (Mason and Harrison, 2015). It is determined by using the capital asset pricing model. For this, the below formula is used:
The required rate of return on equity = Risk-Free Rate + Beta * (Market Rate of Return – Risk-Free Rate)
The rate of return refers to the returns that are generated by the market, in which the company operates. The beta of the stock refers to the risk level of the security related to the wider marker (Favilukis et al., 2017). The beta value of one shows that the stock moves in tandem with the market. High beta shows that the stock is highly volatile while the lower beta shows the greater stability in stock prices. At the same time, risk-free rate is related to the rate of return on short term treasury bills or T-bills due to having high stability and backing of return by the government (Merigó et al., 2015).
The calculated beta (β) for Woolworths: 0.79 (Source: Reuters, 2018)
f the risk-free rate is 6 % and the market risk premium is 7 %, use the Capital Asset Pricing Model (CAPM) (SML approach) to calculate the required rate of return for the company’s shares.
Rf: 6%
Rm: 7%
Required rate of return= rf+ β*(rm-rf)
= 0.06+0.79(0.07-0.06)
= 0.06+0.79(0.01)
= 0.06+0.0079
= 0.0679
= 6.79%
The above calculated required rate of return on equity shows that the firm needs to generate this rate of return on the shares to meet the requirements of the shareholders.
5.0 Identify the capital structure
Table 4: Capital structure Ratio
| Capital Structure | 2017 | 2018 | |
| Working Capital Ratio | Current asset ÷ Current liabilities | 0.80 | 0.78 |
| Current assets | $M 7,121 | $M 7,181 | |
| Current Liabilities | $M 8,952 | $M 9,196 | |
| Debt to Equity Ratio | Debt ÷ Equity | 0.28 | 0.20 |
| Debt | $M 2,777 | $M 2,199 | |
| Equity | $M 9,876 | $M 10,849 | |
| Capital Gearing Ratio | Debt ÷ (Debt + Equity) | 22 % | 17 % |
| Debt + Equity | $M 12,653 | $M 13,048 |
Table 5: % Changes From 2017 to 2018
| Capital Structure | 2017 | 2018 | % Change | |||||||||
| Working Capital Ratio | 0.80 | 0.78 | -22% | |||||||||
| Debt to Equity Ratio | 0.28 | 0.20 | -80% | |||||||||
| Capital Gearing Ratio | 0.22 | 0.17 | -83% |
Capital structure ratio is used for calculating the long term position of the company in concern to developing competition. In simple words, this ratio help in analyzing the capital position & stability and for that different ratio’s are calculated for determining the liquidity position of the company respectively (Jackson et al., 2015). In addition to this, the capital structure ratio includes the three different ratios such as the working capital ratio, debt and equity ratio, and capital gearing ratio etc. In this way, the working capital ratio is measured for evaluating the actual liquidity condition of the company. From the above calculation, it can be determined that company liquidity condition is riskier for investors and creditors as in the year 2018 the ratio calculated is less than 1 which indicates that company is not running effectively or efficiently. In a similar manner, it is also identified that company’s current assets were going to increase but at the same time, the current liabilities of Woolworth were also increased in 2018 in comparison to 2017 (Woolworth Group, 2018). In this concern, it is noticed that the company’s liabilities increased more in against of its assets and this is the main reason which affects more Woolworth’s liquidity in 2018. There are some specific liabilities such as other financial liabilities and provisions that lead the decrement in the company’s liquidity. The change from 2017 to 2018 is 22 % that defines that the company’s liquidity has decreased.
In context to it, debt-equity ratio is calculated for Woolworth Company and that indicates that company is somewhere depending more on equity instead of debt which is a good indication but to maintain a balance, it is important for the company to raise its debt to a large extent. In the concern of Woolworth’s equity, it is examined that through equity financing, company stays itself away from the repayment obligations and it is also helpful to provide the additional working capital so that it can grow rapidly (Woolworth Group, 2018). In addition, the company’s annual report also reflects that the company gets the good return as it does not have much repayment liabilities of investor’s payment and interest charges in the case of debt financing. In a similar manner, it is determined in the above table that Woolworth increased its equity by $M 973 and at the same time, it decreased its debts by $M 578 from 2017 to 2018. This is done by the company in respect to getting the more benefits from its own equity within the company.
From the above capital gearing ratio, it is identified from the above calculation that the capital gearing ratio has decreased in the company as it was 22 % in 2017 but in 2018 it was 17 % that means the risk of the company has decreased at a significant level. In addition, the company’s gearing ratio also reflects that Woolworth has low gearing that leads the low financial risks through both investors as well as lenders who are associated with the company (Woolworth Group, 2018). In addition, after analyzing all the facts in the calculation of capital structure ratio, 5% change is measured in this from 2017 to 2018 that is more beneficial for Woolworth as it does not have much debt that leads the financial distress.
Thus, on the basis of the above findings, it is determined that Woolworth is operating its business in an effective manner and it does not have a need to take much stress regarding its financial performance within the market. In this way, it can be suggested to the company that it can somewhat focus on debt financing along with the equity financing.
On the basis of above discussion and evaluation, it can be concluded that Woolworth’s financial situation is almost good and it can be determined on the behalf of its profitability ratio that is increasing year by year. But at the same time, it is also concluded that the company’s liquidity ratio is decreasing that means the company has less liquidity in order to pay its obligations. In addition, the company’s market value ratio depicts the overvalued stock in the company that is good as Woolworth has a high value of its shares in the market. In this, it is also found from its share price movements that Woolworth has less volatile in the company’s trends. In the same manner, above the calculated cost of equity of Woolworth also reflects that the company has risk free rate of return on its shares. Apart from this, this report is also concluded that the company’s capital structure is also good as Woolworth has an effective financial position within the market because it reduces its debts continuously.
From the above facts, it can be recommended to the investors that Woolworth is in the good financial position so they have the opportunity to make the huge investment within Woolworth in order to get the benefits in comparison to other companies. At the same time, it can also be suggested to the company that it should increase its financing from its debts that is required to maintain full control over the business within the company. At the same time, under the debt financing, the company can get the benefits of tax deductions as interest payments are considered under the tax deductible.
Favilukis, J., Ludvigson, S.C. and Van Nieuwerburgh, S., 2017. The macroeconomic effects of housing wealth, housing finance, and limited risk sharing in general equilibrium. Journal of Political Economy, 125(1), pp.140-223.
Fernández-Amador, O., Gächter, M. and Sindermann, F., 2016. Finance-augmented business cycles: A robustness check. Economics bulletin, 36(1), pp.132-144.
Fraser, S., Bhaumik, S.K. and Wright, M., 2015. What do we know about entrepreneurial finance and its relationship with growth?. International Small Business Journal, 33(1), pp.70-88.
García-Meca, E., López-Iturriaga, F. and Tejerina-Gaite, F., 2017. Institutional investors on boards: Does their behavior influence corporate finance?. Journal of Business Ethics, 146(2), pp.365-382.
Gitman, L.J., Juchau, R. and Flanagan, J., 2015. Principles of managerial finance. AU: Pearson Higher Education.
Jackson, W.T., Scott, D.J. and Schwagler, N., 2015. Using the business model canvas as a methods approach to teaching entrepreneurial finance. Journal of Entrepreneurship Education, 18(2), p.99.
Lee, N., Sameen, H. and Cowling, M., 2015. Access to finance for innovative SMEs since the financial crisis. Research policy, 44(2), pp.370-380.
Mason, C.M. and Harrison, R.T., 2015. Business angel investment activity in the financial crisis: UK evidence and policy implications. Environment and Planning C: Government and Policy, 33(1), pp.43-60.
Merigó, J.M., Mas-Tur, A., Roig-Tierno, N. and Ribeiro-Soriano, D., 2015. A bibliometric overview of the Journal of Business Research between 1973 and 2014. Journal of Business Research, 68(12), pp.2645-2653.
Reuters 2018. [Online] Available at: http://www.reuters.com/finance/stocks/ [Accessed: 28 January 2019]
STONER, J.A. and WERNER, F.M., 2018. Transforming finance and business education: Finance’s unique opportunities. Journal of Management for Global Sustainability, 5(2), pp.15-52.
Woolworth Group. 2018. Annual Report. [Online] Available at: https://www.woolworthsgroup.com.au/icms_docs/195396_annual-report-2018.pdf. [Accessed: 28 January 2019]
Woolworth Group. 2018. Company Profile. [Online] Available at: https://www.woolworthsgroup.com.au/page/about-us/our-brands. [Accessed: 28 January 2019]


