MSc Management Data Driven Decisions for Business Assignment Sample
1. Introduction and project plan
1.1 Purpose of the report
The report will focus on discovering the answer to the main research question which is “Did the marketing campaign have a positive impact on sales performance in the UK?”. While developing the report the case study of WFTT and BIJ where the former is a data analytics consultancy firm and the latter is a Jewellery business.
In order to proceed with the report and derive the answer to the research question, firstly the overview of the business and the project plan will be assessed. Further, a couple of data analytics issues will be examined that are faced by BIJ and the solution to these issues will also be proposed.
Analysis of the data will be done based on the monthly sales value in the report. Data charting and comparisons will take place based on sales volume and performance in various markets of the company. Overall, recommendations for business improvement will be developed.
1.2 Project plan for delivering the project
The project plan that can be undertaken for the development of the project can rely on the components of PMBOK principles including project initiation, planning, execution, monitoring, and adjournment (Delmerico and Scaramuzza, 2018).http://MSc Management Data Driven Decisions for Business Assignment Sample
The application of statistical tools will be done for completing the project on time. First evaluation of the business performance and its present operations along with the products services it offers will be done followed by an investigation of its business environment. The implementation of selected statistical tools will take place for the development of results.

Figure 1: Project plan
(Source: Created by learner)
1.3 Data analytics framework
A primary quantitative framework will be applied for the development of the answers to the research question. The current situation, market conditions, opportunities, sales, and performance of the company will be scrutinised by WFTT.
The application of primary quantitative data analysis will be done due to its ability to assess the properties of business performance previously identified. The statistical tool that has been Undertaker for conducting the research is supported by an application of Microsoft Excel.
Additionally, the application of descriptive analysis will be incorporated for examining average skills volume along with the value of sales made by the company (Chen et al. 2017).http://MSc Management Data Driven Decisions for Business Assignment Sample Comparisons will be done through benchmarking and the use of graphical representations and charts will be inserted with a report for indicating the company’s performance in its respective market.
1.4 Key performance indicators of BIJ
Key performance indicators are properties of business performance or outcomes that are quantifiable and can be used for measuring business success. BIJ is a multinational Jewellery Company that is presently operating in Europe, North America as well as Asia.
The KPIs that can be used for assessing the performance of the company include response to its marketing strategies, the variations of the product line, and sales generation that allows the business to Undertake Business expansion (Blazek et al. 2021). http://MSc Management Data Driven Decisions for Business Assignment Sample
Sales of the company take place through its distribution network and the small number of Signature stores that are operational in New York, Mumbai, and London. The company presently does not have any operations in Africa, Australia, and South America where it is willing to expand its services in the future. The company aims to compete with large organisations such as Signet, Cartier, and LVMH.
2. Data quality issues and remedies
2.1 Data issues and mitigation methods
Some of the most common forms of data issues in recent times include poor quality data, duplicate data inaccurate data, hidden data inconsistent data, and many more. Poor data quality impacts the overall performance of a project as the performance of the project is supposed to decline.
The implications are the same in the presence of duplicate data where the data present is repeated and inconclusive (Biaudet, 2017).http://MSc Management Data Driven Decisions for Business Assignment Sample Hidden data is a cause of misinterpretations of the data set or area evaluated.
Implications of poor data quality and inaugurated data are the same which impact the quality of the project or performance. Inconsistency in data sets indicates that the data procured is not accurate and feasible in the present position. Identification of data issues in them by regularly scrutinising and monitoring them (Ienca et al. 2018). http://MSc Management Data Driven Decisions for Business Assignment Sample
These genetic data-related issues can be mitigated through the contribution made by all the organisational stakeholders associated with an exchange of relevant information. Organisational data strategy must also be prioritised which will simplify the management of data sets while data experts will only perform the duty.
2.2 Addressing data issues in BIJ
The data issues found within the data set of BIJ have been determined through monitoring and observation of the data closely and carefully comparing all the variables in the data sets.
Inadequate data
The offer data set has missing information on values in certain areas. For instance, the data set must incorporate data on the Japanese market of the company as a hindrance in the estimation of the outcomes of the Company’s sales values and sales volume (Muhammad et al. 2020).http://MSc Management Data Driven Decisions for Business Assignment Sample
Inconsistency of data
Inconsistent data have been determined within the data set provided as the currencies in which these data are available vary as per their respective country (Felix et al. 2017). http://MSc Management Data Driven Decisions for Business Assignment SampleThe identification or conversion of these currencies into a unified currency is likely to provide inaccurate data results.
Inaccurate data
Data sorting and filtering are impacted when the data provided in the data set is accurate. The use of incorrect wordings or spellings for the products that are included in the data set is likely to result in wrongful estimation (Simsek et al. 2021).http://MSc Management Data Driven Decisions for Business Assignment Sample
Intending to address the data issues that have been formerly determinant in the data set of the company provided it can be assumed that the persistence of these issues is likely to impact the outcome of the marketing campaign that will be undertaken by the company (De Pelsmacker et al. 2018).http://MSc Management Data Driven Decisions for Business Assignment Sample
Therefore, for avoiding a decline in operational performance and financial losses incurred, the application of data imputation techniques and multiple imputation techniques have the potential of removing adequate data issues and inaccurate data issues.
Additionally, the implementation of automation tools can bring about a beneficial circumstance where the results from the statistical analysis will be high in quality making it easier for marketing managers to implement changes within their marketing campaign.
3. Data analysis and commentary
TABLE A
| Yearly Analysis | Monthly analysis | ||||||
| Sales volume | Sales Value | Sales volume | sales Value | ||||
| Mean | 9853 | Mean | 11588239 | Mean | 2463.25 | Mean | 2897059.75 |
| Standard Error | 337.5460462 | Standard Error | 578138.113 | Standard Error | 153.5734019 | Standard Error | 214604.7671 |
| Median | 10035 | Median | 11789819 | Median | 2462.5 | Median | 2928010 |
| Mode | #N/A | Mode | #N/A | Mode | #N/A | Mode | #N/A |
| Standard Deviation | 584.646902 | Standard Deviation | 1001364.586 | Standard Deviation | 531.9938696 | Standard Deviation | 743412.7204 |
| Sample Variance | 341812 | Sample Variance | 1.00273E+12 | Sample Variance | 283017.4773 | Sample Variance | 5.52662E+11 |
| Kurtosis | #DIV/0! | Kurtosis | #DIV/0! | Kurtosis | 0.962211957 | Kurtosis | 1.283325907 |
| Skewness | -1.265093693 | Skewness | -0.869164384 | Skewness | 0.740948594 | Skewness | 0.846616768 |
| Range | 1126 | Range | 1972060 | Range | 1950 | Range | 2689106 |
| Minimum | 9199 | Minimum | 10501419 | Minimum | 1648 | Minimum | 1878218 |
| Maximum | 10325 | Maximum | 12473479 | Maximum | 3598 | Maximum | 4567324 |
| Sum | 29559 | Sum | 34764717 | Sum | 29559 | Sum | 34764717 |
| Count | 3 | Count | 3 | Count | 12 | Count | 12 |
| Confidence Level(95.0%) | 1452.343417 | Confidence Level(95.0%) | 2487527.53 | Confidence Level(95.0%) | 338.0127786 | Confidence Level(95.0%) | 472341.9077 |
Table 1: Trends in data of sales volume and value categorised by month and year
(Source: Created by learner)
BIJ has been found to have stability in its operational and financial performance depicting the feasibility of the marketing campaign undertaken by the company for Business expansion into new markets and achieving competitive advantage. The mean of the sales value and volume has been derived which is 2463.25 and £ 2897059.75 respectively.
The company is selling 2464 products on an average monthly basis. Within the observation period, the average amount of products that have been sold by the company in all its markets is £ 2897059.75.
While assessing the yearly mean of sales value (£ 11588239) and volume (9853) the average number of Jewellery items sold by the company is 9853. The propounded average sales made by the company is £ 11588239.00 which makes it highly stable in its business environment.
TABLE B
| Sales volume | Benchmark | Sales value | Benchmark | |
| Yearly analysis | ||||
| 2018 | 2303 | 2300 | £ 19,33,006.00 | £ 15,40,000.00 |
| 2019 | 2247 | 2350 | £ 17,94,417.00 | £ 18,00,508.00 |
| 2020 | 2583 | 2450 | £ 22,59,426.00 | £ 22,00,000.00 |
| Quarterly analysis | ||||
| Q1 | 1754 | 1800 | £ 13,92,767.00 | £ 14,00,000.00 |
| Q2 | 2114 | 1900 | £ 18,28,188.00 | £ 17,57,610.00 |
| Q3 | 1979 | 1900 | £ 17,01,763.00 | £ 18,00,513.00 |
| Q4 | 1286 | 1300 | £ 10,64,131.00 | £ 12,56,420.00 |
Table 2: Benchmarking of category performance
(Source: Created by learner)
The above tabular representation offers a depiction of the benchmarking of category performance of BIJ in terms of the UK market including sales volume and value.
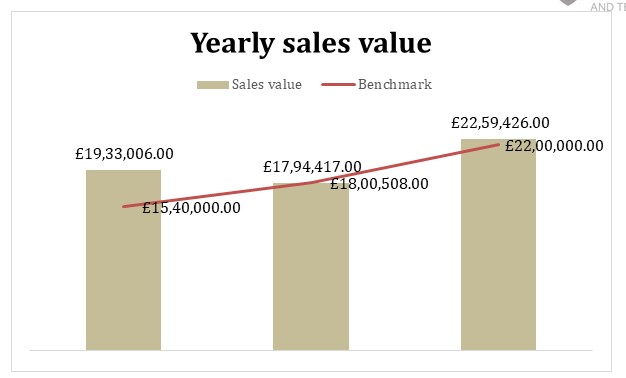
Figure 2: Benchmarking the UK yearly sales value of BIJ
(Source: Created by learner)
As depicted by the graphical representation inserted above the performance of the company between the period 2018 to 2020 can be labelled satisfactory as the company has been able to meet its sales target.
However, the company failed to meet its annual target in the year 2019 as a result of the inadequate operation of practices that led to improper business operations.
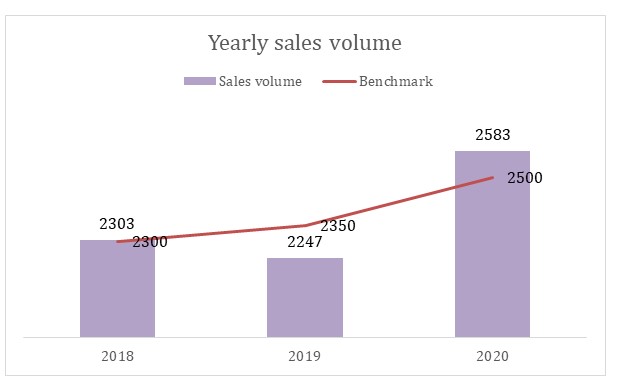
Figure 3: Benchmarking UK quarterly sales volume of BIJ
(Source: Created by learner)
The representation of the yearly sales volume of BIJ in the UK market has been offered above. The data indicates that the company has implied good performance between 2018 to 2020 however a decline in operational performance can be observed in 2019 due to which the company failed to meet its annual target.
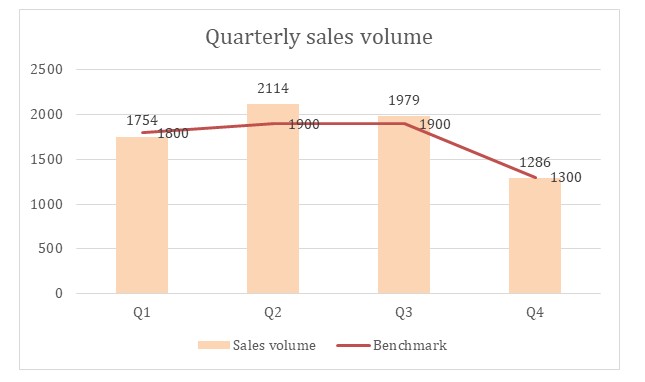
Figure 4: Benchmarking UK quarterly sales volume of BIJ
(Source: Created by learner)
BIJ’s quarterly sales volume has been provided in the above bar graph in terms of the UK market. In the consecutive years of 2018, 2019, and 2020, the company was able to achieve its benchmarking targets in the second and third quarters of the year.
However, a lag in the first and 4th quarters of these years can be observed indicating the need for new business strategies that will increase organisational innovation in terms of marketing.
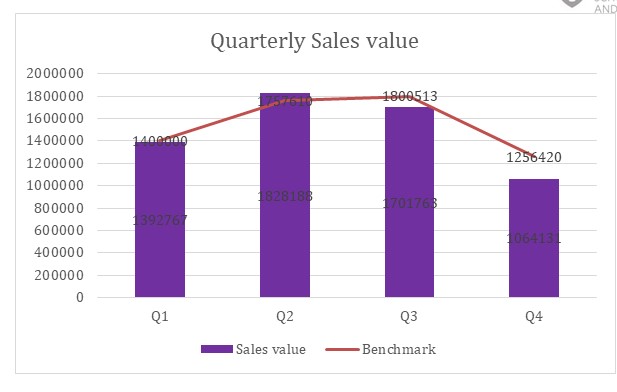
Figure 5: Benchmarking UK quarterly sales value of BIJ
(Source: Created by learner)
The quarterly sales value in the UK market undertaken by BIJ can be observed in the above graphical presentation. From the representation, it reflects that the second quarter’s sales value is feasible for achieving benchmark targets.
The remaining three quarters will need enhancements and improvements for meeting the targets of the company.
TABLE C
| Sales volume | Benchmark | Sales value | Benchmark | |
| Yearly analysis | ||||
| 2018 | 10325 | 10000 | £ 1,24,73,479.00 | £ 1,20,00,000.00 |
| 2019 | 10035 | 10000 | £ 1,17,89,819.00 | £1,18,00,000.00 |
| 2020 | 9173 | 9000 | £ 1,04,65,172.00 | £1,02,00,000.00 |
| Quarterly analysis | ||||
| Q1 | 7548 | 5000 | £ 89,47,049.00 | £ 90,00,000.00 |
| Q2 | 8080 | 7000 | £ 95,73,560.00 | £ 85,00,000.00 |
| Q3 | 7925 | 6200 | £ 92,67,934.00 | £ 70,00,000.00 |
| Q4 | 6006 | 5900 | £ 69,76,173.00 | £ 75,00,000.00 |
Table 3: Benchmarking
(Source: Created by learner)
The above provided tabular format reflects the comparison of benchmarks between sales volume and value of BIJ on a quarterly and monthly basis.
The table offers data and insights on the performance of the company in all its markets including the UK.
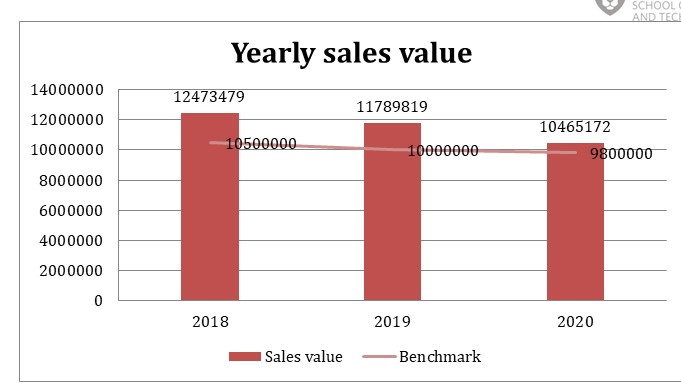
Figure 6: Yearly benchmarking of BIJ sales value
(Source: Created by learner)
The above figure is representative of the targets achieved by BIJ in the year 2018. Upon close observation, it has been found that the company failed to meet its target in 2019 however was extremely close to it indicating that few improvements will optimise the company’s marketing capabilities and it is on the right track.
However, disappointingly the company failed to do so and its performance declined dramatically in 2020 which is far away from its target.
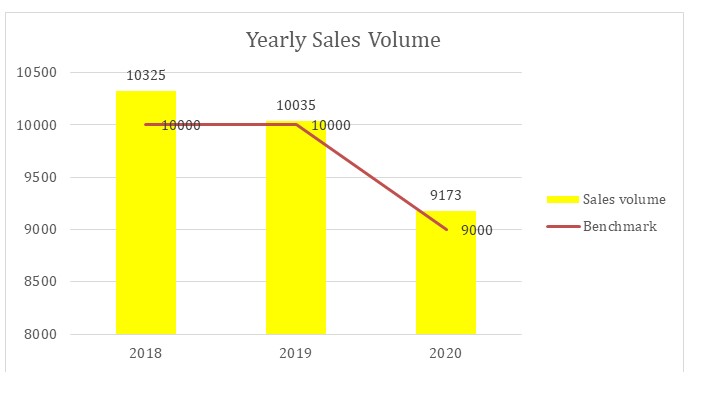
Figure 7: Yearly benchmarking of BIJ sales volume
(Source: Created by learner)
Based on the above image, it can be said that the annual performance of BIJ has significantly fallen within the period 2019 to 2020.
This is a reflection that the company is not being able to accurately assess and determine the issues it is facing thus the solutions formulated are also ineffective.
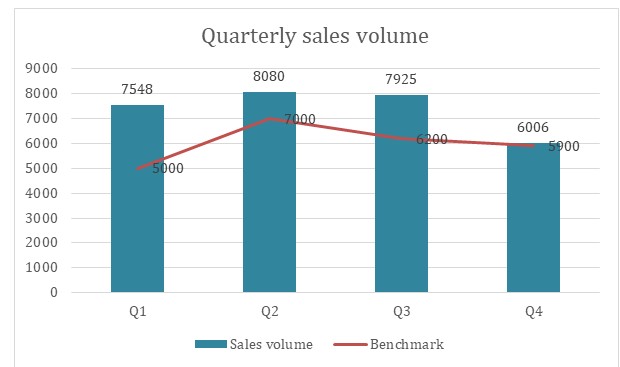
Figure 8: Quarterly benchmarking of BIJ sales volume
(Source: Created by learner)
Addressing the quarterly sales volume of BIJ, it can be derived that the performance of the company has been consistent and satisfactory.
However, there is more room and scope for improvements in the performance for which BIJ will have to implement suitable marketing initiatives.
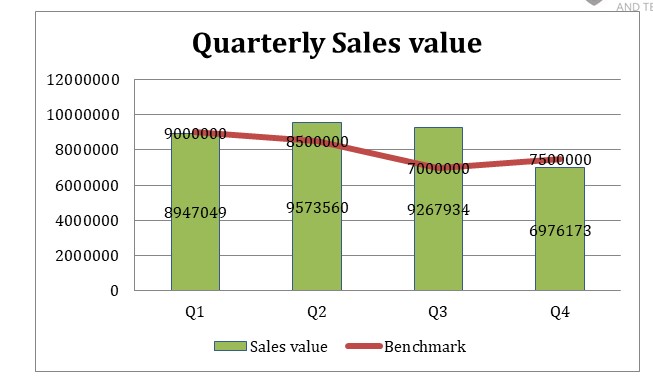
Figure 9: Quarterly benchmarking of BIJ sales value
(Source: Created by learner)
It can be derived from the above figure that in order to meet annual targets, BIJ has emphasised the development of quarterly targets.
Despite these efforts, the company has been failing in fulfilling its objectives repeatedly. This calls for the company to review the strategies of marketing it is undertaking presently and in the future.
4. Data charting and commentary
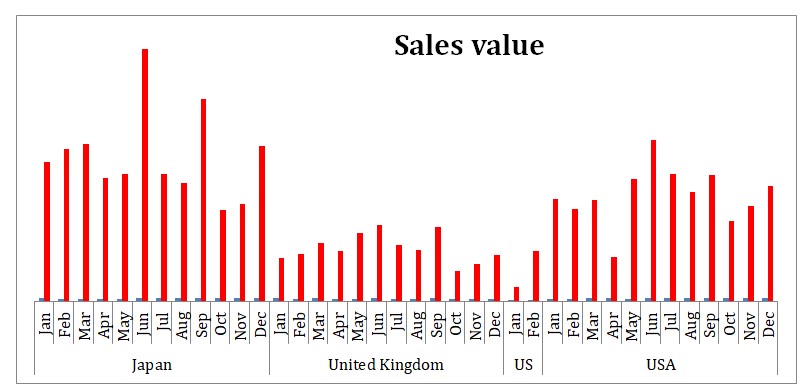
Figure 10: Comparison of sales value trends across markets over time
(Source: Created by learner)
As per the chart of sales value trends across BIJ markets, the comparison derived indicates that the maximum bumper of items has been sold by the company in the Japanese market.
Further, the assessment has been drawn that the peak season for BIJ is around June and July. However, the performance shown by the company in the UK market is not satisfactory for achieving the business target.
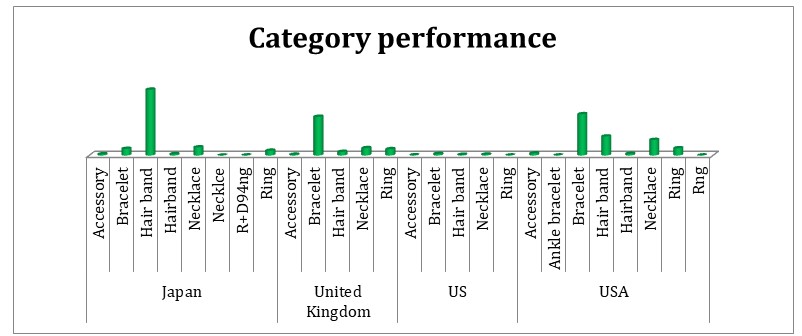
Figure 11: Category performance comparisons between markets
(Source: Created by the learner)
The chart of category performance is symbolic that the four markets of the company undertake the same category performance respectively. Additionally, it has been concluded that one of the highest-selling products of the company is its hairband products.
On the other hand, the sale of BIJ’s bracelets can be considered satisfactory. Moreover, overall stable performance in terms of sales of items or products of the company has been depicted in the dataset.
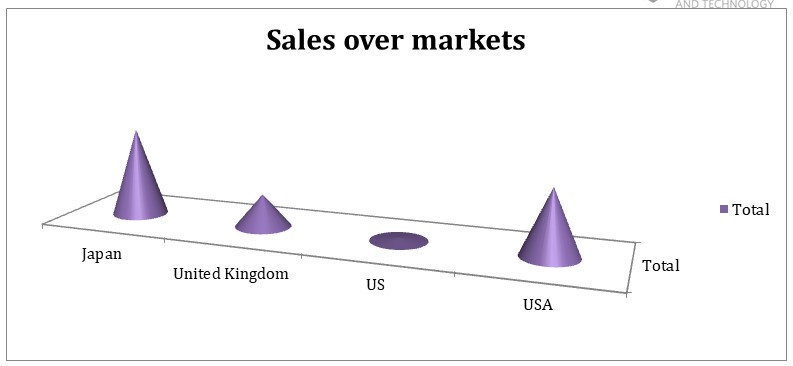
Figure 12: Impact of the marketing campaign in the UK and other markets
(Source: Created by learner)
It can be observed that the sales performance of BIJ over its four target markets is highly inconsistent. It has been found that the number of items sold by the company is highest in the USA and Japanese markets.
The sales value of the company in the UK market was £5986848.79 which is an indication of the inefficiency as well as the inadequacy of the marketing campaign launched in the UK market.
Thus, it can be derived that the best marketing strategies are implemented and can be found in the Japanese markets and USA. The positive outcome of this efficiency is a substantial increase in the sales of the company.
Thus, the company can be said to have made the most out of the opportunities available in the markets of Japan and the USA. For it has been analysed that the marketing approach undertaken by the company in its UK market is not optimal therefore modifications are required in it.
The company’s failure to meet the annual target in the years 2019, as well as 2020, consecutively is an indication that marketing campaigns have an inevitable influence on the sales performance of the company in its UK market (Hamidi and Jahanshahifard, 2018). http://MSc Management Data Driven Decisions for Business Assignment SampleThe company needs to work more on its networking abilities for increasing consumer engagement there to motivate them to purchase companies’ products.
5. Conclusion and recommendations
5.1 Conclusion
Addressing the above discussions, it can be derived that the performance of BIJ has been most accurate in Japan and the USA. However, the company’s performance needs to incorporate improvements in its marketing strategies regarding the inefficiency recognised in the UK market sales made by the company.
Therefore, it can be concluded that the impact of the marketing campaign on the UK performance and sales was not effective enough for the generation of optimal sales and revenue. Based on the necessary recommendations provided, the areas that the company needs to review include its nature of engagement with target audiences and knowledge of customer expectations.
The channels in which the company engages with its audiences must also be reviewed for its Optimisation.
5.2 Recommendations
In order to mitigate the issues that the company has been having in terms of establishing feasible marketing techniques, it is recommended that the company applies social media marketing strategies which is an ideal channel for optimising consumer satisfaction, engagement, and Measurement.
It is a cost-efficient and time-efficient method where the company can post about its products and their benefits for creating awareness among its target audiences.
Moreover, companies can launch interactive sessions or activities where their consumers are likely to derive prizes, free goodies, vouchers, and other benefits (George and Mallery, 2016).http://MSc Management Data Driven Decisions for Business Assignment Sample Moreover, collaborating with social media influencers increases the value of the company along with its awareness.
The topmost rated social media platforms are Twitter, Facebook, Instagram, and YouTube. The company can also undergo the strategy of conducting promotional events as a part of its marketing campaign where it can engage with its target audiences directly on a face-to-face level (Ardito et al. 2019).http://MSc Management Data Driven Decisions for Business Assignment Sample This will increase the impact and interpersonal relations between the company and its consumers while consumer expectations from the product of the company will be understood by the company.
Reference List
Journals
Ardito, L., Scuotto, V., Manlio, D.G. and Petruzzelli, A.M. (2019). A bibliometric analysis of research on Big Data analytics for business and management. Management Decision, 57(8), pp. 1993-2009. Available through: Google Scholar [Accessed 16 April 2022]
Biaudet, S. (2017). Influencer marketing as a marketing tool: The process of creating an Influencer Marketing Campaign on Instagram. Available through: Google Scholar [Accessed 16 April 2022]
Blazek, K., van Zwieten, A., Saglimbene, V., and Teixeira-Pinto, A. (2021). A practical guide to multiple imputation of missing data in nephrology. Kidney International, 99(1), 68-74. Available through: Google Scholar [Accessed 16 April 2022]
Chen, W., Zhou, K., Yang, S., and Wu, C. (2017). Data quality of electricity consumption data in a smart grid environment. Renewable and Sustainable Energy Reviews, 75, 98-105. Available through: Google Scholar [Accessed 16 April 2022]
De Pelsmacker, P., Van Tilburg, S., and Holthof, C. (2018). Digital marketing strategies, online reviews and hotel performance. International Journal of Hospitality Management, 72, 47-55. Available through: Google Scholar [Accessed 16 April 2022]
Delmerico, J., and Scaramuzza, D. (2018, May). A benchmark comparison of monocular visual-inertial odometry algorithms for flying robots. In 2018 IEEE International Conference on Robotics and Automation (ICRA) (pp. 2502-2509). IEEE. Available through: Google Scholar [Accessed 16 April 2022]
Felix, R., Rauschnabel, P.A. and Hinsch, C. (2017). Elements of strategic social media marketing: A holistic framework. Journal of Business Research, 70, pp.118-126. Available through: Google Scholar [Accessed 16 April 2022]
George, D. and Mallery, P. (2016). Descriptive statistics. In IBM SPSS statistics 23 step by step (pp. 126-134). Routledge. Available through: Google Scholar [Accessed 16 April 2022]
Hamidi, H., and Jahanshahifard, M. (2018). The Role of the Internet of Things in the Improvement and Expansion of Business. Journal of Organizational and End User Computing (JOEUC), 30(3), 24-44. Available through: Google Scholar [Accessed 16 April 2022]
Ienca, M., Vayena, E., and Blasimme, A. (2018). Big data and dementia: charting the route ahead for research, ethics, and policy. Frontiers in medicine, 5, 13. Available through: Google Scholar [Accessed 16 April 2022]
Muhammad, N.R., Ain, F.J., Rohaya, A.J. and Thi, K.N. (2020). Big data analytics for predictive maintenance in maintenance management. Property Management, 38(4), pp. 513-529. Available through: Google Scholar [Accessed 16 April 2022]
Simsek, S., Albizri, A., Johnson, M., Custis, T. and Weikert, S. (2021). Predictive data analytics for contract renewals: a decision support tool for managerial decision-making. Journal of Enterprise Information Management, 34(2), pp. 718-732. Available through: Google Scholar [Accessed 16 April 2022]

