AAF044-6 Accounting and Finance Assignment Sample
Module code and Title: AAF044-6 Accounting and Finance Assignment Sample
Introduction
The following study is based on a financial statement and its competitive analysis of a UK-based retail company named Wm Morrison supermarket plc. This company is trading as Morrisons and stood at the fourth largest supermarket company in the UK in terms of grocery market share. Apart from this, Morrison was established in the financial year 1899 and currently, this company has 497 supermarket stores across England (Morrisons-corporate.com, 2021).
This company has a mission to make and provide good food they all are proud of. In this assignment, the company’s financial performance for the financial years 2021 and 2020 has been evaluated with the help of ratio analysis. Other than this, financial tools are used to measure its competitiveness in the market. This study aims to measure the financial performance of the colony and the cause of change in the financial statement of the company.
Part A
Ratio analysis
It is an effective financial tool combining two components of a financial statement. This provides scope to measure company performance in terms of liquidity, profitability and efficiency ratio. Morrison’s performance has been measured with the help of the financial ratio which is associated with investor relations. Data from the financial years 2020 and 2021 has been collected from the annual report of the company.
Profitability ratio
Profit is an essential component of the colony which provides scope for the colony to operate on the market effectively. As opined by Nariswar and Nugraha (2020, p.89), without profits, business existence cannot be imagined. Thus the profit-generating activity is the core activity of an organization. Ratios such as net profit margin and gross profit margin are being used to measure a company’s profit-generating ability. The gross profit ratio highlights the amount of profit which is deducted after charging the direct expenses of the company.
 Figure 1: Profitability ratio (Source: self-made)
On analysis of Morrison’s gross profit margin, it has been found that the company has a gross margin of 3.59% in 2020 and 2.20% in the financial year 2021. As opined by Ledley et al. (2020, p.843), this signifies that the company’s performance in maintaining its gross margin is quite low. Hence, thus companies need to have effective control over the cost of goods sold.
Furthermore, the net profit margin of the company depicts that the company has a very low margin on its revenue which is less than the industry benchmark. A net profit margin of 0.55% in 2021 and 1.96% in 2020 highlights that company profitability has declined over the period. Declining in net profit is not suitable for the financial health of the company. Thus Morrison needs to have an effective strategy for the profitability company.
Efficiency ratio
A ratio like an asset turnover ratio is used to ensure company effectiveness in the context of the use of financial resources of the company. As per the view of Qamara et al. (2020, p.92), the current era of the market is quite competitive thus focusing more on cost reduction is a better strategy for the company rather than charging a high price for the product.
A business through a better strategy in terms of using its assets can be able to increase both profitability and efficiency in terms of use of assets. Financial matrices like asset turnover highlight the number of times revenue more than its total asset.
 Figure 2: Asset turnover ratio (Source: self-made)
Analysis of the company asset turnover ratio has observed that Morrison has 1.47 times its revenue than its asset. This indicates that the company is effectively using its financial resources for enhancing its total sale (Irman, and Purwati, 2020, p.42). This value has increased in the financial year 2021 as the company’s total revenue has increased.
The asset turnover ratio of a company has increased to 1.53 times. This indicates that company performance of the company has increased in the financial year 2021 as compared to the financial year 2020. This highlight that company’s overall performance has increased in the financial year 2021 as it adopts an effective cost reduction strategy and asset management strategy.
Liquidity ratio
Company ability in terms of meeting short-term debt and liability can be measured through the help of ratios such as current assets and quick ratio. As per the view of Tumanggor (2020, p.138), the current ratio can be calculated with the help of the current assets and current liabilities of the company. Analysis of the current ratio of Morrison highlights that this company has less current ratio than the industry benchmark.
Morrison has a current ratio of 0.39 in 2020 and 0.48 in 2021. This depicts that the company has a higher amount of current liability than its current asset. This led to a negative impact on the financial health of the company and its operational efficiency. Other than this, the company has less effective working capital management which can be seen from the combination of current assets and liabilities.
This signifies that the overall performance of the business has been affected to a greater extent due to less effective working capital management ability. Moreover, the company’s quick ratio has also decreased with a decrease in the current ratio. The quick ratio measures the pure liquidity performance of the company as it considers that assets can quickly be converted into cash.
 Figure 3: Liquidity ratio (Source: self-made)
The quick ratio of Morrison in 2020 stood at 0.19 which is quite low. In order to compete in the global market an organization needs to have a minimum 1 of its quick ratio. As cited by Suryanengsih, and Kharisma, (2020, p.1565), Such a low amount of quick ratio has a negative impact on the financial health of the company. Other than this, it has also been found that in the financial year quick ratio of Morrison has slightly increased and stood at 0.21 which is still lower than the industry benchmark.
Hence, it can be said that the company’s liquidity performance is not quite good which may have a negative impact on its strategic and financial position in the global market. Using effective working capital management seems an effective tool through which a company can be able to increase its financial position in the market.
Investor ratio
Investor and shareholder are key performance indicators of a business organization in order to attain continuous growth and success needs to have an effective strategy to engage this aspect of the company. As opined by Yanto et al. (2021, p.310), providing better returns to its shareholder and inverter seems an effective tool through which Morrison can be able to increase its financial position and engage shareholders effectively.
Ratios such as debt-equity ratios are a financial matrix which is used to measure a company’s ability to attract and engage shareholders. Debt ratio is the pure ratio which uses components of the balance sheet such as total debt and equity. Equity consists of shareholder funds of the company, reserve and surplus. On the other hand, total debt consists of the long-term viability of the company.
 Figure 4: Debt equity ratio (Source: self-made)
Analysis of Morrison’s debt-equity ratio highlights that the company has more debt than its equity. This financial matrix is used to measure company capital structure and firm performance in terms of using sources of funds. A company which has higher debt than its liability highlights a high amount of risk. As argued by Supriati et al. (2019, p.105), a high debt-equity ratio highlights the company’s resilience to loans and advances.
This indicates that the company needs to minimize the proportion of debt over liability. Other than this, Morrison has a debt-equity ratio of 1.62 in 2021 which is higher than in the financial year 2020. An increase in debt-equity had a negative impact on the financial health of a company as it depicts a high amount of risk. Hence, it can say that Morrison needs to increase the proportion of equity capital to minimize the cost of capital and increase its financial performance in the market.
Part B
Competitor analysis
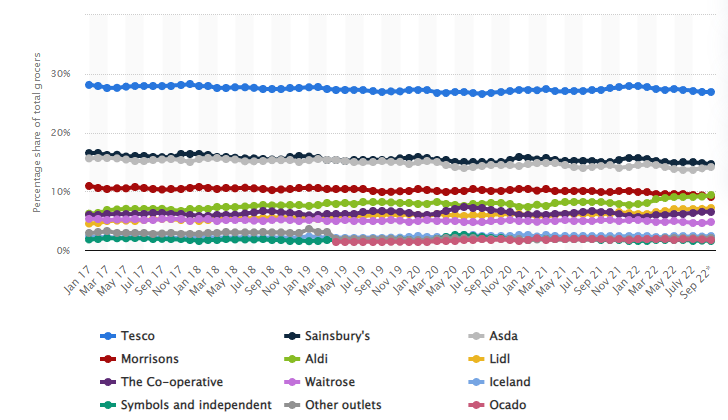 Figure 5: Market Share of different companies in the UK (Source: Statista,2022)
As there are various companies in the retail chain business in the UK so the competition is too high in this industry. If we compare in terms of market share then Morrisons is just after three of its competitors that is Tesco, ASDA, and Sainsbury’s (Utami, 2017,p.2).
So in this research proposal, the company is being compared to one of the key players in the market of the Uk that is Sainsbury’s Plc.
Both the companies work in the same industry but if we compare then it can be seen that Sainsbury is quite bigger in terms of Market capitalization. The company is been compared in terms of different financial ratios that are been discussed below for the years 2020 and 2021:
Profitability Ratio
These ratios tell about the profitability of the company so two ratios are calculated under this heading.
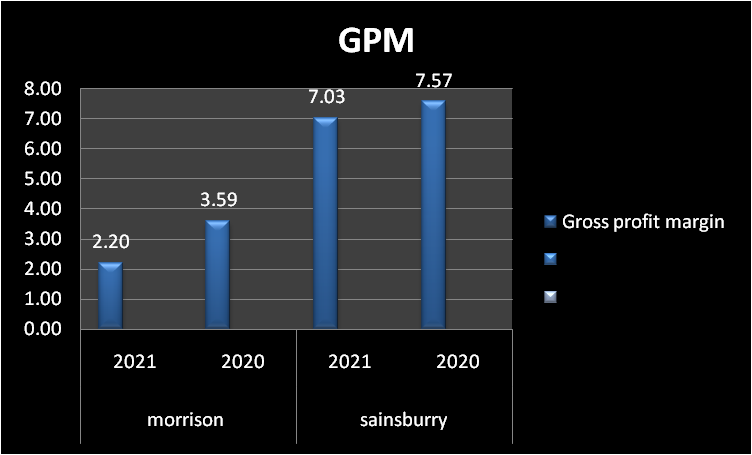 Figure 6: Comparison of GPM of the two companies (Source: Self-made)
In the first place, the GPM has been calculated for the company. It is seen that in the year 2021 The GPM of Morrison is 2.20 whereas the GPM of Sainsbury has a higher GPM that is 7.03. So, it is seen that Morrison is not able to make a good profit after deducting its operating cost. This indicates that Sainsbury Plc has good management, and it is working in a more efficient way in terms of operations. It is also seen that Morrison GMP has fallen from 2020 to 2021 with a greater percentage when compared to Sainsbury.
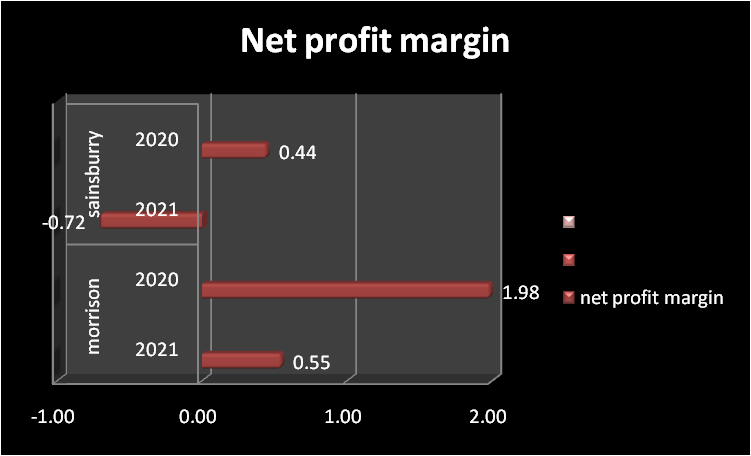 Figure 7: Comparison of NPM of the two companies (Source: Self-made)
In the above figure, there is a comparison of NPM. It is seen that in 2021 where Morrison had a positive NPM of 0.55 compared to Sainsbury who’s NPM for the year 2021 became -0.72. This says that Sainsbury is spending more on non-operating expenses when compared to Morrison. As Sainsbury is doing more advertising and marketing that is the reason its NPM drops so much from GPM (Sainsburys.co, 2022). Whereas Morrison does not spend a lot of money on advertising and marketing.
So, Morrison should try to increase the Its GPM so that it can spend a healthy amount on marketing and advertising so that it can generate more revenue in the future and also maintain a positive NPM. So in terms of NPM, Morrison is better compared to Sainsbury but in the case of making a profit in terms of gross profit then Sainsbury has the upper hand because Sainsbury generates more revenue because of its greater market share.
Liquidity Ratio
For comparing the two companies in terms of liquidity of the company two ratios are calculated that give an overview of the financial condition of the company.
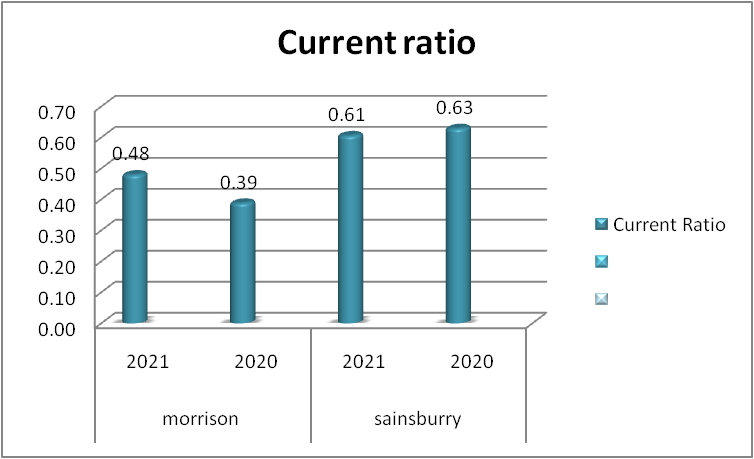 Figure 8: Comparison of the Current Ratio of the two companies (Source: Self-made)
In the first place, the current ratio is calculated. The higher the current ratio the better the position of the company in terms of financial condition (Madushanka, and Jathurika, 2018,p.1). So, it can be seen that the current ratio of Morrison is 0.39 and 0.48 for the years 2020 and 2021 respectively whereas for Sainsbury the current ratio for the years 2020 and 2021 is 0.47 and 0.63 respectively.
Both companies have a current ratio of less than one that means that they are not at a good stage. Both companies should try to take the current ratio greater than one. It is good to see that Morrison is trying to increase its current ratio when compared to Sainsbury. Sainsbury’s current ratio decreased whereas the current ratio of Morrison has increased compared to 2020
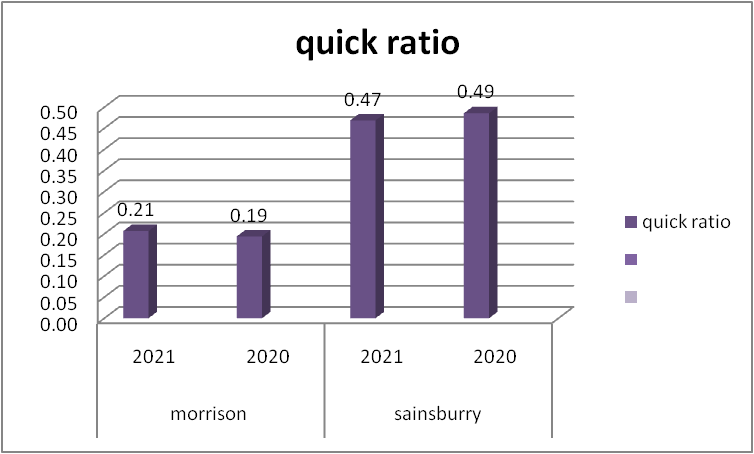 Figure 9: Comparison of the Quick Ratio of the two companies (Source: Self-made)
The next ratio that is compared under the liquidity ratio is the Quick ratio, which is also known as the Acid test ratio (Haleem and Jehangir 2017,p.4). Just like the current ratio, it is seen that the quick ratio has increased from 0.19 to 0.21 Morrison but the quick ratio of Sainsbury’s has dropped to 0.47 from last year where it was 0.49. It is also seen that in the current asset the weightage of inventory in the case of Morrison is more compared to Sainsbury due to which the Quick ratio of Morrison is much different from its current ratio when compared to Sainsbury.
Asset ratio
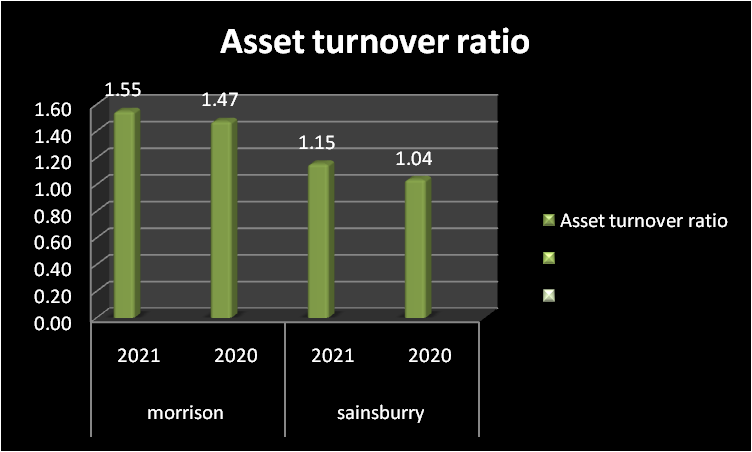 Figure 10: Comparison of Asset turnover Ratio of the two companies (Source: Self-made)
The asset turnover ratio of Morrison is more than that of Sainsbury. The Asset turnover ratio of Sainsbury is 1.04 in 2020 and 2021 it was 1.15 whereas the Asset turnover ratio of Morrison is 1.47 in 2020 and in 2021 it was 1.55. This implies that Morrison is more effectively using its assets in order to generate more revenue compared to Sainsbury.
As Sainsbury is a bigger company so it might be the case that it is not that effective in using its assets. Both companies showed a rise in the Asset turnover ratio so they should move forward. There might be a problem in the future when Motion would try to expand its business then there is a possibility that the Asset would not be able to use the Asset completely and in that case, the Asset turnover ratio might fall for Morrison Plc.
Debt Equity Ratio
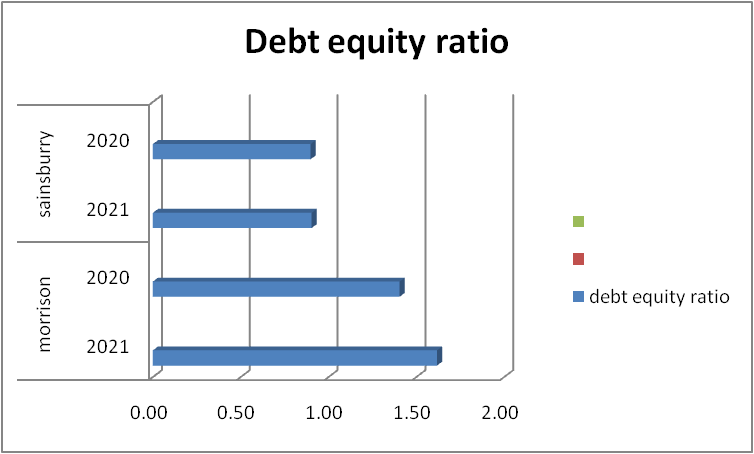 Figure 11: Comparison of the Debt Equity Ratio of the two companies (Source: Self-made)
The D/E ratio is one of the key ratios to compare the financial condition of the company. It plays a great role when an investor chooses a company. It can be seen that Sainsbury is able to maintain the D/E ratio the same for both the year that is 0.9 whereas the D/E ratio is Morrison is on the higher side and it has also increased from 1.40 in 2020 to 1.62 in 2021. So the company should try to reduce its debts as this will hamper its working. Whereas a good D/E ratio is below one (Efendi, et al. 2019,p.1).
Conclusion
On the basis of the financial statement analysis of Morrison for the financial years 2020 and 2021, it can conclude that company profitability has declined. The impact of vivid has negatively affected its profit marking ability. Other than this, company liquidity has also declined in the financial year 2021 as compared to 2020. It can conclude that this company has less effective working capital management which leads to minimizing its operational efficiency of the company. Moreover, company performance in terms of utilization of resources in increasing revenue has increased in the financial year 2021.
This has a positive impact on the strategic and financial performance of the market. It can be further concluded that the debt-equity ratio of Sainsbury has better capital management and liquidity capacity than Morrison. In this situation, it is necessary for the company to focus on this aspect through which the overall competitiveness of Morrison can be increased. Morrison has a better net profit than Sainsbury which provides a competitive advantage in the market.
References
Journal
Irman, M. and Purwati, A.A., 2020. Analysis of the influence of current ratio, debt to equity ratio and total asset turnover toward return on assets on the otomotive and component company that has been registered in Indonesia Stock Exchange Within 2011-2017. International Journal of Economics Development Research (IJEDR), 1(1), pp.36-44.
Ledley, F.D., McCoy, S.S., Vaughan, G. and Cleary, E.G., 2020. Profitability of large pharmaceutical companies compared with other large public companies. Jama, 323(9), pp.834-843.
Madushanka, K.H.I. and Jathurika, M., 2018. The impact of liquidity ratios on profitability. International Research Journal of Advanced Engineering and Science, 3(4), pp.157-161.
Nariswari, T.N. and Nugraha, N.M., 2020. Profit growth: impact of net profit margin, gross profit margin and total assets turnover. International Journal of Finance & Banking Studies (2147-4486), 9(4), pp.87-96.
Qamara, T., Wulandari, A., Sukoco, A. and Suyono, J., 2020. The Influence of Current Ratio, Debt to Equity Ratio, And Total Asset Turnover Ratio on Profitability of Transportation Companies Listed On the Indonesia Stock Exchange 2014-2018. IJIEEB International Journal of Integrated Education, Engineering and Business eISSN 2615-1596 pISSN 2615-2312, 3(2), pp.81-93.
Supriati, D., Kananto, R. and Kusriananda, A., 2019, February. The effects of intellectual disclosures capital, debt-to-assets ratio, debt-equity ratio, company size and assets turnover on company profitability. In 5th Annual International Conference on Accounting Research (AICAR 2018) (pp. 104-109). Atlantis Press.
Suryanengsih, T.D. and Kharisma, F., 2020. Pengaruh Current Ratio dan Quick Ratio Terhadap Harga Saham pada Perusahaan Consumer Goods yang Tercatat di BEI Periode Tahun 2013–2017. Borneo Student Research (BSR), 1(3), pp.1564-1570.
Tumanggor, M., 2020. The Influence of Current Ratio, Quick Ratio and Net Profit Margin on Return on Assets at PT. Hero Supermarket Tbk. PINISI Discretion Review, 1(1), pp.137-146.
Utami, W.B., 2017. Analysis of Current Ratio Changes Effect, Asset Ratio Debt, Total Asset Turnover, Return On Asset, And Price Earning Ratio In Predictinggrowth Income By Considering Corporate Size In The Company Joined In Lq45 Index Year 2013-2016. International Journal of Economics, Business and Accounting Research (IJEBAR), 1(01).
Yanto, E., Christy, I. and Cakranegara, P.A., 2021. The influences of return on asset, return on equity, net profit margin, debt-equity ratio and current ratio toward stock price. International Journal of Science, Technology & Management, 2(1), pp.300-312.
Websites
Morrisons-corporate.com , 2021, annual report available at:https://www.morrisons-corporate.com/Morrisons-plc/annual-report/ [acessed on 3 November 2022]
Sainsburys.co, 2022, Annual report of Sainsbury plc, Available at: https://www.about.sainsburys.co.uk/investors/results-reports-and-presentations/2021 [Accesssed on 04 November 2022]
Statista.com, 2022, Market share of different company, Available at: https://www.statista.com/statistics/280208/grocery-market-share-in-the-united-kingdom-uk/ [Accessed on: 04 November 2022]
Know more about UniqueSubmission’s other writing services:

