BE274 Managerial Economics Sample
1.0 Introduction
The project is based on managerial economics which means the demand and supply curve which has been affected on the basis of the provided here. The Pizza Company runs its business by selling different kinds of pizza but it has been facing some kind of loss in the business. The company decided to make its business a franchise mode to gain better profits in the future by implementing a new idea of a ‘$1 double supreme cheese pizza. The Association of Franchises thinks that this mode is alleging a lawsuit against the business for the promotion of pizza with a loss of 10 cents.
2.0 Discussion
Part 1.
The demand for the quantity can be done on the basis of the equation where the demand is a negative slope.
(a)
D= C+I+G+(X-I)
Y=ax+b
b= q/p= Q2-Q1/P2-P1
b=22-28/9-6
=6/3=(-2)
q= a-2(b) (Q is 16 here)
=16=a-24
=40=a
Qb=a-2(b)
=10=a-15(-2)
=10=a+30
=-20=a
Qc=a-2(18)
4=a-36
40=a
The equation for supply is Qs = x + YP
The total equation for demand and supply is y=mx+b
The supply curve is a positive slope
Qs=c+Dp
Q=q/p= Q2-Q1/P2-P1
b=4-2/6-3
b=-2/-3
b=1.5
Qb= a-1.5(b)
6=a-1.5(9)
6=a-13.5
=a=19.5
Qc= a-1.5(12)
8=a-18
=a=26
Qd= a-1.5(15)
10=a-22.5
a=32.5
Qe=a-1.5(18)
12=a-27
a=39
(b) At a price of $9 the price of elasticity of demand is
b= q/p= Q2-Q1/P2-P1
b=22-28/9-6
=6/3=(-2)
The price which has given is $12 and the elasticity of the demand is
q= a-2(b) (Q is 16 here)
=16=a-24
=40=a
(c) Both of the prices are elastic as it greater than the value of -2 in$9 it in$12 it is 40.
Part 2
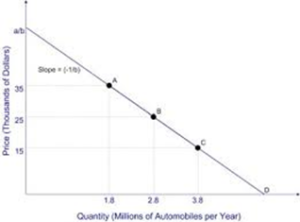
- The price and demand curve is provided here with the values on the market structure that can be elaborate by doing a lot of graph structure that is an efficient and effective way to denote the demand curves. The demand curve is negative and the sloping of the D curve is also downward here it has to be shown with the prospectus of the positive effects (Aregay 2022). The graph is denoted here on the basis of thousand dollars in the price axis and quantity of the axis of millions of automobiles the slope here shows the downfall in the automobile and it is getting down from the a/b slope to D and it has been increasing the data per year from 1.8 million to 3.8 per year with the earning from the 15 thousand dollars to the exceeding limits of the 35 thousand dollars per years and it has been effecting in the growth rate of the entity and with better economical values of the demand(Armstrong, et al 2019). The graph is showing that the demand for automobiles is increasing every year and also its profits are increasing rate on an economic factor which will be beneficial for the demand and getting the profits for the economic health and has been showing the ability to increase the demand curve and will provide the better prospect of the segments that are related to the production of the business requirements in the demand curve.

Figure 1: Demand curve
(Source:https://www.toppr.com/guides/business-economics-c)
(b)
( Qg = 500 -5P
p=500/5=100
=Qg =100
Qs = 200 – 4P
p=200/4=50
Qs=50
(c)The profit of maximization of the revenues depends on it which can be based on Total revenue- Total cost. The profit in the revenues is also based on the calculation of MR=MC which can vary on marginal rate and marginal cost here the second order depends on the first order if the maximization of $35 will be a profitable approach as it has shown in the other side.
(d) For the maximization of the revenue to get the positive values that it has to cross the amount of 100 and should not be least than 50$ otherwise it will not be able to generate the monetary value for the economic growth it has been seen here.
(e)Sellers want to increase the values and it will be based on a curve of positive aspects that will enhance him to manage and also to get a better overview of the growth of profit rather than the revenues.
Profit maximization and revenue maximization are similar in the process of financial both of them work in different aspects.
Part 3
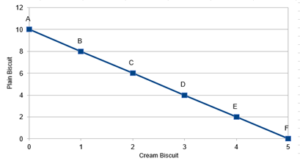
(a) The consumer budget line can be represented on the aspects of the can be denoted as in the graph of demand and supply curve that has taken on the basis of plain biscuit and cream biscuit (Averchenkova, 2020). The curve is upward sloping and it is joining the line of the positive prospect of business which will later be seen as the modification is needed in some segments. The curve is a straight line and it is showing the utility when it goes to the 12 number from A to F it has been shown here that the ability to get better benefits is only the plain biscuits as the cream is generally popular and has been showing positive effects in the age from 0 to 10 as in the plain biscuit is has shown that it has crossed its limits for the consumption composition which can be assumed that the demand of plain one is higher than the cream one as it is better and also beneficial for the consumers which relate with the quantity of the biscuits as it has cream it has to take more materials for the production of a cream biscuit but in the plain biscuit has the better quality and quantity for it has no use in the same materials that can be used the process of making plain biscuits (Bloom, et al 2020). So the demand for plain biscuits is much higher than the crème so it is better for taking the demand for plain biscuits over the consumption of cream biscuits and the supply is also better as plain biscuits have less cost with also few materials but the quality of both commodities are better and relevant for the production and also consumers can sale it as for the budget it has been a beneficial aspect for the business provisional to act on the basis of this budget line of the commodities.

Figure 2: Consumer budget line
(Source:https://byjus.com/commerce/budget-line)
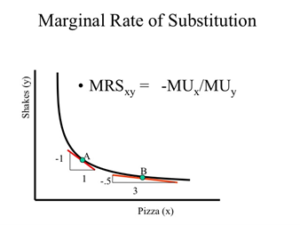
(b) The prospects here be based on the IC curve and it has to get the simple aspect in the amount that can be related to the IC curve where it has been loaded with the view with the Good A and Good B that can rely on the axis of y and also it has the x-axis that can be seen here with a denoting perspective on the organizing contradiction. The IC curve is showing the view with the major valuation of the overview suspects that from the Y axis it is getting down or it falls from A to E with the next segment and will also demonstrate that the Y slope has been falling down towards the IC of E and it is backward sloping (CATHERINE 2021). The graph is based on it and it has to be done in the aspect of good commodities which have been shown a positive impact in growth and will also be liable and efficient to meet better needs to regenerate the positive satisfaction of the marginal rate of substitution.

Figure 3: IC curve
(Source: https://www.managementnote.com/)
(c) The quantity which can be valued on the basis of the consumer marginal rate of substitution where it has been shown the rate on the aspect of the substantiation will be varied on the aspect of the consumers that will be co-related with the products that can increase by the demand and also takes on the total utility which will also not be preferred to organize the structure of the economic. The marginal rate of substitution has shown here the as we take the date of fast food items such as pizza and shakes that are sold there and the marginal profits should be calculated by it where the marginal rate is denoted by the MRSxy =-MU marginal utility of x commodity /MUy marginal utility of y commodity which can be shown as in the curve of demand and supply which has been shifted to leftward and in positive slope which shows the percentage of pizza is (5) to 3 as it has grown its sales and also shakes of y commodity has shown the aspect of (1) to 1 which is positive and will later reorganized the economic factor of the regional aspects.

Figure 4. Marginal Utility of consumer
(Source:https://www.toppr.com/guides/business-economics-cs)
Part 4
The Entity has decided to franchise the way of its business to get maximization of consumers and orders along with getting profits. The company has franchised the business in a promotional way where the pizza will be available at a low rate with a better version with just an affordable value of $1 per supreme pizza. The franchise of the association found it alleged for the business aspects and for that they filed a lawsuit against the company as it an inhalation for the rules of the authority. The reason for the lawsuit was the promotion process of the company and the price costing on a supreme pizza with double cheese at just a dollar where the real cost and value of the item is $1.10 and by implementing this mode there will be a loss in $ 0.1 or 10 cents which have the costing value of materials that are for making the pizza such as the base of the pizza, meat for it with toppings and cheese and the leftover profits are the expenses which are added for the requirements of that item.
Here, the perspective of this franchise mode is just focused on generating the number of orders and gathering that will be beneficial for the company to meet its desired needs. The company has also justified its view on the execution of this plan will increase the number of visitors by 20% from the earlier rate of consumers. As it is a double cheese supreme pizza and also a little cheaper than the other outlets it is expected by the owner of the company that this mode of the franchise will be beneficial for the growth of the entity. This idea of business is not as much better as it has been expected because the analysts of the industry have shown results which have happened due to traffic issues half of the orders that were increased would be in loss because the consumers are spending less when they order the food items.
The company should take a look or consider the idea of implementing this mode of franchising on the supreme pizza (Firouzabadi, et al 2019). As it is correlated with expenses of the materials required for the items in pizza making and also with the royalties, wages, and rent of the working staff which is included in the rest amount of 55 cents and also pays about 4.5% in royalties from the total revenues generated by the restaurant so, before considering this idea it should be the focus on the other expenses which are essential for the profits.
The relevant cost should be based on the exception of the organization which can be based on the structure of the costs of the pizza which will also be applicable to the benefits. The company should focus on royalties and managerial expenses that are related to the total earnings of the restaurants and will later increase consumer benefits and generate profits. The relevant cost which has been given here is for one supreme pizza as the company has to be more competitive and also it has to be more efficient as it has been selling the pizza in this type of economic environment where every company is there to down the sales of the other companies. The restaurant is slashing the menu prices due to the factor of poor economic conditions and the executive of this company is expecting that discounted deals will increase the value and also increase the dinners that are based on the economic factor who spend less when they go out for eating something it will be a better deal to grab the attention of the consumers.
The aim of the pizza company is to grab a higher number of consumers to meet the needs it has implemented this reduction idea in the business which will grab more attention. The company should be more effective in thinking about the execution of the plan which will make it more attractive to divert the audiences to them from the other competitors (Kishchak, 2022). The franchise association and the company both have the same approach to the generation of profits but the process is different where the association is not supporting the idea to reduce the price of the supreme pizza with the additional toppings and cheese because it is expensive and the prices of materials also cost higher and the incentives are also not going to meet the profits needs.
The reduction in the price of the food item which is about 10 cents loss will not be an effective approach for the business its expectations are also not that much improvising the benefits and the incentives should face some type of error between them (Malesios et al 2018). The association is not going to accept the decision of that company because it will change the structure of the price value of pizza in the market as the markets have almost the same price for the food item but some reduction will attract their consumers to that regarding entity so it is not a great approach,
The problem can only be resolved when both the association will be ready to negotiate in terms of profits for their business.
3.0 Conclusion
The company has to focus on the profits and it also has to act with the association and also not be like a single profit entity. All the requirements here are met so, it is concluded successfully.
Reference List
Journals
Aregay, A.Z., 2022. Managerial Economics.
Armstrong, C.S., Glaeser, S., Huang, S. and Taylor, D.J., 2019. The economics of managerial taxes and corporate risk-taking. The Accounting Review, 94(1), pp.1-24.
Averchenkova, E.E. and Averchenkov, A.V., 2020, May. Procedure for Adopting Regional Managerial Decisions on the Basis of Applying DSS “DATA”. In 2nd International Scientific and Practical Conference “Modern Management Trends and the Digital Economy: from Regional Development to Global Economic Growth”(MTDE 2020) (pp. 538-545). Atlantis Press.
Bloom, N., Lemos, R., Sadun, R. and Van Reenen, J., 2020. Healthy business? managerial education and management in health care. Review of Economics and Statistics, 102(3), pp.506-517.
CATHERINE, O.A. and ENG, I.P.F.O., 2021. ENGINEERING LAW AND MANAGERIAL ECONOMICS FOR STRATEGIC MANAGEMENT OF CHEMICAL ENGINEERING WORK: ISSUES AND A WAY FORWARD.
Firouzabadi, S.M.A.K., Ghahremanloo, M., Keshavarz-Ghorabaee, M. and Saparauskas, J., 2019. A new group decision-making model based on bwm and its application to managerial problems. Transformations in Business & Economics, 18(2), p.47.
Huang, Q., Xiong, M. and Xiao, M., 2022. Does managerial ability affect corporate financial constraints? Evidence from China. Economic Research-Ekonomska Istraživanja, 35(1), pp.3731-3753.
Kishchak, N.G., 2022. Determining economic and managerial characteristics operational activity of the developer as an administrator of construction projects. Nauka i studia, (6).
MAHMOOD, F.A.B., VMBE2014 MANAGERIAL ECONOMICS SAPURA INDUSTRIAL BERHAD.
Malesios, C., Skouloudis, A., Dey, P.K., Abdelaziz, F.B., Kantartzis, A. and Evangelinos, K., 2018. Impact of small‐and medium‐sized enterprises sustainability practices and performance on economic growth from a managerial perspective: Modeling considerations and empirical analysis results. Business strategy and the environment, 27(7), pp.960-972.
Mustafa, S.L., 2019. Role of managerial staff in success of the enterprise and importance of small and medium enterprises-SME in economic development. The Romanian Economic Journal, pp.29-41.
Sahuraja, R., 2019. Managerial Economics.
Samuelson, W.F., Marks, S.G. and Zagorsky, J.L., 2021. Managerial economics. John Wiley & Sons.
Sebayang, T., Darus, M., Shankar, K. and Lydia, E.L., 2020. Fundamental Concept of Managerial Economics: A Business Advancement of Today and Tomorrow Management.
Strong, V.C., 2018. A managerial analysis of historic economic bubbles as basis for identifying future similarly economic losses (Doctoral dissertation, North-West University).
Tebourbi, I., Ting, I.W.K., Le, H.T.M. and Kweh, Q.L., 2020. R&D investment and future firm performance: The role of managerial overconfidence and government ownership. Managerial and Decision Economics, 41(7), pp.1269-1281.
Tyukavkin, N.M., 2022. Methodological approaches to assessing the effectiveness of organizational and managerial innovations. Вестник Самарского университета. Экономика и управление, 13(3), pp.107-113.
Know more about UniqueSubmission’s other writing services:


Dear immortals, I need some wow gold inspiration to create.