
The effect of critical evaluation on perceived stress and workload in a multitasking paradigm
Abstract
The main aim of the current study was to explore the impact of critical conditions on the workload of a person. The relevance of the study is that, it uses a multitasking experiment that allows the person to work on four things simultaneously and find how well they respond to interruption and pressure and the critical condition.
The data collection was based on NASA TLX questionnaire whereby the participants had to fill post participation in the experiment. In addition, a MANOVA or multivariate analysis was done to check the impact of critical assessment on workload aspects.

There was normal distribution only for the physical value and the findings from tests of between-subjects effects test found that all the conditions of the multitasking experiment have insignificant values for mental, physical, temporal, perceived performance, perceived effort and frustration. Therefore, it was implicated that the hypothesis formed is rejected and critical evaluation would not lead to greater perceived workload.
1. Introduction
Background
According to theories, the workload capacity of people have variations and the level of impact on mental, physical, temporal, perceived performance, perceived effort and frustration also changes accordingly (Mehta & Agnew, 2015). Various studies have conducted psychometric studies on the workload based aspects that impact the perception or the condition of the person (Young, Zavelina, & Hooper, 2008).
Based on the studies it is implicative that people have different response to a workload pressure and some may have impact on physical being or may cause frustration or may even cause mental impact.
Therefore, it is imperative to understand the impact a person has on their psychological being based on a task they do. In this study the main purpose was to explore the observations from a multitasking task and the difference in reactions that each of the participants feels.
Rationale of the study
Workload is referred to the perceived pressure from a difficult or a complex task and where the environment is unsuitable in the completion of a task (Hobson & Beach, 2000). Every person perceives workload in a different aspects because the capacity of a person different from one to another. Workload appears to implicate the sensitiveness of a person and the level of intrusiveness a person has.
Therefore, one may use a multidimensional construct to understand the level of intrusiveness on the basis of the workload a person has from the task they do (Cao, Chintamani, Pandya, & Ellis, 2009).
Since, there is a variation of the perceived workload of a person on the basis the task the do; some may have greater impact on the mental demand while another may have to put greater effort in the completion and someone other has to put physical demand in the completion of the task.
The workload can therefore be directly linked to stress and psychological being of the person(Mehta & Agnew, 2015). In addition, it is also imperative to understand if multitasking has any relevance to workload perceptions. Therefore, the current study conducts a survey on the psychological perception of workload from a multitaskingexperimentthat allows the person to work on two things simultaneously and find how well they respond to interruption and pressure.
Research aim and questions
The main aim of the current study was to explore the impact of critical conditions on the workload aspects like mental, physical, temporal, performance, effort and frustration of a person. Based on this the main research question of the study is that; what is the impact of the critical conditions on the psychological ability for talking up a workload?
Literature review
According to a study by Mehta & Agnew, (2011), with increase pressure of work and the task criticalness there is an increased demand for the need of mental aspects so that the precision of completing the task is met.
In addition, it was also stated that with the increased need for mental demand in the completion of a task, there is an increased demand for physical demands like muscle tensions and activities and causes the continued and instance firing of the single motor units.
However, Hobson & Beach, (2000) also stressed that with increase mental demands, there is a positive damage on the concurrent processing and affects the ability of a person. It has also been found that with increased workload features leads to increased physical demands which are one of the major sources of work-related musculoskeletal disorders.
Physical demands get induced by the increasing biomechanical strains from the workload. However, Young, Zavelina, & Hooper, (2008) stressed upon the temporal aspects of workload, whereby,it is the perceived psychological aspect whereby a person perceived on the pressure of completion of task on the basis of time and duration to complete the same.
Similarly, Fan & Smith, (2017) presented the perceived impact of the level of efforts and the performance that the people can endure from workplace workload. It was implied that with increase in tougher conditions for conduction of a task the person has to apply efforts so that the objective is met and once the objective is met their performance is evaluated.
However, for long these aspects have been the base of many psychological studies like Rizzo et al., (2016), Mehta & Agnew, (2011) and Young et al., (2008) to explore the workload aspects from a stressful completion of task. A similar method has been applied in the current study.
2. Methods
Research design
A research design forms the basis of conduction of a research as the ideas that the researcher aims to induct or findings. A research can be qualitative or quantitative based on the perspectives of finding a new theory or hypothesising an existing theory (Thornhill, Saunders, & Lewis, 2009).
The current study is based on quantitative research framework that whereby numerical survey methods are applicable for the quantification and addressing the research aim of the study (Kothari, 2004).
This is mainly based on the aim of the study which has the scope to find the perceived workload of people from a critical task. Using a quantitative method, the participants targeted in the study perceived on the aspect of workload stress based aspects like mental, physical, temporal, perceived performance, perceived effort and frustration.
Since the aim was to see is there is a significant impact of the stress based conditions on the participant’s workload aspects, the quantitative assessment used a survey method to assess the same.
Sampling plan and sample size
The sampling plan presents the basis of which the target participants of the study are chosen. There are basically two sampling methods; the probability and the non-probability type. Since the participants of the study are mainly from the university and were chosen on the basis of convenience of the study, a non-probability sampling plan was used (Kothari, 2004).
The convenience is chosen on grounds when the participants are inducted due to their easy availability for the study. Based on this a convenience sampling plan was used whereby 40 participants from a group of students from Northumbria University of a specific class were included. The method by which the participants were inducted in the study was based on Latin square method whereby the participants were automatically categorised into control and critical group, both falling under the experimental group(Edwards, 1951).
The Latin square uses a randomisation method that allows the sample participants to be chosen into two groups and each of the participants has the equal chance to become either control or critical group (Kim & Stein, 2009). Further, the sample participants were inductedfor a multitasking experiment, only after they sign the consent form.
The multitasking experimentwas done on a computer whereby the participants had to click and conduct four tasks; the rising bar, the highest number tap, the email sound, and the telephone number. During the experiment, the participants were instructed to complete the multitasking experiment, try for the best possible score, and complete the questionnaire after the experiment.
During the multitasking the evaluators put pressure on the participants. The pressure was based on “You are not working fast enough”, “You are missing responses” and “You should have a higher score at this point in the session.”
These were the basis of the critical evaluation by creating a sense of pressure and stress on the multitasking that led the person to later perceive as to how they performed and the level of demand they had during the task.
Data collection methods
Data collection is the method by which the responses from a survey are collected and the instruments used. Since, the study is a quantitative one in the area of psychology, the instrument used in the study was a questionnaire.
The method of data collection comprised of NASA TLX scale based questionnaire that comprised of demographic information as well as workload perceptions. The questionnaire was administered only after the completion of the multitasking experiment and they had to provide response on the level of pressure and effort induced during the multitasking.
The NASA TLX scale was mainly used in this study as the questionnaire, whereby, the participants were asked about their demographic aspects and the six main attributes of workload; mental, physical, temporal, performance, effort and frustration (Cao et al., 2009). There were also the dependent variables of the study and once these variables were recorded they were posted to Qualtrics.
Data analysis methods
The current study was based on two main types of analyses; the descriptive and the inferential. The descriptive mainly comprised of frequency distribution and the inferential analysis comprised of MANOVA test. In addition, to find the reliability of the responses of the dependent variables, normality test was conducted.
The data analysis methods were based on MANOVA or multivariate analysis to check the impact of critical assessment on workload aspects like mental, physical, temporal, perceived performance, perceived effort and frustration.
Therefore, the independent variable in this regard was the condition of the experimental group and the dependent variables were mental, physical, temporal, perceived performance, perceived effort and frustration. MANOVA was conducted so that the impact of the predictor on the control values of critical evaluation (Finch & French, 2013).
Apart from MANOVA, normality test was also done or a multivariate normality test which helped to explore if the responses or the data have a normal distribution for the reliability of the study (Székely& Rizzo, 2005).The descriptive analysis however comprised of frequency distribution whereby the findings were presented in the form of mean values and graphical representations.
Ethical considerations
The entire experimental group were instructed and informed about the need for the study and how the experiment will be conducted. In addition, all the students were above 18years and therefor the study was a low risk to any actual stress of participating in the study. In addition, no manipulation of the data gathered was done and no personal information of the participants was presented in the study.
In addition to MANOVA, normality test was also done to check the unified distribution of the responses. In addition, a consent form was also prepared and signed by the participants to ensure volunteered participation in the study (Wester, 2011).This was the foremost induction in the experiment whereby the students had to first reach the cubicle and sign the consent form.
3. Results
Normality test
Normality test is conducted to find the normal distribution of the categorical responses from a survey or database. There are two methods to check the normality of a data; either by Shapiro-Wilk Test or by Kolmogorov-Smirnov Tes, however, Shapiro-Wilk Test is the most suitable in cases with low sample size usually less than 50.
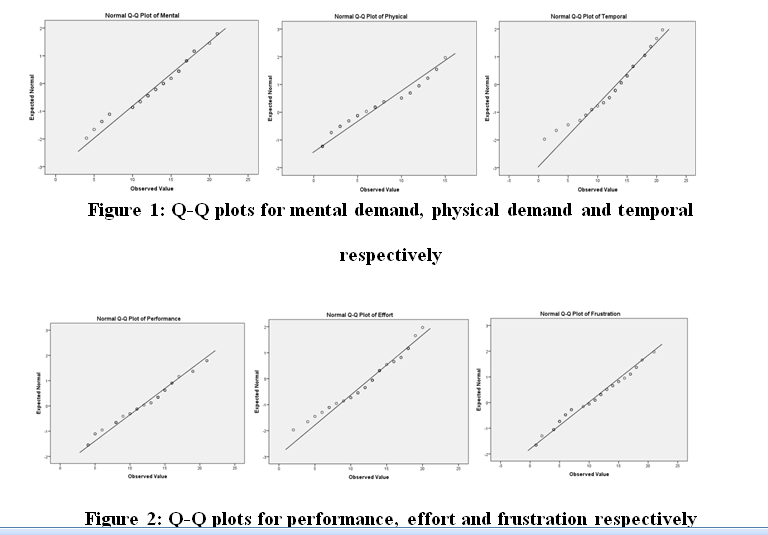
Based on the normality test for all the variables in the study it was found that the significance value for Shapiro-Wilk test only for physical was found to be significant at .004 and 95% CI. According to the Shapiro-Wilk Test when the p value for one of the variables are significant or p less than 0.05 it means it does not have a normal distribution. Therefore, the insignificant variable for physical indicates that there is no normal distribution amongst the responses for physical demand.
All other variables like mental, temporal, perceived performance, perceived effort and frustration does not have a significant value, which also means that there is a high chance that the hypothesis of the study will be rejected. Since the variables like mental, temporal, perceived performance, perceived effort and frustration does not have a significant value, it means the data of these variables have a normal distribution. The table for the same is presented in Appendix I.The Q-Q plots for the same have been presented in the following images.
Descriptive analysis
In this section, three main attributes were covered; the age of the participants, condition, and gender. Based on the fig 3 it was found that 52% of the experimental group were included in the critical group whereas 48% of then included in the control group.
This means, on the basis of the Latin square method randomisation more critical people were included who participated the multitasking experiment, whereas, the control group were already estimated to have an impact on the workload aspects from the condition. On the other hand, it was also found that more female participants were inducted in the study (83%) and only 17% were male participants.
This means more female participants were interested in participating to find their workload perceptions or had a better understanding of the study.
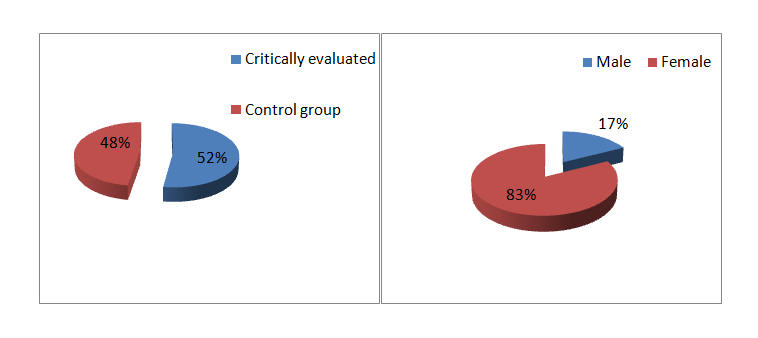
Figure 3: Frequency distribution of condition and gender
In table 1, the age based distribution of the participants have been presented, whereby it can be seen that majority of the participants are of the age 20-29 years (n=30), 30 to 39 years (n=7) and 40 or more with 3 participants. This implicates that more young students from male and female groups participated the study.
In addition the study also found a mean value of 27.23 and a standard deviation of 7.76 indicating that all the participant age varies or has a variance of 7.76 from the man value. On visualising individually, it was found that 7 of the participants had age of 22 and 6 with 25. This also implicates that majority of the participants from either from the final years of the university or second year.
Table 1: Age distribution of the participants
| Frequency | Percent | Valid Percent | Cumulative Percent | ||
| Categories of Age | 20 | 1 | 2.5 | 2.5 | 2.5 |
| 21 | 5 | 12.5 | 12.5 | 15.0 | |
| 22 | 7 | 17.5 | 17.5 | 32.5 | |
| 23 | 1 | 2.5 | 2.5 | 35.0 | |
| 24 | 5 | 12.5 | 12.5 | 47.5 | |
| 25 | 6 | 15.0 | 15.0 | 62.5 | |
| 26 | 3 | 7.5 | 7.5 | 70.0 | |
| 28 | 2 | 5.0 | 5.0 | 75.0 | |
| 30 | 2 | 5.0 | 5.0 | 80.0 | |
| 32 | 1 | 2.5 | 2.5 | 82.5 | |
| 35 | 2 | 5.0 | 5.0 | 87.5 | |
| 36 | 1 | 2.5 | 2.5 | 90.0 | |
| 37 | 1 | 2.5 | 2.5 | 92.5 | |
| 47 | 1 | 2.5 | 2.5 | 95.0 | |
| 49 | 1 | 2.5 | 2.5 | 97.5 | |
| 52 | 1 | 2.5 | 2.5 | 100.0 | |
| Total | 40 | 100.0 | 100.0 | ||
Multivariate/MANOVA
The hypothesis has been tested in this segment and the hypothesis is;
HA1: Critical evaluation would lead to greater perceived workload.
In this section, MANOVA or multivariate test was conducted whereby the independent variable is the condition of the experimental group and the dependent variables are mental, physical, temporal, perceived performance, perceived effort and frustration. In a multivariate test, the model comprises of multiple dependent variables and one or many independent variables run together.
Further, the Tukey post-hoc tests were considered for the study whereby Wilks’ Lambda and tests of between-subjects effects were found (Grice & Iwasaki, 2007).Based on the findings of the Box’s Test of Equality it can be implicated that the coefficient value of 39.263 shows the moderate level of variance of the dependent variables in the study.
In addition the p value being .052 or being insignificant at 95% CI implicates that the covariance matrices are equal. Again, the findings from the multivariate tests found that the Wilks’ Lambda for p value was insignificant at .629 when 95% CI. This also means that critical evaluation would not lead to greater perceived workload as the p value is less than 0.05.
On the other hand, the findings from tests of between-subjects effects test found that all the conditions of the multitasking experiment have insignificant values for mental, physical, temporal, perceived performance, perceived effort and frustration at p<0.05 (95% CI). Therefore, the hypothesis formed is rejected and it can be implicated that critical evaluation would not lead to greater perceived workload. The findings from the MANOVA test have been presented in appendix II.
4. Discussions
The main aim of the current study was to find if there is an impact of the critical conditions on the workload aspects of a person. Various studies have conducted psychometric studies on the workload based aspects that impact the perception or the condition of the person.
In this regard, a quantitative research framework was used for the study whereby 40 participants from a group of students of a specific class were included. In addition, a Latin square was used to measure the value of workload capacity of the control and the critical respondents.
The study used a multitasking experiment whereby on one hand they had to multitask on a computer and fill in the questionnaire formed simultaneously. There was normal distribution only for the physical value and the findings from tests of between-subjects effects test found that all the conditions of the multitasking experiment have insignificant values for mental, physical, temporal, perceived performance, perceived effort and frustration.
Therefore, it was implicated that the hypothesis formed is rejected and critical evaluation would not lead to greater perceived workload.
However, there are certain limitations of the current study; first being the low participation size for the study. The sample size of the study is very low and it is recommended that in future similar studies the sample size to be greater than 100. Another limitation of the study is that the study uses different students in the multitasking experiment like students from post-graduation, graduation and even PhDs, so the level of workload was found to be not significant.
Therefore, in future studies the research may use a randomised sampling method to choose only one group of students or students from one department of study. Another limitation of the study was that, the study uses only the NATA TLX questionnaire and the entire workload is based on only six aspects. There are multiple types of psychological survey methods, which can be used in future studies.
References
Cao, A., Chintamani, K. K., Pandya, A. K., & Ellis, R. D. (2009). NASA TLX: Software for assessing subjective mental workload. Behavior research methods, 41(1), 113-117.
Edwards, A. L. (1951). Balanced latin-square designs in psychological research.The American Journal of Psychology, 64(4), 598-603.
Fan, J., & Smith, A. P. (2017, June).The impact of workload and fatigue on performance. In International symposium on human mental workload: Models and applications (pp. 90-105). Springer, Cham.
Finch, H., & French, B. (2013).A Monte Carlo comparison of robust MANOVA test statistics. Journal of Modern Applied Statistical Methods, 12(2), 4.
Grice, J. W., & Iwasaki, M. (2007).A truly multivariate approach to MANOVA. Applied Multivariate Research, 12(3), 199-226.
Hobson, J., & Beach, J. R. (2000).An investigation of the relationship between psychological health and workload among managers. Occupational Medicine, 50(7), 518-522.
Kim, B. G., & Stein, H. H. (2009). A spreadsheet program for making a balanced Latin square design. RevistaColombiana de CienciasPecuarias, 22(4), 591-596.
Kothari, C. R. (2004). Research methodology: Methods and techniques. New Age International.
Mehta, R. K., & Agnew, M. J. (2011).Effects of concurrent physical and mental demands for a short duration static task. International Journal of Industrial Ergonomics, 41(5), 488-493.
Mehta, R. K., & Agnew, M. J. (2015).Subjective evaluation of physical and mental workload interactions across different muscle groups.Journal of occupational and environmental hygiene, 12(1), 62-68.
Rizzo, L., Dondio, P., Delany, S. J., & Longo, L. (2016, September).Modeling mental workload via rule-based expert system: a comparison with NASA-TLX and workload profile.In IFIP International Conference on Artificial Intelligence Applications and Innovations (pp. 215-229).Springer, Cham.
Thornhill, A., Saunders, M., & Lewis, P. (2009). Research methods for business students. Prentice Hall: London.
Székely, G. J., & Rizzo, M. L. (2005).A new test for multivariate normality. Journal of Multivariate Analysis, 93(1), 58-80.
Young, G., Zavelina, L., & Hooper, V. (2008).Assessment of workload using NASA Task Load Index in perianesthesia nursing.Journal of PeriAnesthesia Nursing, 23(2), 102-110.
Wester, K. L. (2011). Publishing ethical research: A step‐by‐step overview. Journal of Counseling& Development, 89(3), 301-307.
Appendix I
Table 2: Normality test
| Tests of Normality | ||||||
| Kolmogorov-Smirnova | Shapiro-Wilk | |||||
| Statistic | df | Sig. | Statistic | df | Sig. | |
| Mental | .119 | 40 | .161 | .960 | 40 | .167 |
| Physical | .130 | 40 | .088 | .909 | 40 | .004 |
| Temporal | .132 | 40 | .076 | .957 | 40 | .132 |
| Performance | .111 | 40 | .200* | .960 | 40 | .161 |
| Effort | .125 | 40 | .114 | .960 | 40 | .167 |
| Frustration | .126 | 40 | .107 | .963 | 40 | .209 |
| *. This is a lower bound of the true significance. | ||||||
| a. Lilliefors Significance Correction | ||||||
Appendix II
Table 3: Box’s Test of Equality of Covariance Matrices
| Box’s Test of Equality of Covariance Matricesa | |
| Box’s M | 39.263 |
| F | 1.548 |
| df1 | 21 |
| df2 | 5190.383 |
| Sig. | .052 |
| Tests the null hypothesis that the observed covariance matrices of the dependent variables are equal across groups. | |
| a. Design: Intercept + Condition | |
Table 4: Multivariate Tests
| Multivariate Testsa | |||||||
| Effect | Value | F | Hypothesis df | Error df | Sig. | Partial Eta Squared | |
| Intercept | Pillai’s Trace | .950 | 105.471b | 6.000 | 33.000 | .000 | .950 |
| Wilks’ Lambda | .050 | 105.471b | 6.000 | 33.000 | .000 | .950 | |
| Hotelling’s Trace | 19.177 | 105.471b | 6.000 | 33.000 | .000 | .950 | |
| Roy’s Largest Root | 19.177 | 105.471b | 6.000 | 33.000 | .000 | .950 | |
| Condition | Pillai’s Trace | .117 | .729b | 6.000 | 33.000 | .629 | .117 |
| Wilks’ Lambda | .883 | .729b | 6.000 | 33.000 | .629 | .117 | |
| Hotelling’s Trace | .133 | .729b | 6.000 | 33.000 | .629 | .117 | |
| Roy’s Largest Root | .133 | .729b | 6.000 | 33.000 | .629 | .117 | |
| a. Design: Intercept + Condition | |||||||
| b. Exact statistic | |||||||
Table 5: Tests of Between-Subjects Effects
| Tests of Between-Subjects Effects | |||||||
| Source | Dependent Variable | Type III Sum of Squares | df | Mean Square | F | Sig. | Partial Eta Squared |
| Corrected Model | Mental | .226a | 1 | .226 | .012 | .914 | .000 |
| Physical | 7.243b | 1 | 7.243 | .345 | .560 | .009 | |
| Temporal | 3.372c | 1 | 3.372 | .165 | .687 | .004 | |
| Performance | .068d | 1 | .068 | .003 | .957 | .000 | |
| Effort | 5.233e | 1 | 5.233 | .275 | .603 | .007 | |
| Frustration | 32.843f | 1 | 32.843 | 1.094 | .302 | .028 | |
| Intercept | Mental | 7275.826 | 1 | 7275.826 | 380.947 | .000 | .909 |
| Physical | 1674.743 | 1 | 1674.743 | 79.874 | .000 | .678 | |
| Temporal | 6936.872 | 1 | 6936.872 | 340.118 | .000 | .900 | |
| Performance | 5436.668 | 1 | 5436.668 | 229.368 | .000 | .858 | |
| Effort | 6479.233 | 1 | 6479.233 | 340.662 | .000 | .900 | |
| Frustration | 3874.843 | 1 | 3874.843 | 129.076 | .000 | .773 | |
| Condition | Mental | .226 | 1 | .226 | .012 | .914 | .000 |
| Physical | 7.243 | 1 | 7.243 | .345 | .560 | .009 | |
| Temporal | 3.372 | 1 | 3.372 | .165 | .687 | .004 | |
| Performance | .068 | 1 | .068 | .003 | .957 | .000 | |
| Effort | 5.233 | 1 | 5.233 | .275 | .603 | .007 | |
| Frustration | 32.843 | 1 | 32.843 | 1.094 | .302 | .028 | |
| Error | Mental | 725.774 | 38 | 19.099 | |||
| Physical | 796.757 | 38 | 20.967 | ||||
| Temporal | 775.028 | 38 | 20.395 | ||||
| Performance | 900.707 | 38 | 23.703 | ||||
| Effort | 722.742 | 38 | 19.020 | ||||
| Frustration | 1140.757 | 38 | 30.020 | ||||
| Total | Mental | 8016.000 | 40 | ||||
| Physical | 2494.000 | 40 | |||||
| Temporal | 7748.000 | 40 | |||||
| Performance | 6353.000 | 40 | |||||
| Effort | 7205.000 | 40 | |||||
| Frustration | 5094.000 | 40 | |||||
| Corrected Total | Mental | 726.000 | 39 | ||||
| Physical | 804.000 | 39 | |||||
| Temporal | 778.400 | 39 | |||||
| Performance | 900.775 | 39 | |||||
| Effort | 727.975 | 39 | |||||
| Frustration | 1173.600 | 39 | |||||
| a. R Squared = .000 (Adjusted R Squared = -.026) | |||||||
| b. R Squared = .009 (Adjusted R Squared = -.017) | |||||||
| c. R Squared = .004 (Adjusted R Squared = -.022) | |||||||
| d. R Squared = .000 (Adjusted R Squared = -.026) | |||||||
| e. R Squared = .007 (Adjusted R Squared = -.019) | |||||||
| f. R Squared = .028 (Adjusted R Squared = .002) | |||||||
