BE167-7-AU Accounting and Finance for Managers Assignment Sample
Module code and Title: BE167-7-AU Accounting and Finance for Managers Assignment Sample
A) Introduction and background of the business
Introduction
Accounting and finance are the key aspects of any business. This helps the business to evaluate its internal and external effects and make decisions for the future. In this research a company was chosen that is “Morgan Sindall”. There are various analyses that are generally done by management to know the insight of the business. Then various ratios under the heading “profitability, efficiency and also investment” are calculated, and then they have analyzed lastly the limitation of the ratios has been discussed.
Background
The company “Morgan Sindall” is one of the leading groups. The company is a construction company and situated in London. The company was founded in 19787 by “John Morgan and Jack Lovell”. The company was listed in LSE in 1994 (Morgansindall.com, 2022).
The company has six divisions that are: Infrastructure and Construction, Property Services, Fit Out, Urban Regeneration, Partnership Housing, and Investments (Morgansindall.com, 2022).
SWOT analysis
| Particular | description |
| Strength(S) | ● The company has a highly skilled workforce that helps the company to complete the projects on time.
● The company has various divisions of work so if one part is not working then the company would recover from another part ● The company’s financial statement is very strong being in the construction industry. ● The company has high experience people at its top management so they choose the right project ● The company enjoys good goodwill by giving a quality product and also on time.
|
| Weakness(W) | ● Morgan Sindall, one of the leading companies in the construction industry, still faces problems in delivering products that are not directly related to their segment.
● The company’s profitability ratio is positive yet it is below the average rate of the industry. ● The current organizational structure is very limited to the current business model so if the company expands its business in another province then it will face issues. ● With the new companies entering the market the company is not able to tackle the competition and it is struggling. |
| Opportunity (O) | ● As the population is rising throughout the globe, the company can take advantage and expand its business in new locations.
● With The new technology that has been discovered in the era of globalisation, the company can take advantage of this technology. The company can make investments in these technologies and can increase its operating profit. ● With the rise in the use of the internet, the company can advertise their projects so that the company can build brand value and can bag more projects. |
| Treat(T) | ● The company has to compile all the laws and regulations that the government is imposing on construction. Failing to compile one of the laws and regulations would make the project fail.
● There is also a serious threat of natural calamities where the company is working. ● The rise in the cost of the materials that the company is using will challenge the profitability of the company. |
Table 1: SWOT analysis (Source: self-made)
B) Analysis of the profitability ratio
The profitability ratio is one of the main ratios that help the company to analyze its current position in the business. It helps the management to know whether the company’s different operations are in profit or not. It all helps to identify the problems in the operation that are lowering the profitability of the company. There are various types of profitability ratios that can be found there are “gross margin, operating margin, return on assets, return on sales, return on equity and return on investment” and many other ratios (Kadim et al. 2020,p.5). These ratios are related to a different part of the income statement and balance sheets of the company.
 Figure 1: “Calculator of Profitability Ratio” (Source: self-developed)
For the given company three profitability ratios are calculated as follows.
Gross profit margin (GPM)
GPM is calculated with the help of Gross profit. In the calculation of the GPM, no operating and non-operating expenses are taken into consideration which means that the COGS is deducted from the revenue and the gross profit is calculated (Jihadi, et al. 2021,p.7). Then the Gross profit is divided by the revenue and thus GPM is calculated.
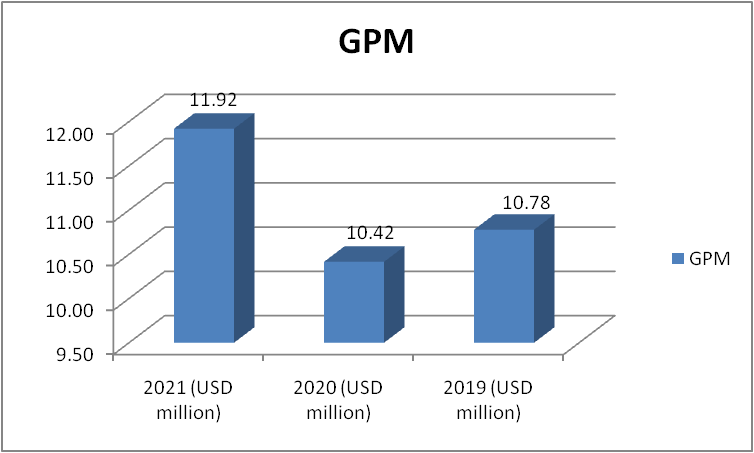 Figure 2: “GPM of Morgan Sindall” (Source: self-developed)
The company’s GPM of the company dropped in 2020 in comparison to 2019. This was due to the impact of the pandemic where the company did not make many sales. But in 2021 the company bounced back and its GPM increased to 11.92, though the current GPM is low. The company should try to increase this ratio drastically. [Refer to Appendix 1]
Operating profit margin (OPM)
OPM is calculated by reducing the operating expenses from the gross profit of the company and thus the operating profit is calculated. Then this operating profit is divided by the total revenue of the company (Amanda, 2019,p.4). The OPM helps to understand how much the operating expenses are affecting the profitability of the company.
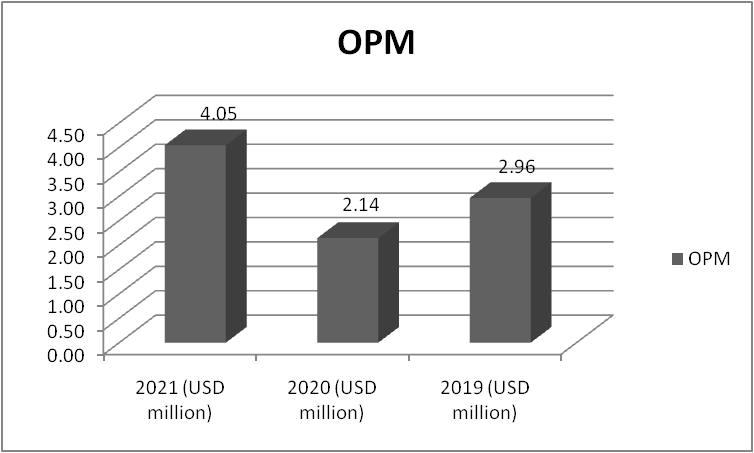 Figure 3: “OPM of Morgan Sindall” (Source: self-developed)
The OPM has the same nature just as the GPM which indicates that the operating expenses of the company are stagnant and are increased with COGS and vice versa. The company should try to decrease the COGS or find an alternative way of the products so that they can increase its GPM and this would ultimately increase its OPM.
Net profit Margin (NPM)
It is calculated by taking into consideration the net profit. It is the profit that ultimately the company earns by deducting all the expenses from the revenue (Sari, et al. 2022,p.5). NPM tells whether the company is ultimately in profit or not.
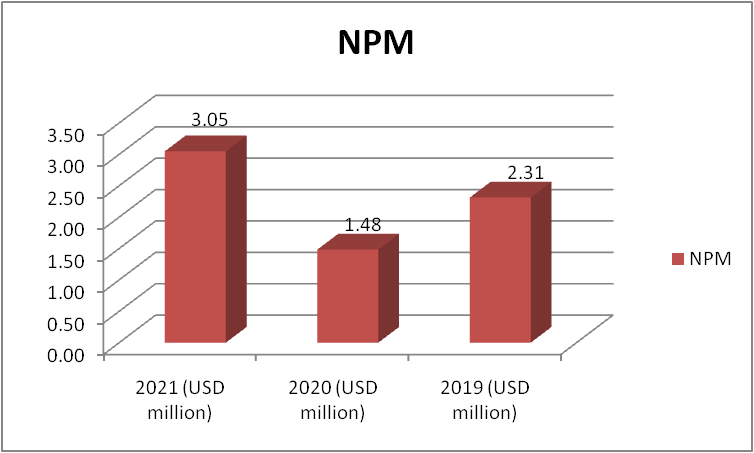 Figure 4: “NPM of Morgan Sindall” (Source: self-developed)
The company’s NPM is quite low if it is compared with the other companies in the industry. The company should overall try to increase its profitability ratio or if there is any negative effect from inter or external environment then the company would go into loss.
- C) Analysis of the Efficiency ratio
The efficiency ratio is also another important ratio. There are various ratios that have been calculated under this efficiency ratio as follows: “accounts receivable turnover, fixed asset turnover, sales to inventory, sales to net working capital, accounts payable to sales, and stock turnover ratio” (Markonah, et al. 2020p.3). With the calculation and analysis of these ratios, one can understand how the company is using its resources, assets, and liabilities to generate revenue of the company. These ratios help to know which part of the company is less efficient and what can be taken care of in the future.
 Figure 5: “Efficiency Ratios of Morgan Sindall” (Source: self-developed)
Three Efficiency ratios have been calculated for the given company that area s follows:
Account Receivable turnover ratio
This ratio is calculated by taking in the value of accounts receivable for the company and dividing it by the “cost of goods sold (COGS)”. This ratio tells that is how many days the money is been recovered by the company from its debtors that is the reason it is been multiplied by 365 days (Megaladevi, 2018,p.7). These are very important ratios because the sooner the money would be recovered the company can use it in other projects or operations of the company.
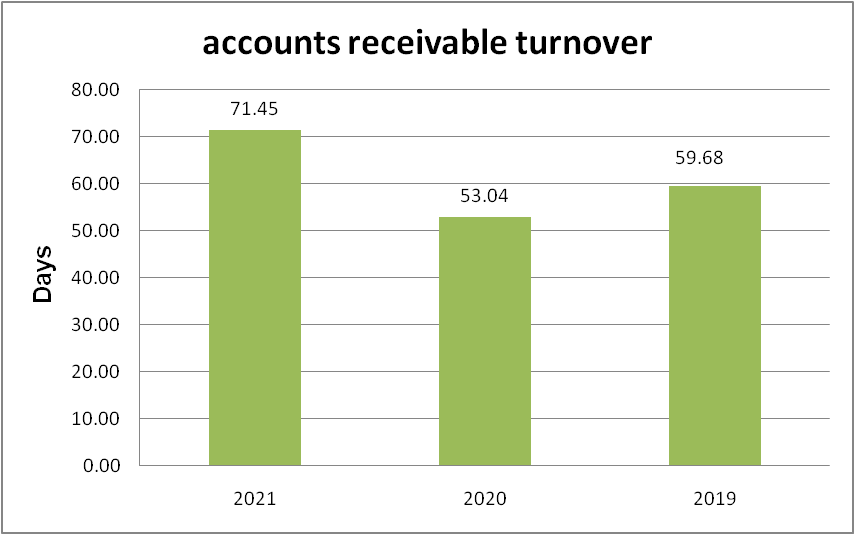 Figure 6: “Account Receivable turnover ratio of Morgan Sindall” (Source: self-developed)
It can be seen that the number of days in which the money has been recovered from the debtors has increased to approx 71 days in 2021, which was less than 2 months in the years 2019 and 2020. Though, in the construction business these 71 days of business is quite good. Because the average number of days in recovering the debtors is quite more in the industry in which the company operates. [Refer to Appendix 1]
Account Payable turnover ratio
This ratio is calculated by taking in the value of accounts payable by the company and dividing it by the “cost of goods sold (COGS)”. This ratio tells that is how many days the money is been given by the company to its creditors that is the reason it is been multiplied by 365 days (Madushanka, and Jathurika 2018, p.8). These are very important ratios, as because they help the company to circulate the money, and the later the money the company pays means it has time to circulate the money.
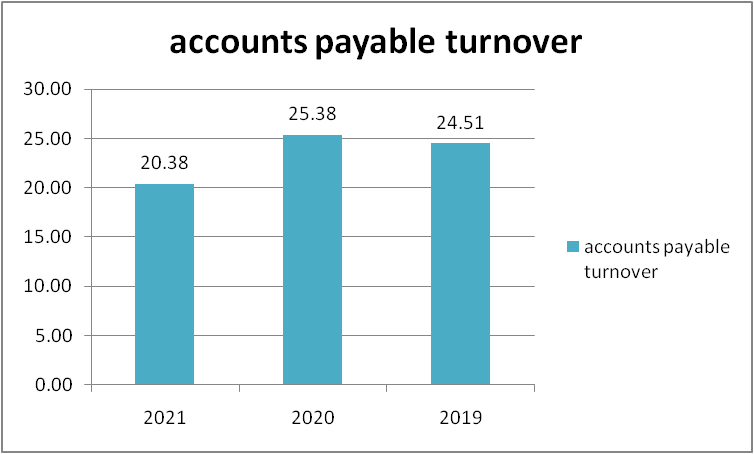 Figure 7: “Account Payable turnover ratio of Morgan Sindall” (Source: self-developed)
The number of days is been decreasing that show that the company has to pay money fast to their creditor when compared to the amount the company receives from the debtors. So the company has to work hard in order to manage the cash flow.
Asset turnover ratio
This ratio tells how well the company is able to use its assets in order to generate a good level of revenue. As suggested by Nguyen, and Nguyen (2020.,p.5) the higher the value the better the ratio.
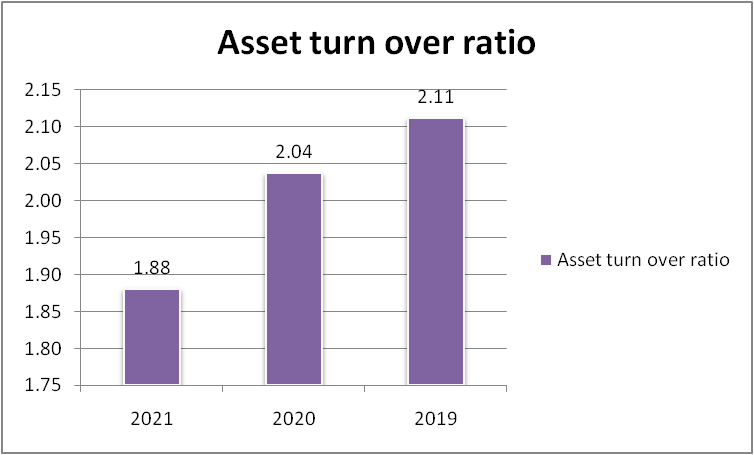 Figure 8: “Asset turnover ratio of Morgan Sindall” (Source: self-developed)
It can be seen in figure 7, that the company’s ratio is continuously falling down. This implies that the company is not using its assets in a better way to generate revenue. The company is not using the full utilization of its assets. So the company should look into this and try to increase the ratio in near future.
D) Analysis of the Investment ratio
The investment ratio is one of the key ratios that are not only used by the company but is extensively used by the investors in order to compare different companies and then take a decision to invest in one particular company. There are various ratios that help to understand the investment ratio they are as follows “working capital ratio, the quick ratio, earnings per share (EPS), price-earnings (P/E), debt-to-equity, and return on equity (ROE) (Susanti, et al. 2020, p.3).”
 Figure 9: “Investment Ratios of Morgan Sindall” (Source: self-developed)
There are three ratios that have been calculated under investment ratios.
Debt to equity ratio (D/E ratio)
This ratio is an essential ratio that is been seen by both the investors and the company. This ratio is calculated by dividing the long-term debt of the company by the total equity that the company has. This ratio tells the liquidity of the company. This ratio is also been studied by banks and institutes before giving loans to a company. The lower the ratio the better the company’s liquidity position (Bima and Wijayanto, 2021, p.4). If a company has a zero D/E ratio that means the company has no debt.
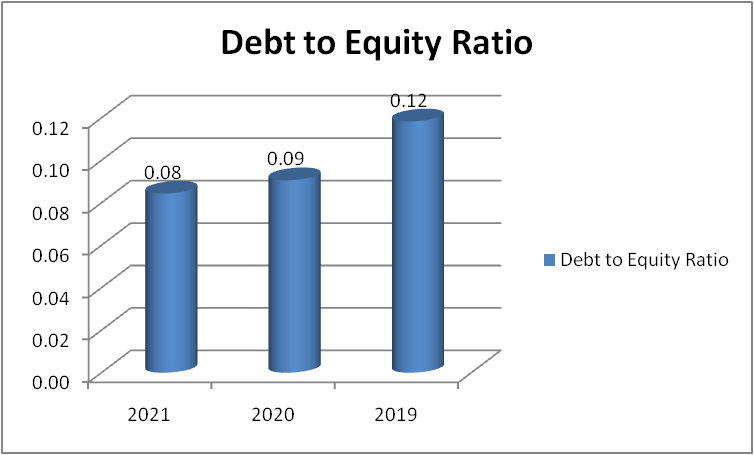 Figure 10: “Debt to equity ratio of Morgan Sindall” (Source: self-developed)
The company’s D/E ratio is very less and it is continuously decreasing so it is a good sign for the company. The company should try to lower it down to zero and make the company debt free. This will attract more investors and also increase the profit as the company would not have to pay interest amount.
Earnings per share (EPS)
EPS is been calculated by dividing the net profit by the total number of outstanding shares. This tells the investor how much per share a company earns in a given period of time. The higer the EPS the greater the company attracts investors.
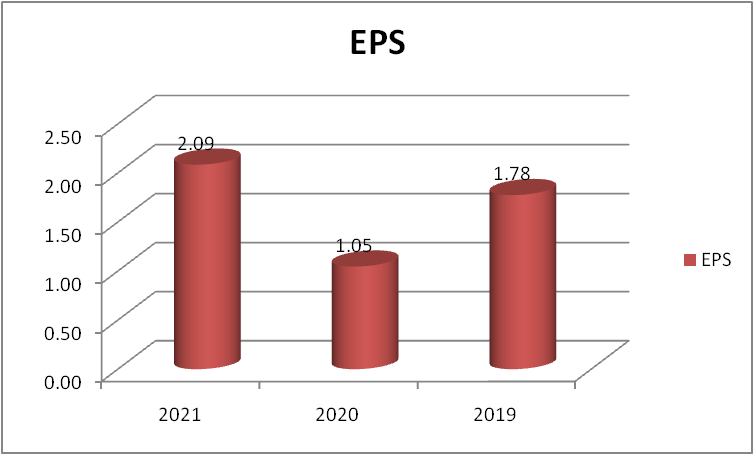 Figure 11: “Earning per share of Morgan Sindall” (Source: self-developed)
The company’s dropped in 2020 to 1.05$ as there was a drop in the net profit in the year 2020 but in 2021 the profit increased and so the EPS has risen. So the company should try to generate more income that will ultimately increase the EPS and more investors would be attracted.
Price to earnings ratio (P/E ratio)
This is the most common ratio that is been used by the investor in order to analyze the stock. The P/E ratio tells the amount the investor has to invest in stock in order to earn $1 from the company’s earnings. This is the reason the P/E ratio is also termed a “price multiplier”.
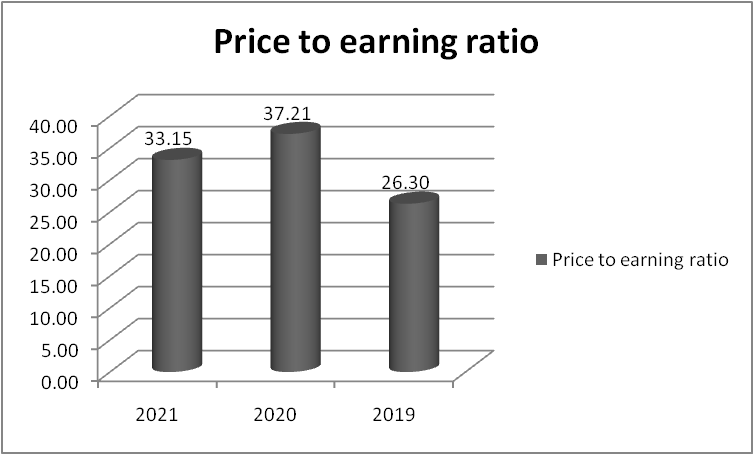 Figure 12: “Price to earnings ratio of Morgan Sindall” (Source: self-developed)
The company’s P/E ratio is slightly on the higher side and it has also increased to 33.15 in 2022. So it can be seen that there is a rise in the value of the shares of the company. When the company will generate greater income and the value of the stock remains the same then the P/E ratio would come down.
e) limitations of ratio analysis and how it can be mitigated
Yes, there is various limitation that a ratio analysis poses they are as follows:
Historical information: The ratios that are been calculated are all based on past records, so it does not tell about the future growth or business opportunity that the business has. So, a company on the basis of ratio can never be completely judged on the future performance of the company.
Inflationary effect: Financial ratios are calculated on the basis of periodic data, so if there is an inflation effect in-between periods it would not be seen in the ratios that have been calculated.
Changes in the policy of accounting: The ratios are used to compare with the past records, so if there is a change in the policy then the ratio that would be calculated ould be different. So, it cannot be compared with the past ratios (Pontines, 2021, p.2). For example, if the company was following the Straight-line method in depreciation in past and has changed it to the written down method then there would be an effect in the company’s NPM and so the ratio cannot be compared.
Manipulation of the financial statement: Sometimes to grab the attention of the investor and to raise the value of the stock the company manipulates the value in the financial statement and due to this the ratio that is been calculated is wrong. For example, when a new asset has developed the prediction of the profit that it would make is already added this manipulates the profit margin and hence a wrong ratio is been calculated. Manipulation is always done by management in accounting fraud cases.
To mitigate this limitation the exchange should thoroughly keep an eye on all the financial reports that are being published by the company and the auditor of the company should also be investigated. One should also look at the technology that is coming in the future and
Conclusion
From the above analysis it can be seen that the company is well-positioned internally and in the coming years there can be growth. Though the company was affected by the covid-19 and which led to a fall in revenue and profit in 2020. The company’s NPM margin is low so the company should try to increase its net profit. Though the company’s investment ratios are quite good that has attracted investors and this has led to increase in the price of the stock of the company.
Reference
Jihadi, M., VILANTIKA, E., HASHEMI, S.M., Arifin, Z., BACHTIAR, Y. and Sholichah, F., 2021. The effect of liquidity, leverage, and profitability on firm value: Empirical evidence from Indonesia. The Journal of Asian Finance, Economics, and Business, 8(3), pp.423-431.
Kadim, A., Sunardi, N. and Husain, T., 2020. The modeling firm’s value based on financial ratios, intellectual capital, and dividend policy. Accounting, 6(5), pp.859-870.
Madushanka, K.H.I. and Jathurika, M., 2018. The impact of liquidity ratios on profitability. International Research Journal of Advanced Engineering and Science, 3(4), pp.157-161.
Markonah, M., Salim, A. and Franciska, J., 2020. Effect of profitability, leverage, and liquidity to the firm value. Dinasti International Journal of Economics, Finance & Accounting, 1(1), pp.83-94.
Megaladevi, P., 2018. A study on the impact of liquidity ratios on profitability of selected cement companies in India. ICTACT Journal on Management Studies, 4(04).
Nguyen, T.N.L. and Nguyen, V.C., 2020. The determinants of profitability in listed enterprises: A study from Vietnamese stock exchange. The Journal of Asian Finance, Economics and Business, 7(1), pp.47-58.
Pontines, V., 2021. The real effects of loan-to-value limits: empirical evidence from Korea. Empirical Economics, 61(3), pp.1311-1350.
Sari, D.P., Nabella, S.D. and Fadlilah, A.H., 2022. The Effect of Profitability, Liquidity, Leverage, and Activity Ratios on Dividend Policy in Manufacturing Companies in the Food and Beverage Industry Sector Listed on the Indonesia Stock Exchange in the 2016-2020 Period. Jurnal Mantik, 6(2), pp.1365-1375.
Susanti, N., Latifa, I. and Sunarsi, D., 2020. The effects of profitability, leverage, and liquidity on financial distress on retail companies listed on Indonesian Stock Exchange. Jurnal Ilmiah Ilmu Administrasi Publik, 10(1), pp.45-52.
website
Morgansindall.com, 2022, Overview and financial report of the company, available at: https://www.morgansindall.com/about/strategy-and-kpis [Accessed on 15th November, 2022]
Appendices
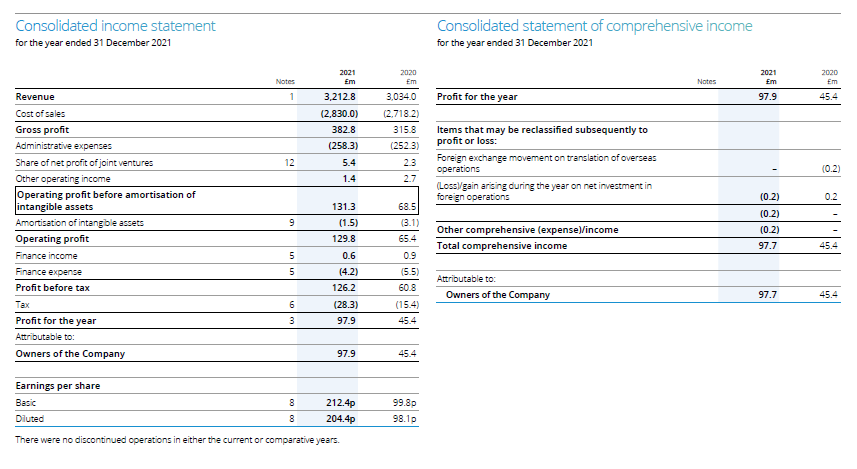
Appendix 1: financial statement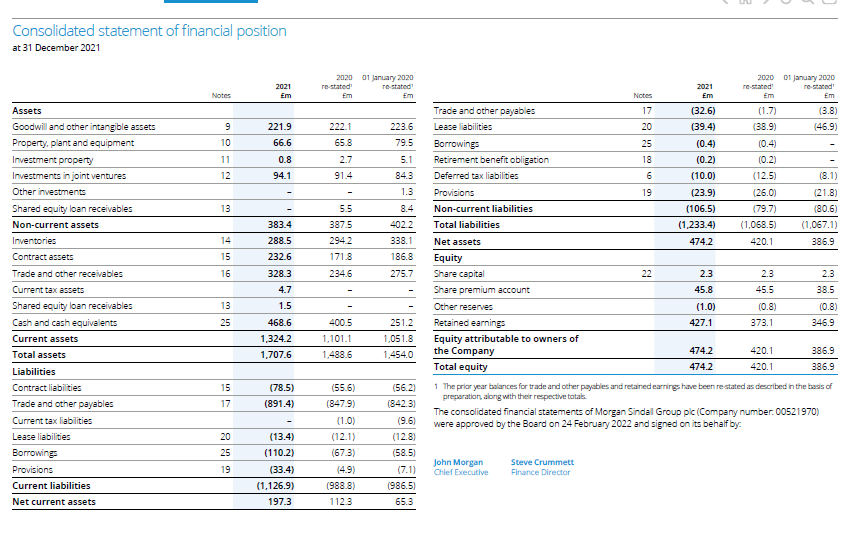
Know more about UniqueSubmission’s other writing services:

