CIS010-6 ASSIGNMENT SAMPLE – DATA MODELLING AND MANAGEMENT 2022
Question 1
a. Case Modeling Is Advantageous
There are various reasons why SQL modeling is very much required as it helps in creating a complete database which is required in every organization. The people’s data is somewhere or the other unique like in case of finding any document of any employee then the contact number of that person has to be different from the other person.
Even if the person’s other minute details get matched but the contact number of the person won’t be matched so henceforth the particular person can be taken into considerations and there would be no communication gap or rephrasing like the miscommunication can be minimized.
The communication gap creates a hazard in the organization like the people can be misguided and misunderstood and henceforth the company always creates a unique identification number of them in order to find out the right person’s database if required. If another organization is taken into consideration then the association needs to find out the right person by using his or her booking id which is another unique code number or by taking the reference of their phone number.
Taking another broader example of it is while using the same with the school database. The primary key of way too many entities would be the unique identification number in sorting the student data. It would enhance the work quality and therefore the working time can be reduced and a better working atmosphere can be created.
This will assist users in “defining concepts associated with entity-relationship modeling” (Chan et al., 2019).
For example “some of the tables should relate, as well as the fields that will be on every table”. It is reported as “entities”, “characteristics”, and “relationships”. “ER diagrams” maybe “converted to relational tables, allowing users to easily create databases”. With computerized information, administrators can utilize Graphical representations as templates to integrate data into particular operating systems.
With the help of “an ERP diagram”, the data model obtains a greater understanding of the knowledge that will be “stored in the database”. The “ERD Diagram” is escorted by developers to discuss with users the application’s structured way (Hao et al., 2020).
b. The Concept of a ER- Diagram
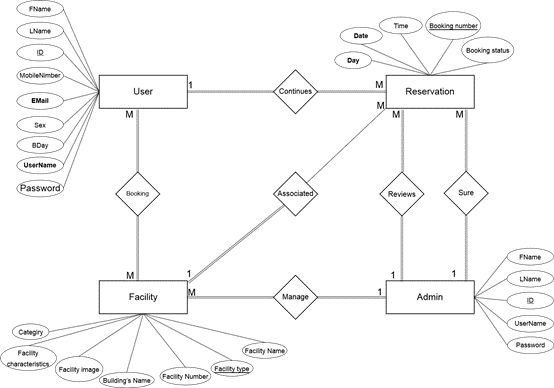
In this concept where the people get the privilege of creating and making a booking of the place before-handed and that to be three months prior to the visit, then in this situation, the database of the people helps the administration to run efficiently. The administrator who is guiding the people or the system needs to be updated with the typical issues of everyone that need to be accumulated by the admin in the form of data.
The people need to submit their regular attendance, their booking approval form along with it they need to provide the data of the logical things like the medical condition. If the data is made then they can identify if someone has allergies or not or consider every individual is allergic to something then the allergy or particular problem can be monitored.
Considering another issue that is if the member wants to reschedule the date of visit or wants to cancel it then that data can be easily updated in the system (Kocifaj et al., 2020).
An entity-relationship diagram (ERD), sometimes called a conceptual data model, is indeed a graphical portrayal of communication between individuals, things, locations, thoughts, and occurrences in systems integration (IT) system. “Organizations, characteristics, and connections are the three core ideas that Entity relationship diagrams are built on.
Rectangles are used to represent entities, ovals are used to describe characteristics, and diamond shapes are used to indicate relationships in ER Diagrams” (Kocifaj et al., 2018). The connections between data items contained in a computer are shown in an entity-relationship diagram (ERD). An ER diagram represents the design of a system by describing entities, their properties, and the interactions between them.
Entity-relationship diagrams are being used to draw out a website’s layout. The Entity-Relationship Diagram (ERD) is a visual illustration of an ERM and is among the most commonly utilized system design software today. Entities, characteristics, and connections are the three fundamental components of the ER Diagram.
The rectangle, oval, and diamond are the three fundamental symbols used to indicate connections between components, objects, and characteristics in the Entity Relationship Diagram Symbols & Notations. Many sub-components in the ERD Graph are based on four strategic elements.
The ER Diagram is a graphical display of data that shows how distinct ERD Signals and Notations relate to one another. The major aspect of this technology is e-ticketing administration, and the Er model shows the program’s fundamental features. Its data was made up of multiple payments and available accommodations for ticket purchases.
This function is extremely crucial to the platform since it collects every one of the valuable information from the consumers. These details were put in place to keep track of their activities and other critical system details (Sun et al., 2020).
c. Case Diagram

Question 2
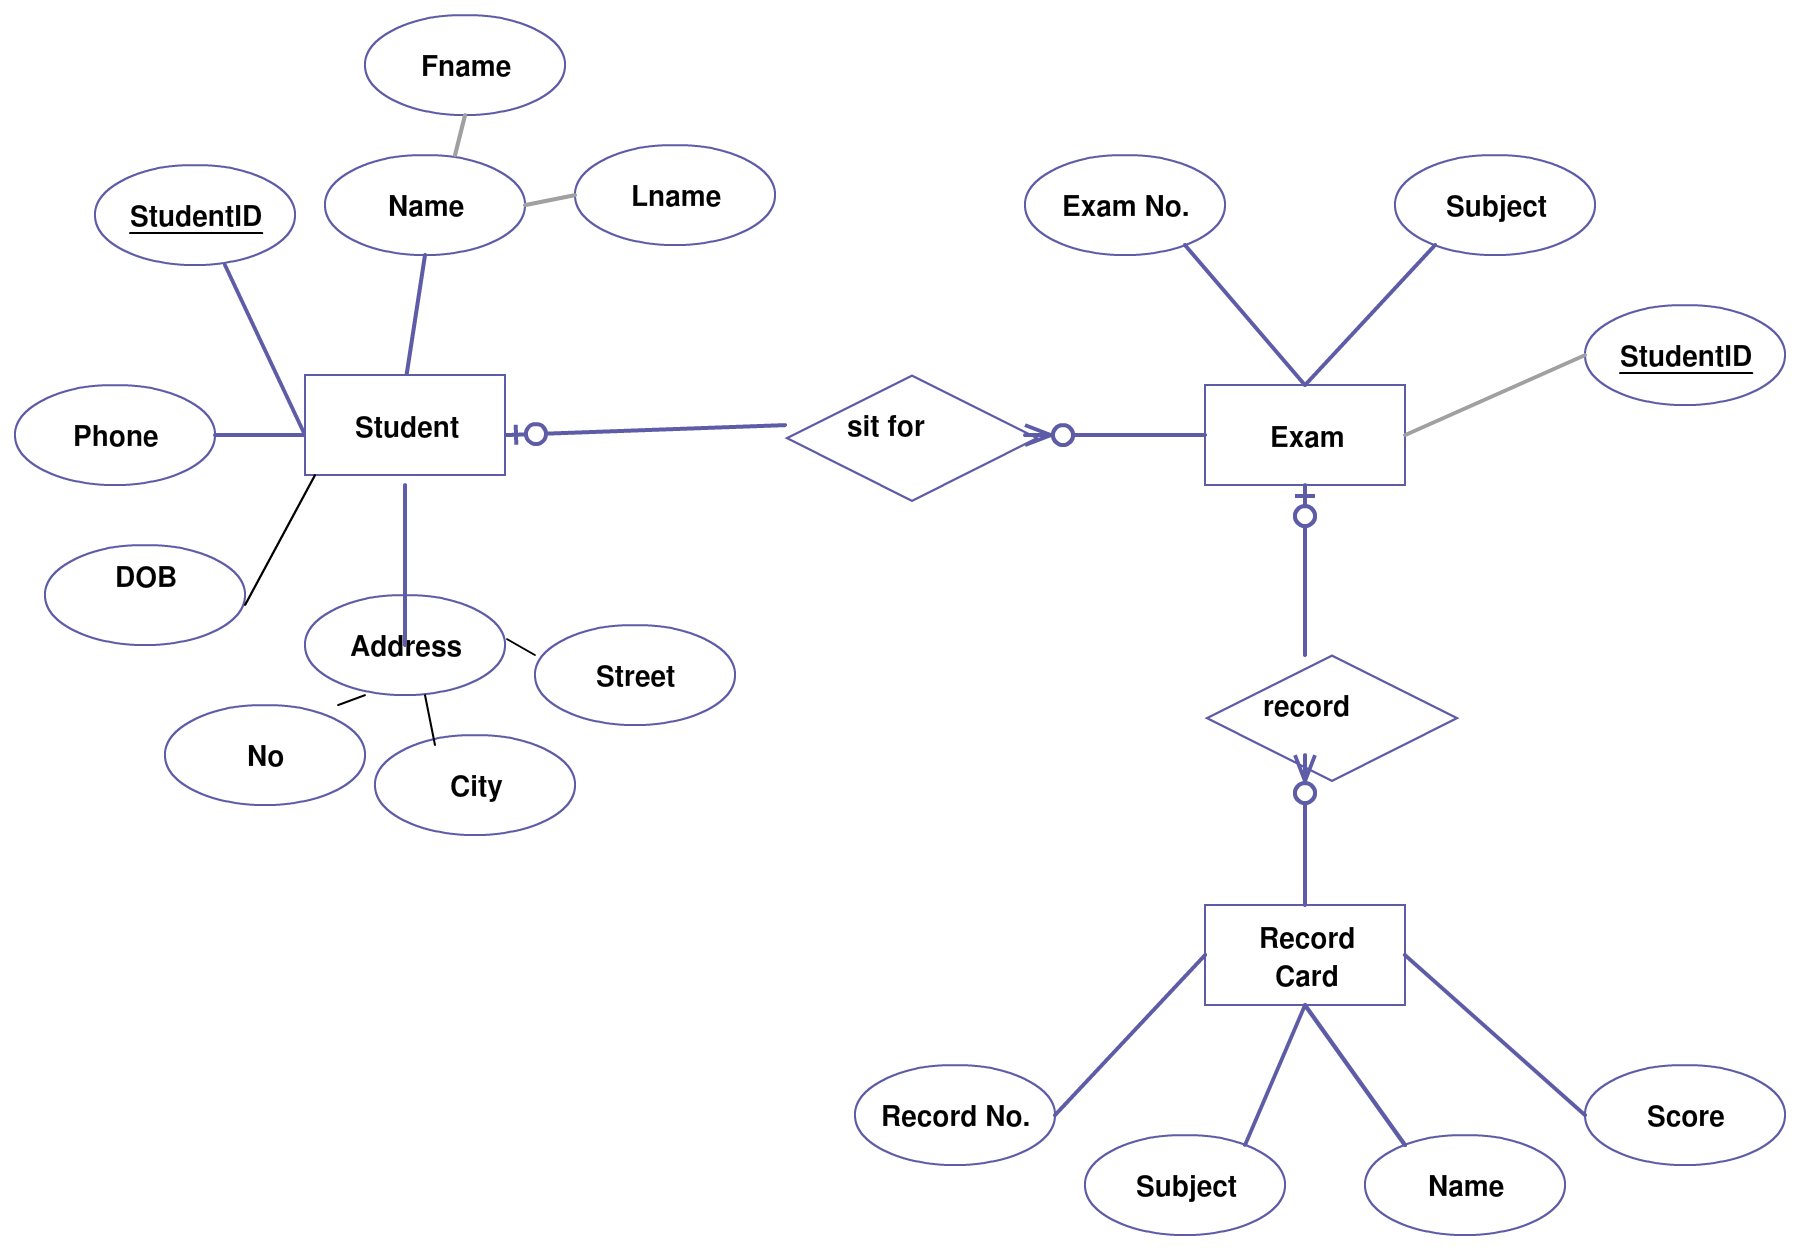
a. “Entity-Relationship Model”
“Entity Relationship Diagram” (ERD) is a diagram that shows the connection between entity types recorded in a system. In those other respects, ER diagrams aid in the explanation of relational structured ways. Organizations, properties, and connections are the “three core ideas that ER diagrams are built on”.
Rectangular shapes are used to indicate objects, “ovals are used to describe characteristics, and diamond shapes are used to indicate connections in Flowcharting”. An “ER diagram” appears to be quite similar to a “flowchart at first glance”. The ER Diagram, on the other hand, has “numerous specific symbols and the meanings of these symbols distinguish this model”.
Entity-Relationship Model (ER Model) is an elevated semantic data prototype model. The “ER model” aids in the “methodical analysis” of data needed “in order to create a really good system”. The ER Model is an example of actual things and their connections (Szoszkiewicz et al., 2020).
b. Entity-Relationship Model/Diagram

Question 3
a. SQL Select Statement
SELECT * FROM MEMBER;
b. SQL Statement
CREAT TABLE MEMBER (
MemberID INT NOT NULL PRIMARY KEY AUTO_INCREMENT,
FirstName VARCHAR (50) NOT NULL,
Surname VARCHAR (50) NOT NULL,
Address VARCHAR (100) NOT NULL,
ContactEmail VARCHAR (50) NOT NULL,
ContactNumber VARCHAR (30) NOT NULL,
Current (TRUE, FALSe),
);
c. How The Where Clause Can Be Used
The SQL WHERE clause is used to specify a requirement when retrieving information about a specific table or when combining data from many tables together. If the condition is met, it retrieves a specific value from the table. You should use the WHERE clause to direct the entries and carry only the most important ones with you.
SELECT * FROM MEMBER
WHERE MemberID=1;
d. SQL Statement That Uses Select Distinct
SELECT ref.MEMBER from information_schema.rows ref
WHERE ref.MemberID = ‘RowsOrder’
ORDER BY ref.MEMBER;
Question 4
a. The Concept Of Data Normalization
The practice of arranging information in the repository is called as “normalization”. This entails “building tables and defining linkages between them using rules meant to safeguard data while also making the database more adaptable by removing duplication and mismatched dependencies”. An approach for arranging data items is “normalization”.
“A database must be normalized in order to reduce redundancy (duplicate data) and guarantee that only relevant data is saved in each column”. It also avoids any problems caused by record changes like implantations, removals, and upgrades. It also reduces duplication and enhances data consistency, resulting in better query speed. Researchers split a dataset into rows and build linkages between the sections to standardize it.
b. The Table
Table: Books
| “Title” | “Author” | “Author Nationality” | “Format” | “Price” | “Subject” | “Pages” | “Thickness(mm)” | “Publisher” | “Publisher Country” | “Publication Type” | “Genre Name” | |
| Philosopher’s Stone | “J.K. Rowling” | “United Kingdom” | “fantasy fiction” | $3.6 | “magic illusion” | 700 | 3.2 | “Bloomsbury Publishing” | “United Kingdom” | “Original” | “Magic realism” | |
| Chamber of Secrets | “J.K. Rowling” | “United Kingdom” | “fantasy fiction” | $4 | “magic illusion” | 690 | 3 | “Bloomsbury Publishing” | “United Kingdom” | “Original” | “Magic realism” | |
| Prisoner of Azkaban | “J.K. Rowling” | “United Kingdom” | “fantasy fiction” | $6.2 | “magic illusion” | 750 | 3.5 | “Bloomsbury Publishing” | “United Kingdom” | “Original” | “Magic realism” |
Reference List
Journals
Chan, D.W., Olawumi, T.O. and Ho, A.M., 2019. Perceived benefits of and barriers to Building Information Modelling (BIM) implementation in construction: The case of Hong Kong. Journal of Building Engineering, 25, p.100764.
Hao, T., Elith, J., Lahoz‐Monfort, J.J. and Guillera‐Arroita, G., 2020. Testing whether ensemble modelling is advantageous for maximising predictive performance of species distribution models. Ecography, 43(4), pp.549-558.
Kocifaj, M., Kómar, L., Lamphar, H. and Wallner, S., 2020. Are population-based models advantageous in estimating the lumen outputs from light-pollution sources?. Monthly Notices of the Royal Astronomical Society: Letters, 496(1), pp.L138-L141.
Rácz, A., Bajusz, D. and Héberger, K., 2018. Modelling methods and cross-validation variants in QSAR: a multi-level analysis$. SAR and QSAR in Environmental Research, 29(9), pp.661-674.
Sun, T., Li, H., Wu, K., Chen, F., Zhu, Z. and Hu, Z., 2020. Data-driven predictive modelling of mineral prospectivity using machine learning and deep learning methods: a case study from southern Jiangxi Province, China. Minerals, 10(2), p.102.
Szoszkiewicz, K., Jusik, S., Pietruczuk, K. and Gebler, D., 2020. The Macrophyte Index for Rivers (MIR) as an advantageous approach to running water assessment in local geographical conditions. Water, 12(1), p.108.
Know more about UniqueSubmission’s other writing services:


Thank you for your sharing. I am worried that I lack creative ideas. It is your article that makes me full of hope. Thank you. But, I have a question, can you help me?
Can you be more specific about the content of your article? After reading it, I still have some doubts. Hope you can help me.