CRITICALLY ASSESS THE OPTIONS FOR REPRESENTING GEOGRAPHICAL PHENOMENA IN A GIS
Introduction
The effect of Covid -19 has forced Governments around the world to impose restrictions on daily life to prevent the spread of the virus. Moreover, the modelling techniques to investigate the air quality and atmospheric conditions have shown a layer of interactivity within the span of years.
The GIS is used to evaluate and interpret various spatial data through software representation and accurate interpretation. The importance of GIS is identified in relation to accessing the use of technology for proper interpretation advantage within the software. The monthly map variations due to the changes in climatic conditions are identified to get a greater insight into the study.
Thesis statement
The thesis statement of the essay is focused on critically assessing the options for representing geographical phenomena in a GIS to access and interpret and evaluate the processes effectively.
Discussion
Changes in atmospheric conditions due to the Covid-19 Pandemic
The meteorological factors relating to the temperature, and relative humidity, considering the various concentrations of various elements have been adequately affected due to the pandemic situation. Moreover, the pandemic acts as a challenge and has drastic changes in air quality due to a reduction in concentrations of particulate matter (Fan et al., 2020).
Besides these, a marked imbalance in changes in temperature is observed due to the emergence of the pandemic situation. The direct effect of the pandemic-driven response is identified to reduce the global temperature by 2030. Moreover, the influence of changes in the composition of the Earth’s atmosphere drives fluctuations of temperature and influences climate changes effectively over the span of years.

Figure 1: Changes in the atmospheric conditions and emissions in China
(Source: aaqr.org, 2020)

Figure 2: Influence of atmospheric temperature changes in the UK
(Source: nature.com, 2020)
The study analyses the satellite observation data in response to the environmental impact due to the Covid-19 outbreak. The mean integrated horizontal irradiance variations show the lockdown effects and provide insight into the lockdown effects and future surface radiance extremes over the region.
Evaluating the corresponding changes in pollution emission
The rise of the pandemic situation has however increased the quality of air for the short term due to increased transportation restrictions and better assessing the temperature and outbreak of air quality by implementing certain programs to improve the same. Moreover, the Covid-19 pandemic has created an unprecedented decrease in air traffic transmission (Hoang et al., 2021).
Despite these, the industrial slowdown during the pandemic has not curbed out adequately the record levels of greenhouse gases. Furthermore, the pandemic is not identified as a factor for climate change rather it is identified as a forward link to reduce emissions over the years.

Figure 3: the reduction in density of tropospheric Nitrogen Dioxide
(Source: bbc.com, 2020)
Analysing the global monthly map to explore the following from April 2019-April 2020
Tropospheric nitrogen dioxide
China’s policy intervention has shown adequate economic and environmental impacts over the years. The region has observed a 48% drop in tropospheric nitrogen dioxide which is associated with a higher magnitude of reductions as well (pubmed.ncbi.nlm.nih.gov, 2020).
Moreover, the region is associated with identifying satellite nitrogen dioxide measurements and monitoring the changes in fossil fuel usage over the years. Ozone monitoring instrument, tropospheric monitoring instrument offers a higher spatial resolution measurement of nitrogen dioxide over the region.
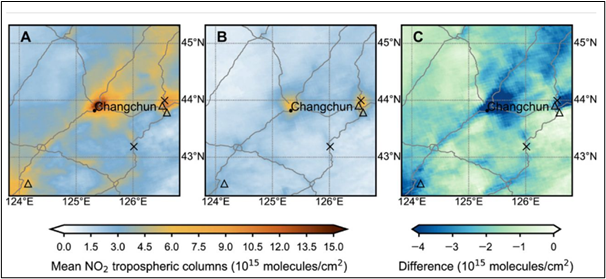
Figure 4: Changes in the tropospheric Nitrogen Dioxide over the years
(Source: science.org, 2020)
The large rapid reduction in emissions due to the pandemic situation has adequately reduced the levels of Nitrogen Dioxide. Moreover, Greenhouse gas emissions are reduced by 13% due to such restrictions. Besides these, the UK has noticed Spatio-temporal changes in the variation and vertical column density during the lockdown period.
However, the geographical dynamics and the introduction of GIS and Remote Sensing have adequately helped in the proper analysis and interpretation of the phenomena effectively (Goodchild et al., 2007). Therefore, the effect of the Pandemic situation has adequately revised the level of atmospheric stability within the atmosphere effectively.
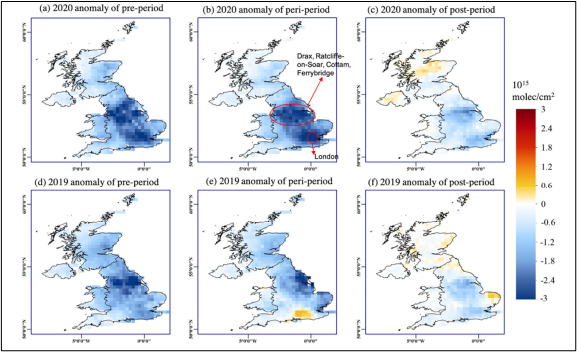
Figure 5: Spatio-temporal variation in Nitrogen Dioxide in UK
(Source: par.nsf.gov, 2020)
Total ozone layer cover
The lockdown during the pandemic situation has cut down the local nitrogen emissions and the effect of ozone pollution was global and seen an unprecedented rapid. However, the reduction in the emission of Nitrogen Dioxide has resulted in a total drop of 2% in the ozone. Thereby, the implementation of proper monitoring and satellite observations and models unlocks new technology in the operational field of geospatial data (Goodchild, 1992).
Despite these, the region has faced an increase in the ozone layer which acts as a detrimental factor for growth and damages the vulnerable population effectively. However, the positive impact associated with the coronavirus lockdown has seen record-breaking healing of the ozone hole and adequate air quality changes within the atmosphere.

Figure 6: Ozone layer Cover
(Source: nasa.gov, 2021)
Carbon surface mass concentration
The significant reduction in anthropogenic emissions has drastically changed the pattern of energy demands around the world. Despite these, there is a reduction of 26% on average in annual emissions over the years (Pinals et al., 2021).
However, the real-time data regarding the implications of the reduction in the mass carbon concentration is considered an important factor under the concerned study. The region has maintained the reduced levels by implementing policies to reduce carbon-intensive fuels which act as an external reducing agent and climatic change phenomena over the years.
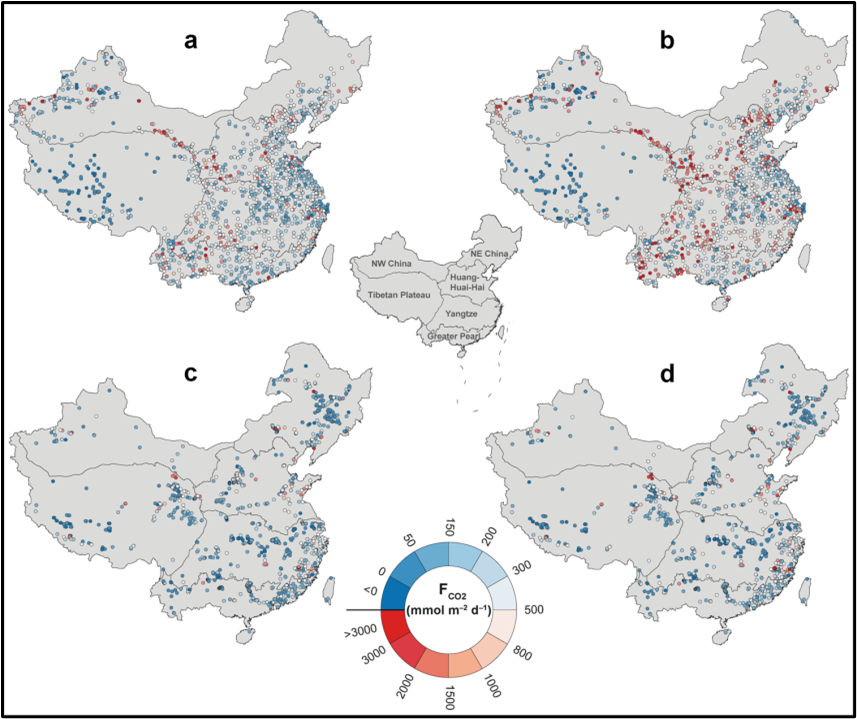
Figure 7: The carbon surface concentration over the years
(Source: nature.com, 2022)
The unexpected decrease in China was driven by a combination of environmental alterations and massive high-scale program implementation to restore stability initiated in the region. Therefore, maintaining a global estimate of regional and global carbon budgets is identified as an important factor in this aspect (Jephcote et al., 2021).
Modelling the database to understand the carbon footprint and impact of sustainability UK has adequately implemented programs for reducing the same (theccc.org.uk, 2022). Moreover, they have taken adequate steps to expand low-carbon energy supplies to maintain wider environmental benefits to the population and positive well-being to the health of the generations.
Industrial processes and transportation
The pandemic has been identified as a driving agent to maintain environmental standards and drop in pollution across the world. Moreover, climate change is considered an existential threat to the population and increases the frequency and intensity of weather events as well.
Besides these, the pandemic situation has adequately reduced the greenhouse gas emission and concentration of global warming gases and decreased the higher levels of hazardous emissions as well (Goodchild, 1992). However, the GIS has adequately helped to analyse the huge amount of data, logistically routing decisions and cutting the overall pollution and fuel costs over the region. Thereby, maintaining the stability and climatic changes associations within the network.
Time series of observed nitrogen dioxide over the years
Rising NO2 levels in the UK and China reflect the lack of conservativeness and sustainability of the government’s environmental approach. The figure presented below highlights the estimated annual average background concentration of NO2 levels in the UK region. The results of the national empirical model reveal annual average exceedances of 40 µg m-3 across the board throughout London (pubs.acs.org, 2022).
The limiting values in maintaining the air quality network and quality ton strategies to identify the same are associated in the regions. However, the use of GIS technology in accessing the interpretation has been used as an important tool to mitigate the effects of climate change where the technology tracks the information related to the climate change phenomena over the region (Moore, and Remedios, 2021).
The empirical observations and models speak about the exceedances in background locations relating to the implications of the study.
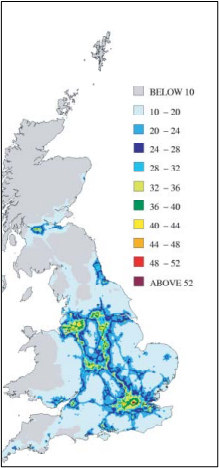
Figure 8: Changes in the levels of Nitrogen Dioxide over the years
(Source: pubs.acs.org, 2022)
Spatial-temporal variations observed during the pandemic
The Spatio-temporal dynamics in temperature and precipitation show the extent of variations and spatial relationships to analyse the temporal changes and the statistical processes. Moreover, the changes in the pattern of temperature have shown a positive and negative trend as well.
However, the use of geographical dynamics has adequately moderated the correlation in relation to the spatial and temporal changes over the region (thelancet.com, 2022). Besides these, the temporal and spatial variability in temperature in relation to the climatic effect is crucial for containing the projected upsurge in the region concerned under the study.
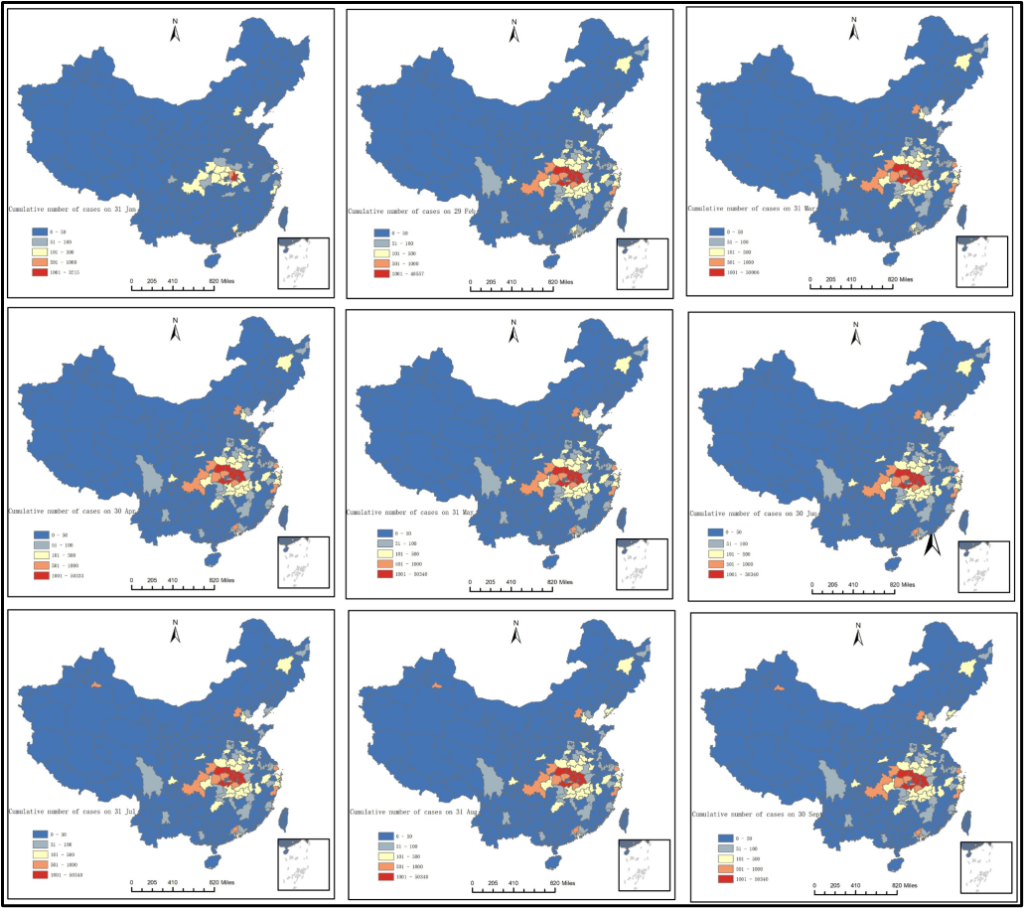
Figure 9: Spatio-temporal changes in temperature and precipitation over a period of time
(Source: cbsnews.com, 2022)
Conclusion
The use of GIS in assessing the importance of variability and spatial-temporal changes for further integrating the process through a concept of phase space is identified as crucial factor. The Spatio-temporal variations in Nitrogen dioxide, the carbon layer and the ozone layer associated with the alarming pandemic situations are also important factors for further processing and monitoring the changes within the region.
Analysis of spatio temporal operations is identified as an essential factor in the study. Hence, to conclude the introduction of GIS has adequately helped in analysing the changes in the field of geospatial study effectively.
References
Aaqr.org, (2020).”Special Issue on COVID-19 Aerosol Drivers, Impacts and Mitigation”.Available at:https://aaqr.org/articles/aaqr-20-05-covid-0226, [Accessed on 30th September, 2022]
Bbc.com, (2020). “Coronavirus: Air pollution and CO2 fall rapidly as virus spreads”.Available at:https://www.bbc.com/news/science-environment-51944780, [Accessed on 30th September, 2022]
Cbsnews.com, (2022).,. “”. Available at:https://www.cbsnews.com/news/arctic-ozone-hole-largest-closed/[Accessed on 30th September, 2022]
Fan, Z., Zhan, Q., Yang, C., Liu, H. and Zhan, M., (2020). How did distribution patterns of particulate matter air pollution (PM2. 5 and PM10) change in China during the COVID-19 outbreak: a spatiotemporal investigation at Chinese city-level. International Journal of Environmental Research and Public Health, 17(17), p.6274.
Goodchild, M. F. (1992) Geographical data modelling, Computers and Geosciences, 18(4), pp. 401-408.
Goodchild, M.F., Yuan, M. and Cova, T.J., (2007). Towards a general theory of geographic representation in GIS. International journal of geographical information science, 21(3), pp.239-260.
Hoang, A.T., Huynh, T.T., Nguyen, X.P., Nguyen, T.K.T. and Le, T.H., (2021). An analysis and review on the global NO2 emission during lockdowns in COVID-19 period. Energy Sources, Part A: Recovery, Utilization, and Environmental Effects, pp.1-21.
Jephcote, C., Hansell, A. L., Adams, K., & Gulliver, J. (2021). Changes in air quality during COVID-19 ‘lockdown’ in the United Kingdom. Environmental pollution (Barking, Essex : 1987), 272, 116011.
Moore, D.P., & Remedios, J.J. (2021). Diagnosing air quality changes in the UK during the COVID-19 lockdown using TROPOMI and GEOS-Chem. Environmental Research Letters, 16
Nasa.gov, (2021). “Local Lockdowns Brought Fast Global Ozone Reductions, NASA Finds”. Available at:https://www.nasa.gov/feature/jpl/local-lockdowns-brought-fast-global-ozone-reductions-nasa-finds[Accessed on 30th September, 2022]
Nature.com ,(2022). “Substantial decrease in CO2 emissions from Chinese inland waters due to global change”. Available at:https://www.nature.com/articles/s41467-021-21926-6[Accessed on 30th September, 2022]
Nature.com, (2020). “Record high solar irradiance in Western Europe during first COVID-19 lockdown largely due to unusual weather”. Available at:https://www.nature.com/articles/s43247-021-00110-0, [Accessed on 30th September, 2022]
Par.nsf.gov, (2020). “Spatiotemporal changes in global nitrogen dioxide emission due to COVID-19 mitigation policies”. Available at:https://par.nsf.gov/servlets/purl/10248766[Accessed on 30th September, 2022]
Pinals, R.L., Yang, D., Lui, A., Cao, W. and Landry, M.P., (2019). Corona exchange dynamics on carbon nanotubes by multiplexed fluorescence monitoring. Journal of the American Chemical Society, 142(3), pp.1254-1264.
Potts, D.L., Marais, E.A., Boesch, H., Pope, R.J., Lee, J.D., Drysdale, W.S., Chipperfield, M.P., Kerridge, B.J., Siddans, R.,
Pubmed.ncbi.nlm.nih.gov, (2020). “Abrupt decline in tropospheric nitrogen dioxide over China after the outbreak of COVID-19”. Available at:https://pubmed.ncbi.nlm.nih.gov/32923601/, [Accessed on 30th September, 2022]
Pubs.acs.org, (2022). “Groun\d level NO2”. Available at:https://pubs.acs.org/doi/10.1021/acs.est.2c03834[Accessed on 30th September, 2022]
Science.org, (2020). “Abrupt decline in tropospheric nitrogen dioxide over China after the outbreak of COVID-19”. Available at:https://www.science.org/doi/10.1126/sciadv.abc2992, [Accessed on 30th September, 2022]
Theccc.org.uk, (2022). “The Sixth Carbon Budget report”. Available at:https://www.theccc.org.uk/publication/sixth-carbon-budget/[Accessed on 30th September, 2022]
Thelancet.com, (2022), “Air pollution reduction and mortality benefit during the COVID-19 outbreak in China”. Available at:https://www.thelancet.com/journals/lanplh/article/PIIS2542-51962030107-8/fulltext, [Accessed on 30th September, 2022]
Know more about UniqueSubmission’s other writing services:

