LD7084 Assignment Sample – Database and Analytics Principles 2022
Section 1: Relational Database
- Entity Relationship Diagram (Crow’s foot notation)
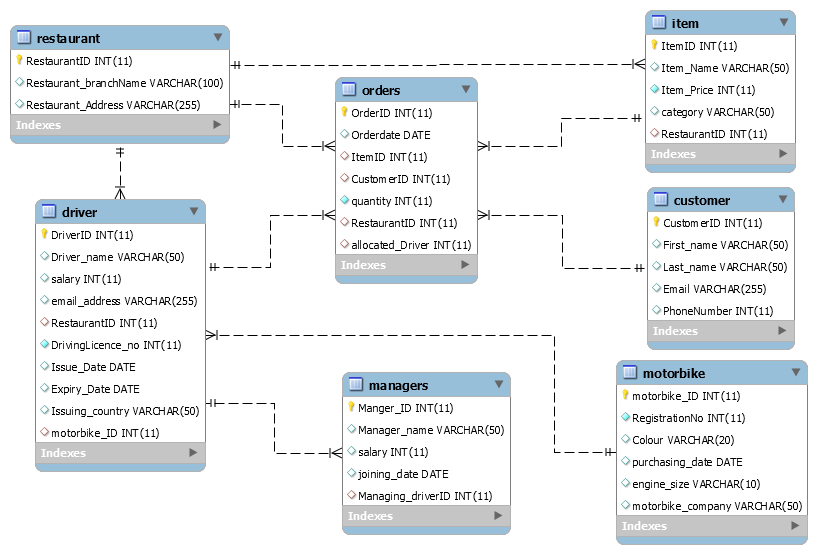
Figure 1: Crow’s Foot Network
(Source: My SQL Workbench)
The above figure represents the Crow’s foot network of the following database of WeDeliver Company. The crow’s foot network helps to develop the Entity Relationship Diagram of the following database (Mehdipour et al. 2019). In the above ER Diagram, there are seven different types of class or Entity such as Driver, Restaurant, Order, Item, Customer, Motorbike and Managers. The following entities act as different tables in the database.
There are various types of relations between the different entities. This can be defined as the cardinality between these classes. The cardinality can be many to many, many to one, one to many, one to one etc. For example, one manager can manage one driver or many drivers, but one driver can be managed by only one manager. Similarly, a customer can make much order, but one order has to be performed by a single customer.
Cardinality is very much important in developing a database by using SQL. This is the reason that SQL is called the Relational Database management language. In each entity, there are also many different attributes, and each entity must have a Primary key that is used for identifying that particular entity (Fouché et al. 2018). One primary attribute of any table or entity can act as a foreign key in another table, and the foreign key helps to make a relation between these tables or entities.
- Producing SQL Script
- Data Definition Language (Creating Tables)
Create Database WeDeliver;
Use WeDeliver;
Create Table Customer(
CustomerID int not Null,
First_name varchar(50),
Last_name varchar(50),
Email varchar(255),
PhoneNumber int,
primary key(CustomerID)
);
Create Table Restaurant(
RestaurantID int not null,
Restaurant_branchName Varchar(100),
Restaurant_Address Varchar(255),
Primary key(RestaurantID)
);
Create Table driver(
DriverID int not null,
Driver_name varchar(50),
salary int,
email_address varchar(255),
RestaurantID int,
DrivingLicence_no int not null,
Issue_Date date,
Expiry_Date date,
Issuing_country varchar(50),
motorbike_ID int,
foreign key (RestaurantID) REFERENCES Restaurant(RestaurantID),
foreign key (motorbike_ID) REFERENCES Motorbike(motorbike_ID),
Primary key(DriverID)
);
Create Table Motorbike(
motorbike_ID int not null,
RegistrationNo int not null,
Colour varchar (20),
purchasing_date Date,
engine_size varchar(10),
motorbike_company varchar(50),
primary key(motorbike_ID)
);
Create Table Managers(
Manger_ID int,
Manager_name varchar(50),
salary int,
joining_date date,
Managing_driverID int,
primary key(Manger_ID),
foreign key (Managing_driverID) REFERENCES driver(DriverID)
);
Create table Item(
ItemID int not null,
Item_Name varchar(50),
Item_Price int not null,
category varchar(50),
RestaurantID int,
Primary key(ItemID),
foreign key(RestaurantID) references Restaurant(RestaurantID)
);
Create Table Orders(
OrderID int not null,
Orderdate date,
ItemID int,
CustomerID int,
quantity int not null,
RestaurantID int,
allocated_Driver int,
Primary key(OrderID),
foreign key(ItemID) references Item(ItemID),
foreign key(CustomerID) references Customer(CustomerID),
foreign key(RestaurantID) references Restaurant(RestaurantID),
foreign key(allocated_Driver) references driver(DriverID)
);
- Data Manipulation Language (Inserting Data into Tables)
This part of the study is focused on inserting data into the different tables presented in the database of WeDeliver. In order to insert data into tables, it can be done in two different ways (Rashid, 2019). One way of inserting data in tables using SQL is to use “Data import wizard” options present in the SQL software.
The figure presented below shows the process of importing data into the table. Another option of inserting data in tables is to use SQL commands such as “Insert into Table name Values ();” commands. This is also shown in the figure below.

Figure 2: Data import Wizard function
(Source: MySQL Workbench)
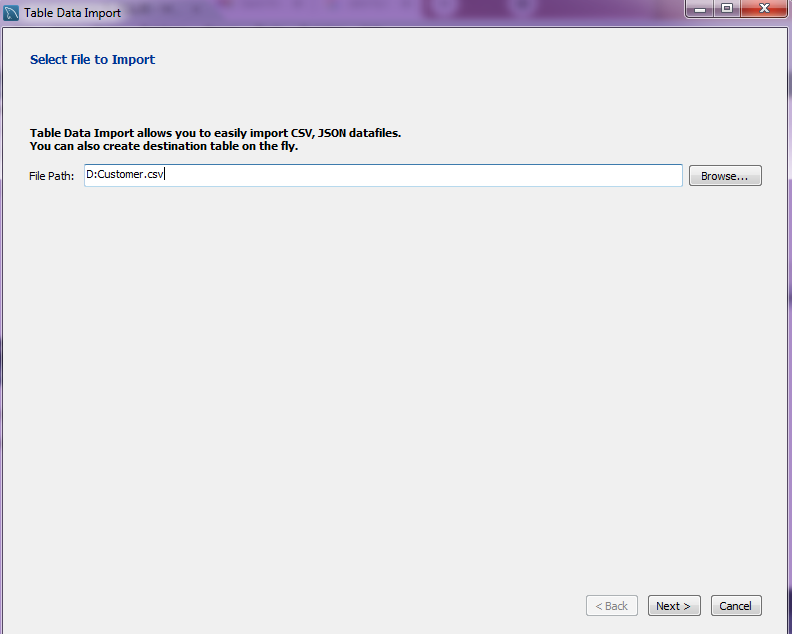
Figure 3: Importing data from CSV files
(Source: MySQL Workbench)
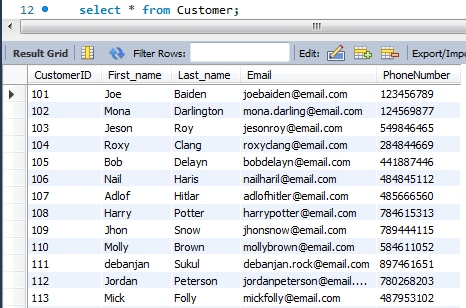
Figure 4: Customer Table
(Source: MySQL Workbench)

Figure 5: Restaurant Table
(Source: MySQL Workbench)
Insert into Motorbike Values
(301, 1201, ‘Red’, ’11-03-2010′, ‘125 CC’, ‘Honda’),
(302, 1202, ‘Blue’, ’08-02-2012′, ‘150 CC’, ‘Honda’),
(303, 1203, ‘Black’, ’25-05-2014′, ‘250 CC’, ‘Yemaha’),
(304, 1204, ‘Red’, ’16-06-2019′, ‘125 CC’, ‘Suzuki’),
(305, 1205, ‘Ocean Blue’, ’03-05-2020′, ‘250 CC’, ‘Suzuki’),
(306, 1206, ‘Cherry Red’, ’01-02-2009′, ‘110 CC’, ‘Hero’),
(307, 1207, ‘Yellow’, ’09-12-2018′, ‘125 CC’, ‘MG’),
(308, 1208, ‘Green’, ’03-05-2018′, ‘250 CC’, ‘Suzuki’),
(309, 1209, ‘Gray’, ’13-09-2016′, ‘250 CC’, ‘Honda’),
(310, 1210, ‘Red’, ’04-02-2019′, ‘110 CC’, ‘Honda’),
(311, 1211, ‘Yellow’, ’16-06-2017′, ‘250 CC’, ‘Renault’);
Insert into Driver Values
(4001, ‘John Willey’, 1050, ‘john12@email.com’, 202, 45802, ’01-02-2016′, ’31-11-2024′,
‘UK’, 302),
(4002, ‘Willam Johnson’, 1100, ‘willamjohn78@email.com’, 213, 84101, ’02-08-2010′, ’31-12-2022′,
‘Grece’, 301),
(4003, ‘Rox Sane’, 1000, ‘rox123@email.com’, 212, 78540, ’01-06-2014′, ’31-12-2021′,
‘UK’, 305),
(4004, ‘Sattam Willam’, 1040, ‘sattamwillam@email.com’, 211, 10234, ’07-07-2011′, ’01-04-2025′,
‘UK’, 304),
(4005, ‘Vishal Blaze’, 1060, ‘vishalblazer007@email.com’, 210, 98542, ’26-11-2017′, ’05-10-2023′,
‘UK’, 306),
(4006, ‘Subhankar Trump’, 1070, ‘trump786@email.com’, 209, 27894, ’01-09-2018′, ’30-12-2030′,
‘Italy’, 303),
(4007, ‘Johns Sins’, 1200, ‘jhonsmike@email.com’, 204, 24122, ’01-09-2016′, ’12-08-2026′,
‘UK’, 308),
(4008, ‘Micky Mousey’, 1300, ‘mickymouse@email.com’, 206, 19090, ’02-04-2015′, ’13-05-2022′,
‘UK’, 307),
(4009, ‘Johnny Walker’, 1050, ‘walker.Johy.com’, 207, 74651, ’04-02-2017′, ’14-09-23′,
‘UK’, 309),
(4010, ‘Indiana Sattam’, 1200, ‘indiana9878@email.com’, 205, 75993, ’12-04-2019′, ’12-06-2032′,
‘UK’, 310),
(4011, ‘Luke Blaze’, 1350, ‘lukeblaze01@email.com’, 201, 45012, ’03-07-2012′, ’10-06-2026′,
‘UK’, 311);
Insert into Managers Values
(501, ‘Vidor Khan’, 4550, ’15-02-19′, 4001),
(502, ‘Mark Wins’, 3250, ’10-01-20′, 4002),
(503, ‘Jerry Rigg’, 2500, ’01-12-20′, 4003),
(504, ‘Molly Fatis’, 3500, ’01-02-16′, 4004),
(505, ‘Denim Bravo’, 1580, ’18-05-2019′, 4005),
(506, ‘Share Warne’, 2500, ’01-12-2018′, 4007),
(507, ‘Chris Gayle’, 1925, ’01-10-2020′, 4006),
(508, ‘James Peterson’, 1590, ’01-10-2018′, 4008),
(509, ‘Nail Patris Harris’, 2300, ’10-09-2017′, 4005);
Insert into Item Values
(1, ‘Pizza’, ‘£9.50’, ‘Main Course’, 210),
(2, ‘Coke’, ‘£2.50’, ‘Drinks’, 201),
(3, ‘Garlic Bread’, ‘£7.50’, ‘Starter’, 210),
(4, ‘Garlic Bread’, ‘£5.50’, ‘Starter’, 202),
(5, ‘Chocolate Creme’, ‘£3.50’, ‘Deserts’, 203),
(6, ‘Chill Black forest’, ‘£4.50’, ‘Deserts’, 209),
(7, ‘Apple juice’, ‘£1.50’, ‘Drinks’, 208),
(8, ‘Chicken Burger’, ‘£3.75’, ‘Starter’, 205),
(9, ‘Beaf Rasala’, ‘£6.75’, ‘Main Course’, 202),
(10, ‘Chicken Biryani’, ‘£10.50’, ‘Main Course’, 207),
(11, ‘Gluten free desire’, ‘£2.50’, ‘Drinks’, 204),
(12, ‘Turkey’, ‘£12.50’, ‘Main Course’, 206);
Insert into Orders Values
(2001, ’13-06-2020′, 11, 101, 1, 206, 4008),
(2002, ’25-02-2021′, 3, 102, 2, 210, 4005),
(2003, ’07-11-2020′, 4, 103, 2, 202, 4001),
(2004, ’06-01-2021′, 11, 104, 1, 204, 4007),
(2005, ’05-10-2020′, 6, 105, 1, 209, 4006),
(2006, ’17-09-2019′, 10, 106, 1, 207, 4009);
- DML Statements and Queries
- Self-join
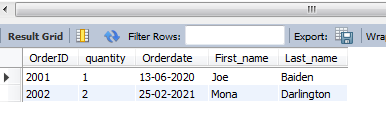
SELECT Orders.OrderID, Orders.quantity, Orders.Orderdate, Customer.First_name, Customer.Last_name
FROM Orders
INNER JOIN Customer
ON Orders.CustomerID = Customer.CustomerID
GROUP BY Orders.quantity;
- Equi-join
Select driver.Driver_name, driver.DriverID ,Motorbike.motorbike_ID, Motorbike.engine_size ,
Restaurant.Restaurant_branchName, Restaurant.Restaurant_Address
from driver, Motorbike, Restaurant
Where driver.motorbike_ID = Motorbike.motorbike_ID
And driver.RestaurantID = Restaurant.RestaurantID;

Figure 6: Equi-join
(Source: MySQL Workbench)
- Group Function
Select Restaurant.Restaurant_branchName , Orders.OrderID, Orders.Orderdate,
Restaurant.Restaurant_Address, Restaurant.RestaurantID
From Restaurant, Orders
Where Orders.RestaurantID = Restaurant.RestaurantID
Group by Orders.Orderdate;

Figure 7: Group Function
(Source: MySQL Workbench)
- Sub query
Select * from Driver;

Subquery-
SELECT * FROM Driver where Issue_Date = (select min(Issue_Date) from Driver);

Figure 8: Sub query
(Source: MySQL Workbench)
- Null Values Statements
Select * from Managers
Where Manager_name is not null;
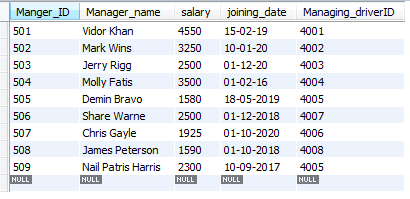
Figure 9: Null Values Statements
(Source: MySQL Workbench)
Section 2: Data Warehouse Modeling
The concept of data warehousing is a process which can be utilized for the process of managing and collecting data from various sort of sources to give meaningful business suggestions to a business organization (Martinez-Maldonado et al. 2019). In this case as well the organization WeDeliver wanted to achieve competitive advantages over different sort of other competitors.
In order to keep them ahead of the competition, the organization wanted to develop their data modeling plan, and for that, there are few sorts of things the organization needs to take into consideration. There are different sort of data warehouse such as “Enterprise Data Warehouse” which is considered as a centralized warehouse which gives support service in terms of decision across the organization. In addition to that, it also offers a unified method for representing and organizing the data for the organization.
This sort of method also provides the capability to classify the data according to the research area and provide access according to the divisions that are there inside the organization (Lemahieu et al. 2018). There is another sort of data warehouse called “Operational Data Store”, which is nothing but the data stores needed when neither the OLTP systems nor the data warehouse supports the needs of the organization.
In this case, using this method, the organization can broadly be preferred for the process of routine activities such as storing records for the employees (FG Assis et al. 2019).
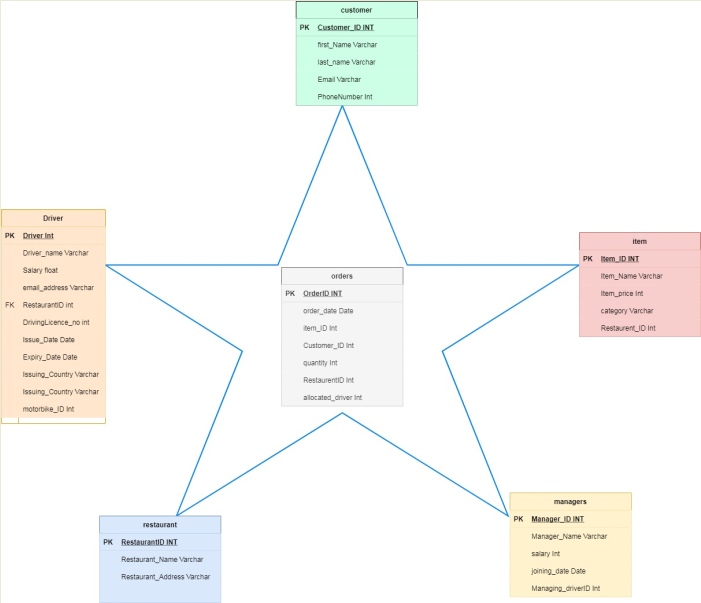
Figure 10: Star Schema
(Source: Draw.io)
Section 3: Data Mining
- Data Preparation Stage and importance
In the data preparation stage and importance, the data mining process, the preparation thus uses by transforming and cleaning of data prior to processing and analysis. The processing involves such involvement for formatting data breaching conduct (Ajah and Nweke, 2019). Thus it makes corrections for the data in combining with datasets to relate with other data sources and derivations.
The process for documenting in the depicting processes for Cross Industry process in the data mining process. The framework for the data mining process has a data analyst and process for the scientist to follow. This has been carried out by different orders, which requires analysts to work upon specific criteria to deal with certain phases when it is required. CRISP-DM requires to be as such, which entails understanding and also by understanding the details for maintaining it to be as such important.
The two-way connections have a number of iterations that are required to maintain for refining the predictions, thus increasing the modal accuracy. Real-world has the procurement that implies corrupting raw data entities (Kipf et al. 2017). Data preparation stages to ensure the dataset modeling about stages and improving the quality of the data. Misleading about the predictions for analytical consistency feed about insufficient quality data.
The data required to be scanned for the data to get familiar with specific identifications that relate as such for quality problems that provide insights about the changes. This can be used as checking the number for the type of features, for reliable descriptive approaches in visualizations and statistics for inconsistent data and records. Human deviation and discretion that looks to make skills about extremely vital to adequately in preparing and analyzing for following the stages about the data mining process.
To be imperative about the data forces that understand about the nature of the data for business clarity and business objectives. Well, available terms and conditions used by data science would require such formulation of data munging or data wrangling. The summarized technique that gives the snapshot which includes particular involvement for Data Preparation and techniques.
The essential tendency to clear particular perspectives for analytical model dependency about the high quality of any data fed system. Excellent quality information prompts more valuable bits of knowledge, which upgrade hierarchical dynamic and improve by and considerable operational proficiency. Information planning directed mindfully and with insightful mentality can save bunches of time and exertion, and thus the expenses caused (Qin et al. 2018).
As information science exercises rely fundamentally upon human experience and intelligence, it is absurd to expect to mechanize each element of information science and AI. In any case, numerous self-administration and cloud-based information readiness apparatuses are quickly arising in the market to robotize a few pieces of information arrangement measure.
Trifacta is one such cutting edge information fighting expert organization intending to utilize AI to mechanize information arrangement undertakings. Google has likewise dispatched Cloud Dataprep, which implants Trifacta interface, to dial down information groundwork for AI. With mechanical headways like IoT and Artificial Intelligence prompting information downpour, robust information planning is the way to accomplish any information science project (Evans, 2017).
In future, information readiness will be controlled by AI to make it more computerized. Likewise, accomplishing more remarkable ease of use, straightforwardness, and intelligence will be the significant objective in future information readiness draws near. There is a great deal of development to be found around here.
With the process of developing digitalization in the process of business, it is pretty essential for a business organization to power them as a lot of users together extract actionable insights from the quality sort of data. A high number of companies view the process of data preparation as an essential sort of tool to make betterment in their ability to employ data in a structured manner for the process of data discovery, advanced analytics and data mining (Kara et al. 2020).
It can be said that the process of data preparation needs to be done in such a way so that the objection of data collection and analysis can be fulfilled. The main aim of an organization in order to gather and analyze data is to increase the level of performance for the business process.
In addition to that, it can be said that after a successful process of data preparation, the analysis process can be better, and that can help in making the process of decision in a better way. The goal of data preparation is to ensure the demand of the data for the process of analytics in order to achieve insight into the world of changes along with streamlining the process of business.
- Two Machine learning algorithm
This part of the study is focused on analyzing the dataset and understanding the different types of machine learning language that can be used in order to process the following data set related to mortality rate and Heart failure. In order to perform this, Python Machine learning language can be used in predicting mortality by heart failure among the different people of various age groups.
In the following data set, there are twelve different columns regarding the values of different factors, including platelets, Death events, Age, Smoking etc., among male and female. Therefore, the different factors present in the dataset can be utilized in performing the prediction analysis. There are various types of machine learning Algorithms available such as Linear Regression, Logistic Regression, Decision Tree, SVM, Naive Bayes, KNN, K-Means, and Random Forest (Hoque et al. 2017).
In this study, Linear regression analysis and Logistic Regression Analysis can be performed in order to provide a prediction analysis of the Mortality Rate from the following dataset. The prediction results can be achieved by comparing the different parameters present in the dataset with the Death Event.
Linear Regression Analysis Code and output
Import pandas as pd
from matplotlib import pyplot as plt
df = pd.read_csv(‘Heart_Failure.csv’)
df.plot(x=’platelets’,y=’DEATH_EVENT’)
plt.show()
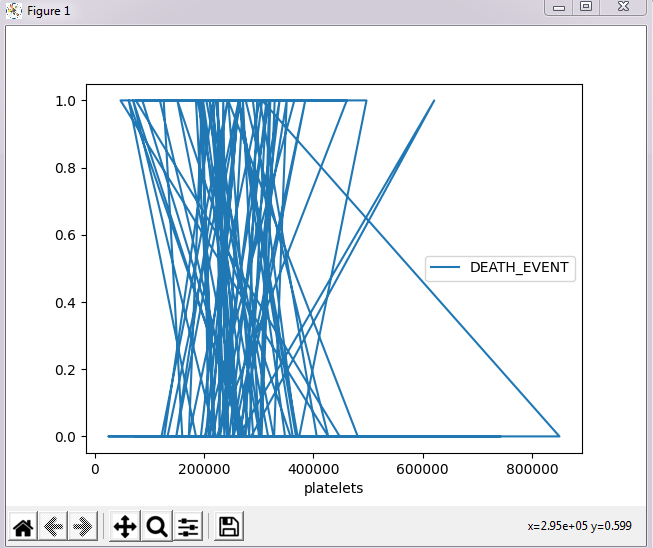
Figure 11: Regression analysis of mortality by heart failure
(Source: Python IDLE)
The above figure represents the linear regression analysis results, and the codes related to the machine learning language have also been provided. This is achieved by using Python Software performing the linear regression analysis of the dataset.
The python tool helps to make the data analysis process effective and interactive to the user. From the above figure, it can be seen that with the decrease in the platelets counts, the chances of Death Events increases where all the other factors are stable.
Section 4: Business Intelligence (Tableau)
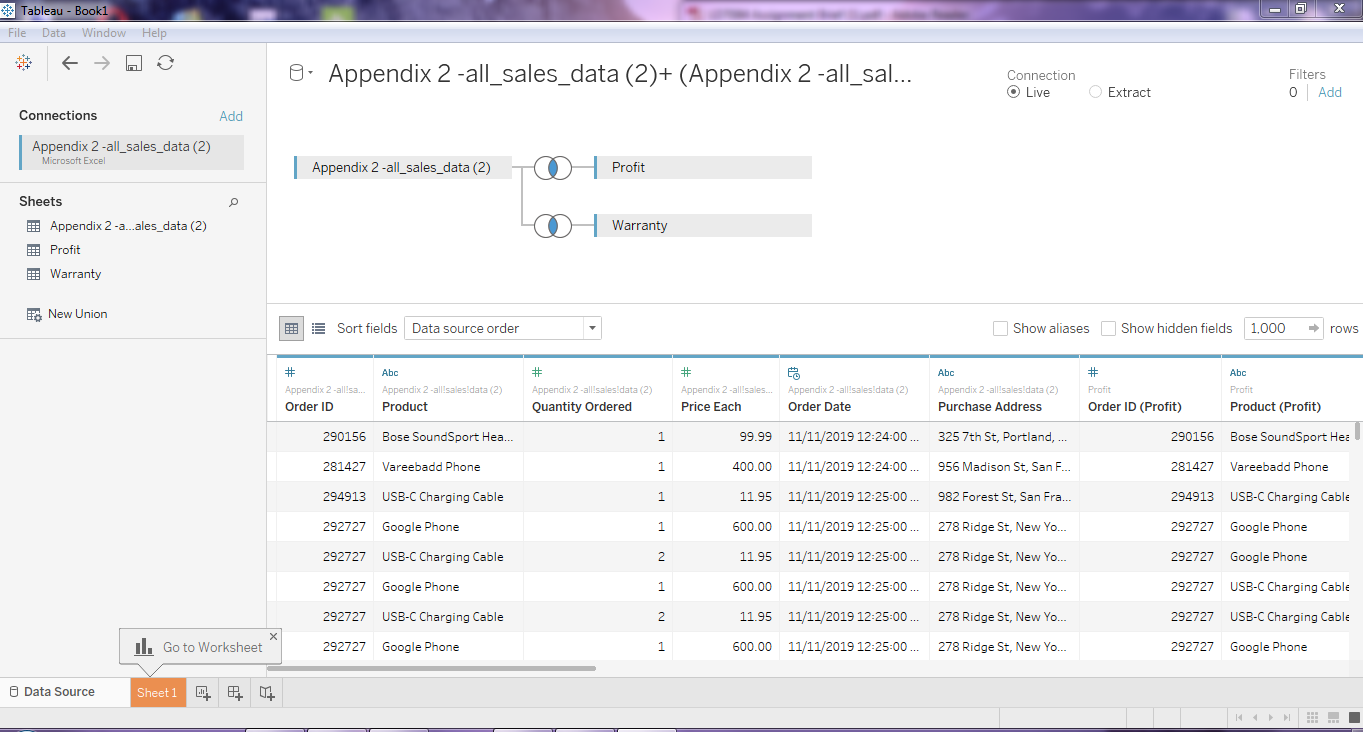
Figure 12: Import of dataset in the software
(Source: Tableau)
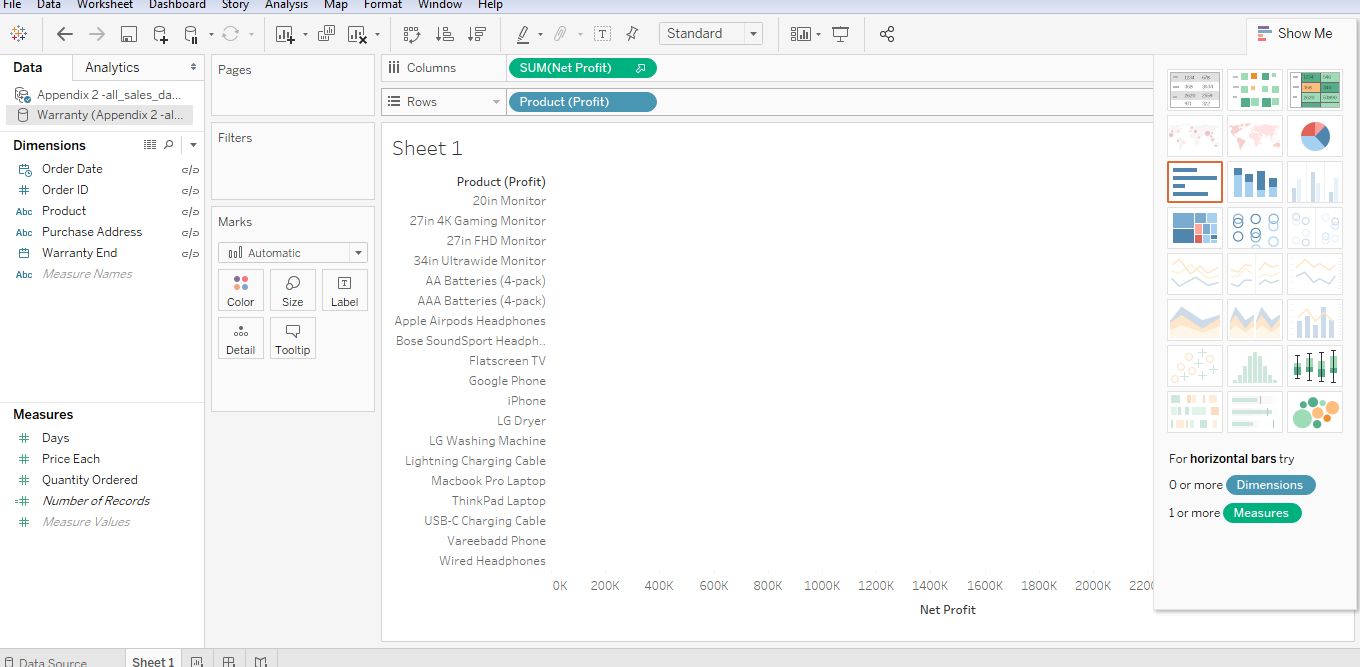
Figure 13: Data view in the software
(Source: Tableau)
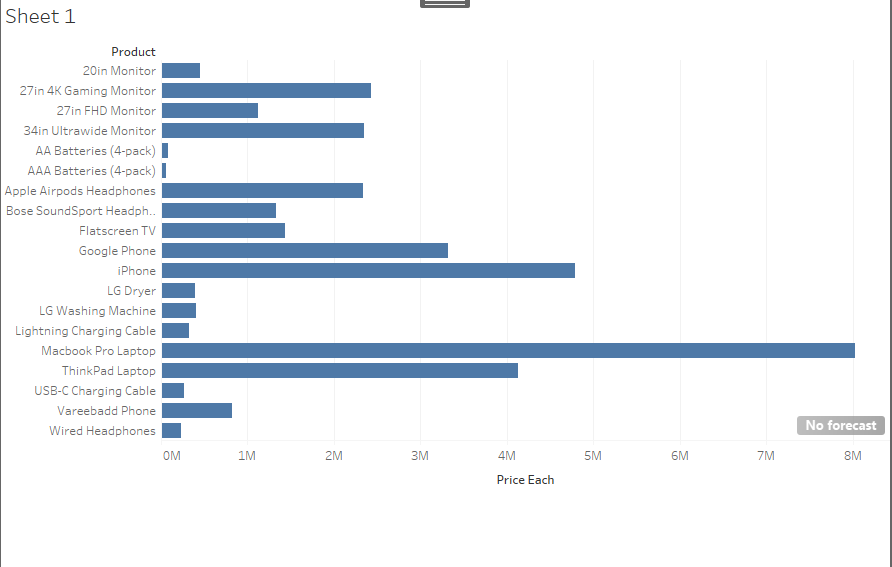
Figure 14: Graph outcome
(Source: Tableau)
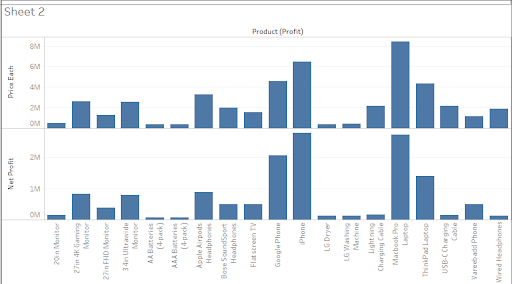
Figure 15: Graph outcome
(Source: Tableau)
Section 5: NoSQL Database
The database which the company chose is related to having relational databases and No SQL databases to be used. The manager of the company decided to use databases such as Relational databases. The factors related to enabling the influence of the database will be recommended in the database over.
No SQL database would be related as such information to derive about the built-in during about such time and database this has been cleared definition for their relationships (Mahato et al. 2019).
In the Relational database, the foreign key and primary key are being used in the same table format. In this startup company, only RDBMS data format has been chosen where the primary and foreign key both are used. RDBMS have been used for many years for more than 40 years or more. The technology advanced with the applications for a more static and straightforward approach.
The control of the SQL database has been appropriately handled with less equipped chances to elaborate on the complexities of data structure and data volumes. The relational NoSQL databases, which become more popular, have been made more flexible for scalable purposes.
Alternatively, the traditional approaches have been made flexible for relational databases. In the NoSQL database, MongoDB is being used to formulate the involvement for downtime for service interruptions.
Relational databases are such databases that are too relatable in the graph of the databases for a wide range of column stores. The data, which is known to be more complex, have NoSQL databases as such to handle the unstructured data format. NoSQL databases would relate to forms as such, increasing with the much of the data that exists accordingly.
NoSQL database, that declares within the structure for typically closed source in licensing skills that would be baked within the software. NoSQL tends to be better than Relational DBMS in the far better options for modern applications that have reasonable complexity. Most organizations or developers prefer NoSQL databases that can be engaged to form to be aligned in the market. NoSQL databases that can be stored for processed databases in real-time data and analysis.
While SQL databases it has some specific databases, the features have SQL related format that needs toi capable of handling the features. With tremendous costs and necessary sacrifices, it tends to be capable of handling the resources for sacrifices of speed and agility. MongoDB tends to orient about such NoSQL features that support dynamic, unstructured data (Hofmann and Rutschmann, 2018).
NoSQL database deals with a straightforward language comparatively Relational database that supports powerful query languages. NoSQL databases have changed in about fixed schema in the context of the data. Relational databases have fixed data schema. NoSQL database is the only access that is eventually consistent for specific perspectives forming negative aspects. NoSQL database seems to observe by data coming through high-velocity data deviations.
Relational database maintained to handle such data coming from the low-velocity formulation. NoSQL databases can be managed through structured and unstructured data format, then it is made clear about such semi-structured data, but for a Relational database, only structured databases are maintained. NoSQL has been made to control decentralized data, but relational databases have a centralized structure.
NoSQL databases give both reading and writing scalability, but in relational databases, it gives readable scalability only. NoSQL databases deployed within a horizontal fashion, but for Relational databases, the deployed access thus has a relatable vertical fashion. Non SQL programs can be referred for originally practiced databases that have non-relatable databases to provide a mechanism for storages.
Tabular relations could be modeled as such, which have been used in relational databases. Late in the 1960s, such databases came into action that needed to obtain about NoSQL monitors as such databases for relatively in the early twenty-first century. NoSQL databases have real-time chances as such web applications for being in observation with the data source that might be increasing with time. NoSQL databases tend to follow the web applications for big data, which could be increasing over time.
The horizontal discussion is relatable and fined with the control data for deriving with the cluster machine of more delicate control over the availability. The approach for sustainable development requires certain aspects of the database challenges.
Reference List
Journal
Mehdipour, F., Javadi, B., Mahanti, A., Ramirez-Prado, G. and Principles, E.C., 2019. Fog computing realization for big data analytics. Fog and edge computing: Principles and paradigms, pp.259-290.
Rashid, M.P., 2019. The Design and Implementation of AIDA: Ancient Inscription Database and Analytics System.
Martinez-Maldonado, R., Kay, J., Buckingham Shum, S. and Yacef, K., 2019. Collocated collaboration analytics: Principles and dilemmas for mining multimodal interaction data. Human–Computer Interaction, 34(1), pp.1-50.
Lemahieu, W., vanden Broucke, S. and Baesens, B., 2018. Principles of Database Management: The Practical Guide to Storing, Managing and Analyzing Big and Small Data. Cambridge University Press.
FG Assis, L.F., Ferreira, K.R., Vinhas, L., Maurano, L., Almeida, C., Carvalho, A., Rodrigues, J., Maciel, A. and Camargo, C., 2019. TerraBrasilis: A spatial data analytics infrastructure for large-scale thematic mapping. ISPRS International Journal of Geo-Information, 8(11), p.513.
Ajah, I.A. and Nweke, H.F., 2019. Big data and business analytics: Trends, platforms, success factors and applications. Big Data and Cognitive Computing, 3(2), p.32.
Kipf, A., Pandey, V., Böttcher, J., Braun, L., Neumann, T. and Kemper, A., 2017, March. Analytics on Fast Data: Main-Memory Database Systems versus Modern Streaming Systems. In EDBT (pp. 49-60).
Qin, J., Liu, Y. and Grosvenor, R., 2018. Multi-source data analytics for AM energy consumption prediction. Advanced Engineering Informatics, 38, pp.840-850.
Evans, J.R., 2017. Business analytics (p. 656). England: Pearson.
Kara, K., Hagleitner, C., Diamantopoulos, D., Syrivelis, D. and Alonso, G., 2020, August. High Bandwidth Memory on FPGAs: A Data Analytics Perspective. In 2020 30th International Conference on Field-Programmable Logic and Applications (FPL) (pp. 1-8). IEEE.
Hoque, E., Setlur, V., Tory, M. and Dykeman, I., 2017. Applying pragmatics principles for interaction with visual analytics. IEEE transactions on visualization and computer graphics, 24(1), pp.309-318.
Mahato, A., In-database Analytics in the Age of Smart Meters.
Hofmann, E. and Rutschmann, E., 2018. Big data analytics and demand forecasting in supply chains: a conceptual analysis. The International Journal of Logistics Management.
Fouché, E., Eckert, A. and Böhm, K., 2018, July. In-database analytics with ibmdbpy. In Proceedings of the 30th International Conference on Scientific and Statistical Database Management (pp. 1-4).
Know more about UniqueSubmission’s other writing services:

