LS4002 Data Submission Assignment Sample
Module Code And Title : LS4002 Data Submission Assignment Sample
Question 1:
Practical data of Kinetic invertase practical and rate (v) calculation:
| Temperature (degree C) |
Absorbance at 540 nm |
Reaction Rate (v) (A540 nm/min) |
||
| 0 | 0.109 | 0.112 | 0.0218 | 0.0224 |
| 22 | 0.291 | 0.303 | 0.0582 | 0.0606 |
| 30 | 0.403 | 0.397 | 0.0806 | 0.0794 |
| 40 | 0.575 | 0.609 | 0.1150 | 0.1218 |
| 50 | 0.872 | 0.752 | 0.1744 | 0.1504 |
| 70 | 0.081 | 0.097 | 0.0162 | 0.0194 |
| 100 | 0.165 | 0.155 | 0.0330 | 0.0310 |
Table 1: Absorbance data with the rate of reaction in different temperature (Source: Self made)
In this above table the reaction rates are calculated through estimated absorbance of invertase by the absorbance of light through DNS at 540 nm wavelength after sucrose cleavage by the enzyme invertase.
Question 2:
Curve plotted for rate of reaction and the temperature range of reaction:
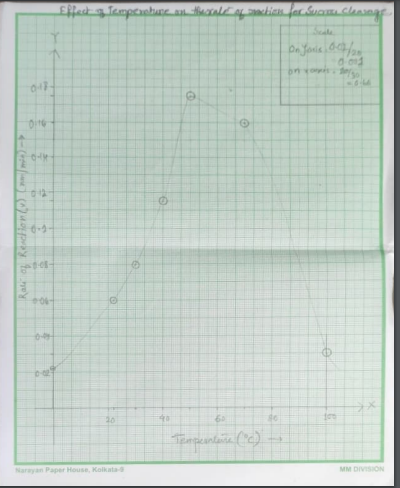
 Figure 1: Temperature effect on the rate of reaction (Source: Self made)
The optimum temperature is 50 degree centigrade. This is depicted through plotting the curve on the one particular reading of reaction rate and according to that the reaction rate is 0.1744 A540 nm/min.
Question 3
Bradford Protein Assay:
Bradford protein assay is the reliable protein estimation that is performed by applying a standard protein with protein needs to be estimated. Sometimes finding a standard protein is complicated. That’s why there are two readily available standard proteins that are used in assay and those are BSA or Bovine Serum Albumin and IgG or bovine gamma globulin. From these data the protein concentration can be calculated. In this assessment Absorbance of invertase is 0.156/min in 540 nm and the amount of protein it contains is 950 microgram/ml. The protein concentration can be calculated on the basis of “Standard protein volume (ml) X Standard protein concentration (mg/ml)= Amount of protein (mg)” here standard protein volume is considered 0.05ml
Standard protein concentration (mg/ml)=Amount of protein (mg)/Standard protein volume (ml)
| Standard protein (ml) | 0.15 M Nacl (ml) | Standard protein (microgram/ml) |
Absorbance 595 nm |
Specific absorbance |
||
| 0.0 | 1 | 0 | 0.388 | 0.385 | – | – |
| 0.2 | 0.8 | 120 | 0.442 | 0.453 | 0.056 | 0.067 |
| 0.4 | 0.6 | 240 | 0.548 | 0.520 | 0.162 | 0.134 |
| 0.6 | 0.4 | 360 | 0.644 | 0.622 | 0.258 | 0.236 |
| 0.8 | 0.2 | 480 | 0.694 | 0.719 | 0.308 | 0.333 |
| 1 | 0.0 | 600 | 0.787 | 0.830 | 0.401 | 0.399 |
Table 2: Light absorbance by the standard protein in the reagent dye at 595 nm (Source: Self made)
Question 4
Example of application of Dilution factor:
Most of the commercial assays will express a range of linear assay over which they are accurate. The unknown samples mostly reside in the linear range of samples. If the sample is greater than the linear range or outside the range they need to be diluted further.
As per example, if unknown samples are expected to have 5 mg/ml concentration and the range of assay is 0.1 to 1 mg/ml then the unknown sample is required to have a 10 fold dilution and that can draw it within the linear range. That dilution contains 9 parts of the buffer and 1 part of that unknown sample. To perform the assay and calculate the standard curve, the result should be around 0.5 mg/ml. To calculate the undiluted sample concentration of unknown aliquot it need to simply multiply the dilution factor as, 0.5*10 = 5 mg/ml.
Stock solution has a concentration of 600 microgram/ ml and the volume of the concentration of stock required is 0.2 ml the final concentration if that need to be found and the final volume is 1 ml then it can be estimated with C1V1=C2V2 and (600*0.2)/1= 120 microgram/ml that can be converted to mg/ml = 0.12 mg/ml.
Question 5:
Standard plot Absorbance against protein concentration:
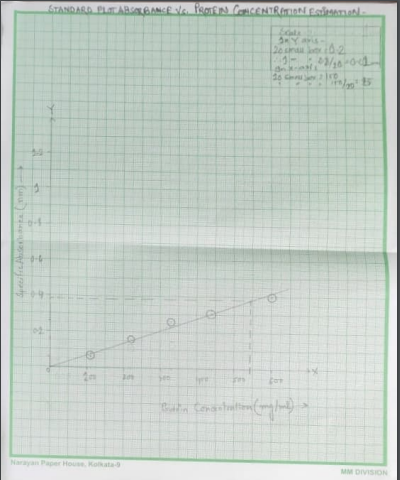
 Figure 2: Standard plot Absorbance against concentration (Source: Self made)
Question 6:
Standard plot Absorbance against concentration:
| Sample | Absorbance 540 nm | Protein concentration (mg/ml) |
| Invertase | 0.156 | 0.25 |
Table 3: Standard plot Absorbance against concentration (Source: self made)
This plot is established on the provided absorbance of invertase per minute in 540 nm and a standard straight line is illustrated from the origin 0 and from y axis or absorbance the value of invertase is located that is 0.156 and from that point on x axis or the concentration axis a straight line is plotted on the basis of intercepting point on the standard line. The concentration is 0.25 and as per the standard protocol this is more than the range of 0.1 to 1 mg/ml and that’s why the sample concentration is needed to be more diluted to fit in the linear range.
Question 7:
As it is known that the concentration is 1 ug/ml = 0.001 mg/ml and that’s why 950 ug/ml = 0.95 mg/ml. Here in this plot against absorption the protein concentration is 0.25 mg/ml in 1 min absorbance of 0.156 in 540 nm.
Question 8:
Optimum temperature is 55 degree Centigrade and Ea values 55.3 KJ/mol and delta G* is 71.2 kj/mol.
As it is known that “Total activity = (specific activity) X (total mg protein in preparation)”
The total activity of proteins is measured by the enzymatic activity within the fraction of volume used in the essay and that is multiplied by the total volume of fractions. The yields are the total activity of total derived proteins. The final yields are the amount of activity that is retained after each purification step. On the other hand the enzyme’s specific activity is another unit. This is enzyme activity per milligram within total volume.This is the micromoles of the product which are yielded by an enzyme within a mixture. Micromoles yield by an enzyme within a given time under a particular condition in per mg of total proteins. The specific activity of an equal rate of reaction that is multiplied by the reaction volume and that is divided by the protein mass. In SI which is Katal/kg and the practical unit is umol/mgmin.
Specific Activity = 1 unit enzyme/ (1000 ul * 0.95 mg/ml) /1000 = 1.052*10^-6
So, Total activity = 1.052*10^-6 X 0.95 = 1*10^-6
By temperature:
0.174/0.25=0.696 A540/min/mg
Reference list:
Journals:
Cruz Maldonado, J.J., 2019. The influence of pH in the kinetic characterization of thermophilic β-fructosidase from T. maritima. N/A.
Datir, S.S. and Regan, S., 2022. Role of alkaline/neutral invertases in postharvest storage of potato. Postharvest Biology and Technology, 184, p.111779.
Liu, R., Zhao, J., Xu, Z. and Xiong, Z., 2021. Comparison and Characterization of a Cell Wall Invertase Promoter from Cu-Tolerant and Non-Tolerant Populations of Elsholtzia haichowensis. International Journal of Molecular Sciences, 22(10), p.5299.
Mukherjee, A., 2021. Characterization, Purification and Immobilization of an Acid Invertase from Mentha Spicata (Pudina) for the Production of Invert Syrup. In Advances in Bioprocess Engineering and Technology (pp. 159-166). Springer, Singapore.
Sowokinos, J.R., Hayes, R.J. and Thill, C.A., 2018. Coordinated regulation of cold induced sweetening in tetraploid potato families by isozymes of UDP-glucose pyrophosphorylase and vacuolar acid invertase. American Journal of Potato Research, 95(5), pp.487-494.
Vitolo, M., 2021. Immobilization on chitin and polyethylene of invertase obtained from yeast grown in molasses by fed-batch process. World Journal of Pharmacy and Pharmaceutical Sciences, 10(3), pp.232-251.
Wohlers, K., Wirtz, A., Reiter, A., Oldiges, M., Baumgart, M. and Bott, M., 2021. Metabolic engineering of Pseudomonas putida for production of the natural sweetener 5‐ketofructose from fructose or sucrose by periplasmic oxidation with a heterologous fructose dehydrogenase. Microbial biotechnology, 14(6), pp.2592-2604.
Know more about UniqueSubmission’s other writing services:


Your point of view caught my eye and was very interesting. Thanks. I have a question for you.