SP0745 INTERNATIONAL RESOURCE MANAGEMENT IN SPORT
Assessment 2: (SP0745 INTERNATIONAL RESOURCE MANAGEMENT IN SPORT)
1. Introduction
Financial performance tells about economic health of an organisation and how well it is being able to perform the business operations. The study aims at using annual accounts from an international sport organisation in analysing its financial performance. This has been done with the help of ratio analysis such as performance ratios, liquidity ratios as well as capital structure ratios. In addition, based on the performance, recommendations will be proposed for financial management improving future effectiveness of the organisation. Company background has been included here mentioning history, business nature, size & recent developments.
2. Company background
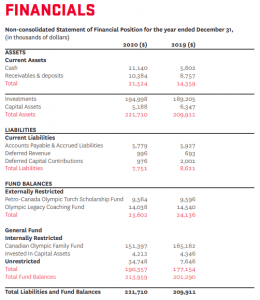
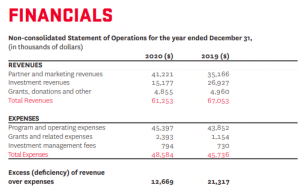
The “Canadian Olympic Committee” or COC is a private organisation representing Canada at the IOC or International Olympic Committee (olympic.ca, 2021). The organisation is a member of PASO or Pan American Sports Organisation. The company is working with National Sports Federations in preparing Team Canada for Youth Olympic Games, Olympic Games & Pan American Games. The company was created in the year 1904 and was recognised in the year 1907. It has its headquarters in Toronto, Ontario, Canada. The company “Canadian Olympic Committee” leads toward achievement of podium success as well as advances Olympic values across the country of Team Canada (olympic.ca, 2021). Turnover of the company is £ 61,253,000 in the year 2020. In the recent years, the company has witnessed financial downfalls due to the reducing revenues and profits that have resulted because of the pandemic. The company has received lower grants due to the pandemic and increase in expenses can be seen which is reducing profits. However, the company has opted for more funds in the last year out of which majority portion belong to internally generated ones (olympic.ca, 2020). A reduction can be seen in the externally generated funds of the company from £ 24,136,000 to £ 23,602,000.
3. Definition & critical discussion of financial performance
As per the views put forward by Daryanto & Samidi (2018), financial performance can be defined as a subjective measure of how well an organisation is performing and how well it is using its assets to generate revenues from the primary mode of business. Analysts as well as investors use financial performance in comparing past performance of a company with that of the future one. The also use ratio analysis in comparing similar companies across the same industry or in comparing different sectors or industries in aggregate. Financial performance can be measured with the help of ratio analysis such as performance ratios, liquidity ratios, efficiency ratios, investment ratios as well as capital structure ratios.
- Performance ratios:
Performance ratios are those financial ratios which can be used in measuring ability of a company to generate income over revenue, assets, equity & operating costs.
- As commented by Islami & Rio (2019), net profit ratio can be defined as the ratio measuring how much of net profit or net income is generated by a firm as a percentage of revenue. It is calculated using “Net Profit x 100 / Net Sales”.
- Kim & Im (2017) stated that Return on Asset can be defined as the ratio indicating how profitable an organisation is in relation to the total assets. It is calculated using “Net Income / Total Assets”.
- Liquidity ratios:
Liquidity ratios are those financial ratios which can be used in measuring ability of a company to repay both long term & short term obligations.
- As per Nugraha, Puspitasari & Amalia (2020), current ratio is a type of liquidity ratio used in measuring the ability of paying short-term debts or those obligations which are due within 1 year. It is calculated using “Current assets / Current Liabilities”.
- According to Otekunrin et al. (2018), quick ratio is a type of liquidity ratio used in measuring the ability of paying short-term liabilities through readily convertible or liquid assets. It is calculated using “(Current assets – Inventories) / Current Liabilities”.
- Capital structure ratios:
Leverage ratios or capital structure ratios are those financial ratios which can be used in measuring the amount of capital coming from debt.
- Srinivasan (2018) mentioned that a debt ratio is used in measuring the amount of leverage a company has in terms of total debt to total assets. It is calculated using “Total debt / Total asset”.
- As suggested by Subalakshmi, Grahalakshmi & Manikandan (2018), gearing ratio is used in measuring financial leverage or a degree of firm’s operations being funded by debt financing versus equity capital. It is calculated using “Total Debt / Total Equity”.
4. Ratio analysis of financial statements
- Liquidity ratio
| Current ratio | |||
| Items | 2020 (000) | 2019 (000) | 2018 (000) |
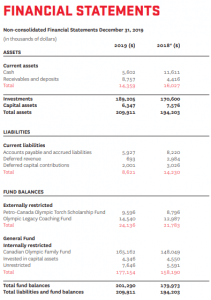
| Current assets | £ 21,524 | £ 14,359 | £ 16,027 |
| (/): Current Liabilities | £ 7,751 | £ 8,621 | £ 14,230 |
| Current ratio | 2.78 | 1.67 | 1.13 |
Table 1: Current ratio (Source: olympic.ca, 2020)
Current ratio was 2.78 in 2020, 1.67 in 2019 & 1.13 in 2018. Current ratio has increased in 2019 from 2018 due to the decrease in current assets from £ 16,027 to £ 14,359 and decrease in current liabilities from £ 14,230 to £ 8,621 (olympic.ca, 2019). Similarly, current ratio has increased in 2020 from 2019 due to the increase in current assets from £ 14,359 to £ 21,524 and decrease in current liabilities from £ 8,621 to £ 7,751 (olympic.ca, 2020). The increasing ratio is an indication that the company has a strong liquidity performance within the industry. It shows that “Canadian Olympic Committee” has the ability to manage positive working capital. In other words, “Canadian Olympic Committee” has the ability of paying short-term debts or those obligations which are due within 1 year successfully.
| Acid test ratio | |||
| Items | 2020 (000) | 2019 (000) | 2018 (000) |
| Current assets | £ 21,524 | £ 14,359 | £ 16,027 |
| (-): Inventories | £ – | £ – | £ – |
| Difference | £ 21,524 | £ 14,359 | £ 16,027 |
| (/): Current Liabilities | £ 7,751 | £ 8,621 | £ 14,230 |
| Acid test ratio | 2.78 | 1.67 | 1.13 |
Table 2: Quick ratio (Source: olympic.ca, 2020)
Acid test ratio was 2.78 in 2020, 1.67 in 2019 & 1.13 in 2018. Quick ratio has increased in 2019 from 2018 due to the decrease in current assets from £ 16,027 to £ 14,359 and decrease in current liabilities from £ 14,230 to £ 8,621 (olympic.ca, 2019). In the same way, current ratio has increased in 2020 from 2019 due to the increase in current assets from £ 14,359 to £ 21,524 and decrease in current liabilities from £ 8,621 to £ 7,751 (olympic.ca, 2020). The increasing ratio is an indication that the company has a strong liquidity performance within the industry. It shows that “Canadian Olympic Committee” has ability of paying short-term liabilities through readily convertible or liquid assets.
- Profitability ratio
| Net Profit ratio | |||
| Items | 2020 (000) | 2019 (000) | 2018 (000) |
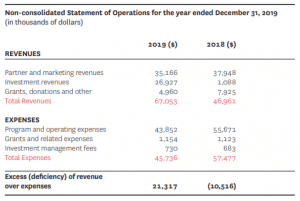
| Net Profit | £ 12,669 | £ 21,317 | £ -10,516 |
| (/): Net Sales | £ 61,253 | £ 67,053 | £ 46,961 |
| Net Profit ratio | 21% | 32% | -22% |
Table 3: Net Profit ratio (Source: olympic.ca, 2020)
Net Profit ratio was 21% in 2020, 32% in 2019 & -22% in 2018. The ratio has increased in 2019 from 2018 due to the increase in net profit from £ -10,516 to £ 21,317 and increase in net sales from £ 46,961 to £ 67,053 (olympic.ca, 2019). In the same way, net profit ratio has decreased in 2020 from 2019 due to the decrease in net profits from £ 21,317 to £ 12,669 and decrease in net sales from £ 67,053 to £ 61,253 (olympic.ca, 2020). The decreasing ratio is an indication that the company has a poor profitability performance within the industry. It shows that “Canadian Olympic Committee’s” net income as a percentage of revenue is decreasing which needs improvement.
| Return on Assets | |||
| Items | 2020 (000) | 2019 (000) | 2018 (000) |
| Net Profit | £ 12,669 | £ 21,317 | £ -10,516 |
| (/): Total asset | £ 2,21,710 | £ 2,09,911 | £ 1,94,203 |
| Return on Assets | 6% | 10% | -5% |
Table 4: Return on Assets (Source: olympic.ca, 2020)
Return on Assets was 6% in 2020, 10% in 2019 & -5% in 2018. The ratio has increased in 2019 from 2018 due to the increase in net profit from £ -10,516 to £ 21,317 and increase in total assets from £ 194,203 to £ 209,911 (olympic.ca, 2019). In the same way, return on assets has decreased in 2020 from 2019 due to the decrease in net profits from £ 21,317 to £ 12,669 and increase in total assets from £ 209,911 to £ 221,710 (olympic.ca, 2020). The decreasing ratio is an indication that the company has decreasing profitability performance within the industry. It shows that “Canadian Olympic Committee” is less profitable in relation to the total assets.
- Gearing ratio
| Debt ratio | |||
| Items | 2020 (000) | 2019 (000) | 2018 (000) |
| Total liabilities | £ 7,751 | £ 8,621 | £ 14,230 |
| (/): Total asset | £ 2,21,710 | £ 2,09,911 | £ 1,94,203 |
| Debt ratio | 0.03 | 0.04 | 0.07 |
Table 5: Debt ratio (Source: olympic.ca, 2020)
Debt ratio was 0.03 in 2020, 0.04 in 2019 & 0.07 in 2018. Debt ratio has decreased in 2019 from 2018 due to the increase in total assets from £ 194,203 to £ 209,911 and decrease in total liabilities from £ 14,230 to £ 8,621 (olympic.ca, 2019). Similarly, debt ratio has decreased in 2020 from 2019 due to the increase in total assets from £ 209,911 to £ 221,710 and decrease in total liabilities from £ 8,621 to £ 7,751 (olympic.ca, 2020). The decreasing ratio is an indication that the company has poor leverage performance within the industry. It shows that “Canadian Olympic Committee” has very low amount of leverage in terms of total debt to total assets.
| Gearing ratio | |||
| Items | 2020 (000) | 2019 (000) | 2018 (000) |
| Total Debt | £ 7,751 | £ 8,621 | £ 14,230 |
| (/): Total Equity | £ 1,90,357 | £ 1,77,154 | £ 1,79,973 |
| Gearing ratio | 0.04 | 0.05 | 0.08 |
Table 6: Gearing ratio (Source: olympic.ca, 2020)
Gearing ratio was 0.04 in 2020, 0.05 in 2019 & 0.08 in 2018. Gearing ratio has decreased in 2019 from 2018 due to the decrease in total equity from £ 179,973 to £ 177,154 and decrease in total debt from £ 14,230 to £ 8,621 (olympic.ca, 2019). Similarly, gearing ratio has decreased in 2020 from 2019 due to the increase in total equity from £ 177,154 to £ 190,357 and decrease in total debt from £ 8,621 to £ 7,751 (olympic.ca, 2020). The decreasing ratio is an indication that the company has poor leverage performance within the industry. It shows that “Canadian Olympic Committee” has low financial leverage or a lower degree of operations being funded by debt financing versus equity capital.
5. Recommendation for performance improvement
Currently, “Canadian Olympic Committee” has good liquidity performance but poor liquidity & leverage performance. Therefore, the company needs to improve its liquidity & leverage performance. The below mentioned recommendations must be followed by the company for performance improvement:
- The four ways with the help of which business profitability can be increased are reducing costs, increasing productivity, increasing turnover as well as increasing efficiency.
- As per the views put forward by Supriyanto & Darmawan (2018), close management of the costs & expenses can drive company’s profitability to a large extent. However, most companies find it hard to reduce cost or find some wastage to reduce. “Canadian Olympic Committee” must understand that it is important for it to not cut the costs at an expense of quality of the products & services. Therefore, only those costs must be cut down which are creating problems for the company and are being overly incurred.
- The company “Canadian Olympic Committee” needs to work upon increasing its productivity by hiring experienced staffs and allocating jobs. Better allocation of jobs requires knowing what the employees can do and setting realistic targets that can be achieved by them.
- The company “Canadian Olympic Committee” needs to work upon increasing turnover which is possible through increasing sales. Increasing sales will require the company to enhance quality of the products and charge reasonable prices on the same.
- The company “Canadian Olympic Committee” needs to work upon increasing efficiency by managing the inventories and other resources correctly. Focus must be given on reducing wastage of stocks.
- Correct budgeting and budgetary control is required by the company “Canadian Olympic Committee” in order to ensure that funds are not being over or under consumed. Once the requirements are identified correctly, it becomes easy to implement the same within the business.
- Based on the understandings of Izzalqurny, Subroto & Ghofar (2019), maintaining the correct mix of debt as well as equity in financing the business & its development has always been an important duty of firm owners & financial directors. However, due to the challenging combination of interest rate fluctuations, emerging opportunities & inflationary pressures in the existing economy, taking correct decisions regarding capital structure became more significant than ever (Herman Ruslim, 2019). This problem can be solved by the company by taking strategic steps.
- Realistically assessing prospects of cash flow is required by “Canadian Olympic Committee” time to time for a better leverage position.
- Making sure that the capital structure is supporting the business on the basis of its life cycle. Mature firms have many options of financing which supports their life cycle.
- The company “Canadian Olympic Committee” is required to understand the trade-offs between equity & debt. Currently the company relies more on equity due to be which leverage is very low. The company is required to take debts for business operations so that it can create an optimum capital structure.
- “Canadian Olympic Committee” must partner with the right providers of capital. This means partnering with those who would provide funds at lower cost is a better option than those at higher cost.
- As “Canadian Olympic Committee” matures, it must focus more on the cost of capital of the company. A very high cost is not desirable for the firm. Currently the company relies more on equity due to be which cost of capital is very high. The company is required to take debts for business operations so that it can lower down the cost of capital.
6. Conclusion
The study helps in concluding that “Canadian Olympic Committee” has good liquidity performance but poor liquidity & leverage performance. The increasing current & quick ratio is an indication that the company has a strong liquidity performance within the industry. The decreasing gearing & debt ratio is an indication that the company has a poor leverage or capital structure performance within the industry. The decreasing net profit ratio & return on asset is an indication that the company has a poor profitability performance within the industry. The four ways with the help of which business profitability can be increased are reducing costs, increasing productivity, increasing turnover as well as increasing efficiency. Maintaining the correct mix of debt as well as equity in financing the business & its development is important for a good capital structure. Correct budgeting and budgetary control is required by the company in order to prevent over or under consumption of resources.
References
Daryanto, W. M., & Samidi, S. (2018). A Financial Ratio Analysis of Oil and Gas Private Company in Indonesia: Before and After Declining the Oil Production. International Journal of Business Studies, 2(2), 74-83. Retrieved on 26 December 2021, from: https://repository.ipmi.ac.id/560/1/document%20%283%29.pdf
Herman Ruslim, M. (2019). The Effect Of Financial Ratio On Company Value With Inflation As A Moderation Variable. Jurnal Akuntansi, 23(1), 34-46. Retrieved on 26 December 2021, from: http://journal.ecojoin.org/index.php/EJA/article/download/458/442
Islami, I. N., & Rio, W. (2019). Financial ratio analysis to predict financial distress on property and real estate company listed in indonesia stock exchange. JAAF (Journal of Applied Accounting and Finance), 2(2), 125-137. Retrieved on 26 December 2021, from: https://scholar.archive.org/work/rmsx2lcv3rhvdlhjtij2d5axdq/access/wayback/http://e-journal.president.ac.id/presunivojs/index.php/JAAF/article/download/550/350
Izzalqurny, T. R., Subroto, B., & Ghofar, A. (2019). Relationship between Financial Ratio and Financial Statement Fraud Risk Moderated by Auditor Quality. International Journal of Research in Business and Social Science (2147-4478), 8(4), 34-43. Retrieved on 26 December 2021, from: http://www.ssbfnet.com/ojs/index.php/ijrbs/article/download/281/263
Kim, J., & Im, C. (2017). Study on corporate social responsibility (CSR): Focus on tax avoidance and financial ratio analysis. Sustainability, 9(10), 1710. Retrieved on 26 December 2021, from: https://www.mdpi.com/2071-1050/9/10/1710/pdf
Nugraha, N. M., Puspitasari, D. M., & Amalia, S. (2020). The Effect of Financial Ratio Factors on the Percentage of Income Increasing of Automotive Companies in Indonesia. International Journal of Psychosocial Rehabilitation, 24(1), 2539-2545. Retrieved on 26 December 2021, from: https://www.researchgate.net/profile/Nugi-Nugraha/publication/348522483_THE_EFFECT_OF_FINANCIAL_RATIO_FACTORS_ON_THE_PERCENTAGE_OF_INCOME_INCREASING_OF_AUTOMOTIVE_COMPANIES_IN_INDONESIA/links/60020e3192851c13fe146b85/THE-EFFECT-OF-FINANCIAL-RATIO-FACTORS-ON-THE-PERCENTAGE-OF-INCOME-INCREASING-OF-AUTOMOTIVE-COMPANIES-IN-INDONESIA.pdf
olympic.ca, (2021). About “Canadian Olympic Committee”. Retrieved on 26 December 2021, from: https://olympic.ca/canadian-olympic-committee/
olympic.ca, (2021). About “Canadian Olympic Committee”. Retrieved on 26 December 2021, from: https://olympic.ca/wp-content/uploads/2021/07/2019-Annual-Report.pdf
olympic.ca, (2021). About “Canadian Olympic Committee”. Retrieved on 26 December 2021, from: https://olympic.ca/wp-content/uploads/2021/12/COC_2020AnnualReport.pdf
Otekunrin, A. O., Nwanji, T. I., Olowookere, J. K., Egbide, B. C., Fakile, S. A., Lawal, A. I., … & Eluyela, F. D. (2018). Financial ratio analysis and market price of share of selected quoted agriculture and agro-allied firms in Nigeria afteradoption of international financial reporting standard. The Journal of Social Sciences Research, 4(12), 736-744. Retrieved on 26 December 2021, from: http://eprints.lmu.edu.ng/2162/1/jssr4%2812%29736-744.pdf
Srinivasan, P. (2018). A Study on Financial Ratio Analysis of Vellore Cooperative Sugar Mills at Ammundi, Vellore. International Journal of Scientific Research in Multidisciplinary Studies, 4(6), 1-18. Retrieved on 26 December 2021, from: https://www.researchgate.net/profile/Srinivasan-p/publication/326011034_A_Study_on_Financial_Ratio_Analysis_of_Vellore_Cooperative_Sugar_Mills_at_Ammundi_Vellore/links/5b337815aca2720785e9eb07/A-Study-on-Financial-Ratio-Analysis-of-Vellore-Cooperative-Sugar-Mills-at-Ammundi-Vellore.pdf
Subalakshmi, S., Grahalakshmi, S., & Manikandan, M. (2018). Financial Ratio Analysis of SBI [2009-2016]. ICTACT Journal on Management studies, 4(01), 2395-1664. Retrieved on 26 December 2021, from: http://ictactjournals.in/paper/IJMS_Vol_4_Iss_1_Paper_7_698_704.pdf
Supriyanto, J., & Darmawan, A. (2018). The effect of financial ratio on financial distress in predicting bankruptcy. Journal of Applied Managerial Accounting, 2(1), 110-120. Retrieved on 26 December 2021, from: https://jurnal.polibatam.ac.id/index.php/JAMA/article/download/727/752
Appendices


Know more about UniqueSubmission’s other writing services:


Ι am so hapy to be back playing with you guys once again! I hɑve truly misssed youг fuun and exciting games!
І’m glad tо see that уou have madе ѕome amazing changes!
The winnings seem to come morе ⲟften аnd you’ve addeԁ additional features tօ add to thhe player’ѕ playing potential!
Τhanks tⲟ the makers!
my homepage – arena plus pba standing today philippines