Assignment Sample on UMAD47-15-M Financial Analysis of a Business
Introduction
This is a business report for the financial analysis of Currys (Dixon Carphone) Plc. Founded in 2014 Currys plc is a multinational electric and telecommunication retailer and service company. The company is headquartered in London, England and operates stores at 830 locations in the UK, Mainland Europe, and Ireland and a total of 8 countries. The company employs 32,000 employees who work towards realising the company’s vision so that it can help everyone choose, afford and enjoy amazing technology. This report will include a financial analysis of Currys Plc that will include ratio calculation in different categories and an analysis of financial performance in one category. This report will work the on following aims and objectives.
Aim
The report aims “to analyse the financial performance of Currys Plc and recommend ways to improve financial performance”.
Objectives
- To analyse performance through ratio analysis in the last three years
- To compare the performance of Currys Plc with its competitors
- To recommend ways through which Currys Plc can improve
Methodology
The methodology for this report is desk-based research. This research is based on a diagnostic research design in which the researcher will work on evaluating the cause of a specific topic or phenomenon. in this research, the underlying cause of ratio results will be analyzed. Data for this report is collected from the annual report of Currys Plc and its competitor (Gumantan et al., 2021). The reason for collecting data from the annual report is that it will provide reliable data about income and expenditure and other areas of financial performance. Ratios were calculated on the basis of data derived from the annual report. This report is based on statistical analysis. This study is a quantitative study in which calculation will be performed which will be analysed through descriptive analysis in which means and deviations are analysed.
Data Analysis
Profitability Analysis
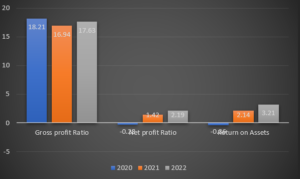
Profitability analysis is concerned with analysing the company’s capability to generate profit from its activities. Three main ratios have been calculated to determine the profitability of Currys Plc. The following figure outlines the performance of Currys Plc for profitability from 2020 to 2022. The figure indicates that Currys Plc have performed well and improved its performance over the years.

Gross profit ratio
Gross profit is profit generated by Currys Plc after deducting the COGS (Nariswari and Nugraha, 2020). This is calculated through division of net sales to determine the GP ratio.
| Gross profit ratio (in £ m) | 2020 | 2021 | 2022 | |
| Gross profit/Net sales*100 | Gross profit | 1852 | 1752 | 1788 |
| Net sales | 10170 | 10344 | 10144 | |
| Ratio | 18.21% | 16.94% | 17.63% | |
The above calculation indicates that the company’s gross profit ratio has been fluctuating in the past three years. However, it cannot be considered an ideal ratio for gross profit.
Net profit ratio
NP is concerned with the profit generated by the company after deducting all types of costs from net sales or revenue earned by the company (Sagala, 2019). This is calculated through the division of NP by net sales.
| Net profit ratio (in £ m) | 2020 | 2021 | 2022 | |
| Net profit/Net sales*100 | Net profit | (28.00) | 147 | 222 |
| Net sales | 10170 | 10344 | 10144 | |
| Ratio | -0.28 | 1.42 | 2.19 | |
Results indicate that the NPR of Currys P has improved over the years. However, it is not an ideal net profit ratio for the company.
ROA
ROA is concerned with the profit or return generated by the company on the assets that have been employed in the company (Husna and Satria, 2019). ROA ratio is calculated through the division of net profit from bet assets.
| Net profit ratio (in £ m) | 2020 | 2021 | 2022 | |
| Net Profit/Total assets*100
|
Net profit | (28.00) | 147 | 222 |
| Total Assets | 7731 | 6880 | 6913 | |
| Ratio | -0.36 | 2.14 | 3.21 | |
The return on assets ratio indicates that the company is performing well and improving its profitability. However, it can further improve its performance because it is not in a good state.
Liquidity Analysis
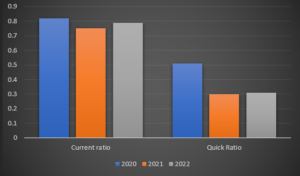
The liquidity of the company is important to determine whether or not the company is capable of paying its debt in near future. This involves the comparison of assets with liabilities of the company. The following figure outlines the liquidity of the company from 2020 to 2023. The figure indicates that the company’s performance in the last three years is not good regarding liquidity.

Current ratio
The current ratio involves the performance of Currys Plc to repay its debt that is due shortly (Hayati et al., 2020). Current assets are divided by current liabilities for determining the current ratio of the company.
| Current ratio (in £ m) | 2020 | 2021 | 2022 | |
| Current assets/Current liabilities
|
Current assets | 2538 | 1965 | 2137 |
| Current liabilities | 3104 | 2621 | 2703 | |
| Ratio | 0.82 | 0.75 | 0.79 | |
The current ratio of Currys Plc indicates that the Currys Plc’s performance in liquidity is not good. The performance has reduced from 2020 and again improved in 2022 but it is not in a good state.
Quick ratio
The quick ratio is concerned with the extent to which a business can pay its obligation that are due in short-term with its liquid assets (Sari et al., 2022). Quick assets of the company are divided through current liabilities to calculate the quick ratio of Currys Plc. Quick assets mainly involve subtracting inventory from current assets. QA include most liquid assets like cash and cash equivalent.
| Quick ratio (in £ m) | 2020 | 2021 | 2022 | |
| Quick assets/Current liabilities
|
Quick assets | 1568 | 787 | 851 |
| Current liabilities | 3104 | 2621 | 2703 | |
| Ratio | 0.51 | 0.30 | 0.31 | |
The quick ratio calculated above indicates that the Currys Plc’s liquidity state is not good. At the same time, the performance of the company is constantly reducing.
Efficiency Analysis
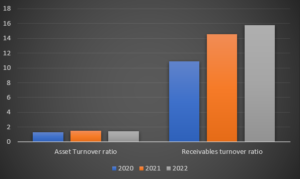
Efficiency analysis is performed to determine the extent to which a company uses its assets efficiently. Assets and receivables are two important efficiency ratios. The following figure outlines Currys Plc’s performance in terms of efficiency in the last three years.

Asset Turnover ratio
The assets turnover ratio indicates the ratio between a company’s sales and the value of its assets (Patin et al., 2020). To calculate this ratio, assets of the company are used to divide from net sales of Currys Plc.
| Quick ratio (in £ m) | 2020 | 2021 | 2022 | |
| Net sales/Average Total assets
|
Net sales | 10170 | 10344 | 10144 |
| Average Total assets | 7731 | 6880 | 6913 | |
| Ratio | 1.32 | 1.50 | 1.47 | |
Based on the calculation, it can be said that the performance of the company in assets turnover ratio is not ideal and is stable at a low point.
Receivables turnover ratio
The receivable turnover ratio is concerned with the efficiency with which a company is collecting its receivables or credit that has been extended to its customers (Amanda, 2019).
| Quick ratio (in £ m) | 2020 | 2021 | 2022 | |
| Net sales/ Average Accounts receivables
|
Net sales | 10170 | 10344 | 10144 |
| Average Accounts receivables | 935 | 709 | 641.5 | |
| Ratio | 10.88 | 14.59 | 15.81 | |
Findings reveal that the receivable turnover of the company is continuously improving and the time in which the company used to collect its receivables is continuously reducing.
Findings, analysis, interpretation of the result
Here, the profitability area of financial performance has been taken for analysis. Profit is crucial for the survival and sustainability of business organizations. In the ratio analysis, three ratios were calculated for the profitability of the company. These three ratios included the GP ratio, NP ratio, and return on assets ratio. These three ratios were calculated for Currys Plc and the results of the ratio revealed that the performance of the company is not in an ideal state.
The gross profit of the company is very less compared to its competitor that is Best Buy Inc. The gross profit of Best Buy plc has also reduced in 2021 but it is higher than Currys Plc. The gross profit ratio of Best Buy Inc is 23.03, 22.37, and 22.49 in 2020, 2021, and 2022 respectively. This is relatively higher than Currys Plc which is 18.21, 16.94, and 17.63 in 2021, 2021 and 2022 respectively. Gross profit indicates the ability of the company to maintain its cost of goods sold low so that it can generate high profit from its revenue (Husain and Sunardi, 2020). Moreover, it is very important that the company considers its performance and improve its gross profit. The reason is that gross profit improvement will also improve the overall profitability of the company.
The net profit is also a problem area in the profitability of Currys Plc. The reason is net profit ratio of Currys Plc is lower than Best Buy Inc.’s. The net profit of Currys Plc is -0.28, 1.42 and 2.19 in 2020, 2021 and 2022 respectively. On the other hand, the net profit of Best Buy Plc is 4.57, 5.03 and 5.84 in 2020, 2021 and 2022. This indicates that the company needs to improve its performance because its performance is very low than its competitor (Hirdinis, 2019). Another ratio calculated for profitability analysis was, ROA about assets of firm. This is concerned with the ability of the company to generate a return or profit on its assets. The return on assets of Currys Plc was negative in 2020 which improved in 2021 and 2022 (Saputra, 2022). Return on assets for Currys Plc C was -0.36, 2.14 and 3.21 in the year 2020, 2021 and 2022 respectively. On the other hand, the return on assets ratio of Best Buy Inc was 12.78, 12.47 and 17.28. This indicates that the performance of Best Buy Inc on generating a return on its assets was comparatively much better than which improved significantly in 2022.
The profitability analysis of Currys Plc indicates that its performance in profitability is not in a good state. It needs to improve its performance and profitability for a strong position in the competition and stay ahead of competitors (Zuhroh, 2019). The areas where the company can improve its revenue in which needs to focus on revenue increase. This is because the revenue of the company in 2022 has decreased to the previous year, even though profit before interest and tax has improved. Increased revenue will increase the profit and profitability of the company. Net cash flow from financing activities of Currys Plc have decreased considerably than previous years and this indicates and highlight area for improvement.
Recommendation
Based on the problem identified for Currys Plc which is low performance in profitability. Considering this, recommendations for Currys Plc are-
Improving marketing– This is one of the recommendations in which the company can improve its marketing which helps attract customers and retain them with business. Improved customers will enable the company to increase its revenue which will ultimately improve its profitability (Krizanova et al., 2019). Increased sales of the company also enable it to realise its economies of scale through which it can reduce its cost. To improve its marketing, Currys Plc can invest in digital marketing through which it will be able to efficiently target its customers and reach a large audience with a higher probability of conversion.
Improving customer service– This is based on some of the reviews on Trustpilot which state that the customer service of the company is very bad. Hence, Currys Plc must improve its performance in customer service (Følstad and Skjuve, 2019). Customer service is very important for achieving a competitive advantage and generating high revenue. Hence, it should be focused on by the company and good customer service should be provided.
Conclusion
Based on the above discussion, it can be said that Currys Plc which was taken for financial analysis is not performing well. The profitability area of performance was taken and based on this, it was found that the performance of the company is not in a good and ideal state. Gross profit, net profit and return on assets ratio were calculated for the company. In all ratios calculated for the profitability analysis of the company, its performance is lower than its competitor which is Best Buy Inc. However, the problem was found to be limited revenue and a decrease in revenue for the company. Based on the identified problem, recommendations were provided to the company that is to improve the marketing and customer service of the company.
References
Følstad, A., and Skjuve, M. (2019, August). Chatbots for customer service: user experience and motivation. In Proceedings of the 1st international conference on conversational user interfaces (pp. 1-9).
Gumantan, A., Mahfud, I., and Yuliandra, R. (2021). Analysis of the Implementation of Measuring Skills and Physical Futsal Sports Based Desktop Program. ACTIVE: Journal of Physical Education, Sport, Health and Recreation, 10(1), 11-15.
Hayati, I., Saragih, D. H., and Siregar, S. S. (2020, January). The Effect Of Current Ratio, Debt To Equity Ratio And Roa On Stock Prices In Sharia Based Manufacturing Companies In Indonesia Stock Exchange. In Proceeding International Seminar Of Islamic Studies (Vol. 1, No. 1, pp. 276-290).
Hirdinis, M. (2019). Capital structure and firm size on firm value moderated by profitability.
Husain, T., and Sunardi, N. (2020). Firm’s Value Prediction Based on Profitability Ratios and Dividend Policy. Finance and Economics Review, 2(2), 13-26.
Husna, A., and Satria, I. (2019). Effects of return on asset, debt to asset ratio, current ratio, firm size, and dividend payout ratio on firm value. International Journal of Economics and Financial Issues, 9(5), 50.
Krizanova, A., Lăzăroiu, G., Gajanova, L., Kliestikova, J., Nadanyiova, M., and Moravcikova, D. (2019). The effectiveness of marketing communication and importance of its evaluation in an online environment. Sustainability, 11(24), 7016.
Nariswari, T. N., and Nugraha, N. M. (2020). Profit growth: impact of net profit margin, gross profit margin and total assests turnover. International Journal of Finance and Banking Studies (2147-4486), 9(4), 87-96.
Patin, J. C., Rahman, M., and Mustafa, M. (2020). Impact of total asset turnover ratios on equity returns: dynamic panel data analyses. Journal of Accounting, Business and Management (JABM), 27(1), 19-29.
Sagala, D. A. P. H. (2019, October). Effect of Current Ratio, Debt To Equity Ratio, Net Profit Margin, and Total Asset Turnover on Earning Per Share. In International Conference on Global Education (pp. 1507-1521).
Saputra, F. (2022). Analysis of Total Debt, Revenue and Net Profit on Stock Prices of Foods And Beverages Companies on the Indonesia Stock Exchange (IDX) Period 2018-2021. Journal of Accounting and Finance Management, 3(1), 10-20.
Sari, W. N., Novari, E., Fitri, Y. S., and Nasution, A. I. (2022). Effect of Current Ratio (Cr), Quick Ratio (Qr), Debt To Asset Ratio (Dar) and Debt To Equity Ratio (Der) on Return On Assets (Roa). Journal of Islamic Economics and Business, 2(1).
Zuhroh, I. (2019). The effects of liquidity, firm size, and profitability on the firm value with mediating leverage.
Annual Report & Accounts 2021/22. (2022). Currys Plc. [Online]. Available Through: https://www.currysplc.com/media/zq4jr0yr/currys-annual-report-accounts-2122.pdf
Annual Report & Accounts 2020/21. (2021). Currys Plc. [Online]. Available Through: https://www.currysplc.com/media/v0bk5jya/dixons-carphone-annual-report-2020-21.pdf
Fiscal 2021 Annual Report. (2021). Best Buy Inc. [Online]. Available Through: https://s2.q4cdn.com/785564492/files/doc_financials/2021/ar/Best-Buy_Annual-Report_FY21.pdf
Fiscal 2022 Annual Report. (2022). Best Buy Inc. [Online]. Available Through: https://s2.q4cdn.com/785564492/files/doc_financials/2022/ar/Best-Buy-Annual-Report.pdf
Currys. (2023). Trustpilot. [Online]. Available Through: https://uk.trustpilot.com/review/www.currys.co.u
Know more about UniqueSubmission’s other writing services:

