107SAM Assignment Sample – Business and Management Statistics 2022
TASK 1
Overview
The main objective of this report is to present the estimation based on students and university. This project has been a work from Coventry University which aims in finding out the attributes and factors regarding the background of the survey (Aiello and Bonanno, 2016).
The survey report aims to define a relationship between university students and their time taking process for reaching the university. The survey aims in finding out the time a student takes to reach the university by keeping in mind the several factors like age, disability, perks of mobility, domicile, and location to present a correct structure in the survey. In the survey, 150 students would be surveyed based on several factors. Their response would be recorded with their factors of the university and personal information. This is a large sample size report which aims to influence the people for their time assessment while travelling.
Assessment of Survey Report
Survey data which are accumulated to present the guidance and factors to the students contain all the attributes regarding the university basis which includes the factors like age, disability, perks of mobility, domicile, and location (Chervin et al., 2017). These factors would help in ascertaining a model which would make the influence over the educational background and qualifications of the students. A forecast model is considered a model which is used to predict the advances and changes that might take place in the system (Esfe et al., 2016).

This model would be used to attain attributes regarding the survey and would create out the commutation process conveyed in Coventry University. The factors consist of 14 attributes in the system for surveying based on the age brackets and bring out the result on the travelling time. These fourteen attributes would create structure-forming categories which would analyse the basic system of the survey and would help in determining the results.
Among the several categories, “Category A” is the first category of the survey which includes the age bracket of students within 18-19 years which is a study for entry-level students. “Category B” consists of the students whose age range from 20-21 and bring out the middle level of a university. For the “Category C”, the ranging age has been presented above 21.
| CATEGORY A | 18-19 | 3407 mins (93 students) |
| CATEGORY B | 20-21 | – |
| CATEGORY C | ABOVE 21 | 518 mins (13 students) |
The above table has been segregated to understand the categories and their time taking process in the influence of students and universities (Cuiz and Gong, 2019). From the Category A and Category C, the connection has been presented by forming the difference of minutes which is 3407 minutes of 93 students in A and 518 minutes taken by 13 students in Category B. This ascertains that the time taken by the students according to their specific categories present the identification bracket of an average 33.58 minutes in the process, while the commutation time of the several other brackets is constant in calculating the other specific process (Al-Gahtani and Mohan, 2005).
There are brackets which form in 20-21 age presenting the value of 38.07 minutes with proper balance. This ascertains a direct relationship between the two brackets presenting time to travel support in the categories presented in the survey (Darlington and Hayes, 2016). Also, presenting the views of several commuting time, it has been established that the gradual increase has been ascertained in the survey (Gwon et al., 2020). It has been assumed that the time to travel through university and home presents a gender factor too.
Another factor is assumed to be taken as the domicile of the students as they are coming from several international origins. Having to find the international origin with the place differs the categories above and joins in surveying the data. First category A under the domicile representation of the students consists of the students who are from the UK. Category B consists of the students from the European Union which are assessed after the Category A.
The last category which is Category C represents the students of international basis continuing from a university abroad. After the survey being conducted based on the domicile of the students, it has been developed that the details for together to make a channel of international origin (Bel and Warner, 2016). The duration of time taken on the students based on domicile is 39 minutes on average which suggests the measures for international students.
Conclusion
From the survey, the findings based on age and domicile has helped in determining the time taking process to university. Students from UK and EU generally take less time in reaching in compare to the international students and on another hand, students with age bracket low are more eager to reach fact than the students of older age.
TASK 2
Introduction
Regression analysis refers to the statistical method which is used in stats to bring out the plotting of the respective survey and find out the relationship between the two variables. From the university guides, it has been seen that the accommodation to Coventry University has helped in providing a correct attribute to the variables. Through the regression analysis, the data would be estimated with the predicting power of the concrete connection based on the investigation being performed in the university students.
It has been seen that the attributes are willing to create a relational data structure to form the outputs within the data power and social outcome policies (Sireesha and Shankar, 2010). With the following structure, the regression analysis would be presumed and commented on the required dependence on each other. This helps in building a relationship between timing and generating outcomes. A discussion based on the attributes would follow up the structure.
Discussion
Using Excel Sheet, the regression chart has been made and predicted the outcome of the number of hours where the students worked as a part-time manner with the time travel to university (Hayter et al., 2020). In the excel sheet, the required chart has been presented by creating the dependent variable estimated with the structural function of the university’s management. In the regression analysis, it has been established that to make a linear regression line, the dependent value is ascertained with the work in which the time has been consumed.
This variable meets the other end of the variable to present the goal for linear regression analysis (Horton and Fitzmaurice, 2004). This analysis is a structural formula and a mathematical model which helps in forming several values in the co-existence of other variables. With the uses of this model in this analysis, the dependent value “X” is predicted from the basic calculations (Harrison and Lock, 2004). Using the regression equations and applying the methods to find X is estimated to predict the data.
The data have been attached with the Excel Sheet, to provide the relationship based on the variances. This would aim to define the relationship between two variables which are the time taking factors to university and the time taken to work part-time analysis. The graph has been plotted estimating the required time taken within the regression equation.
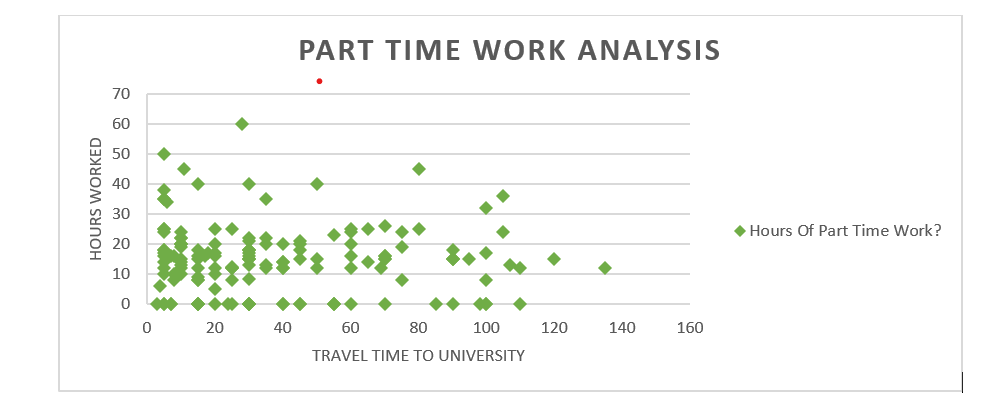
In the graph, the given scatter plot defines the regression functions which initiate the data based on the dependent value. An outcome is presented with the correlation of the statistical tool to estimate the creating work within the data points (Heagney, 2016). From the graph, it is ascertained that the regression values display a strong dependence on the correlation structure. This statistical tool has made in featuring the sample survey with a strong correlation and natural, regression lines through plotting within the graph (Bel and Warner, 2016).
The identification of the connection between the two variables has ascertained the dependence which creates a highlighting pattern in the survey. These patterns are made available in the graph to understand the high dependence of these factors clearly (Sergi et al., 2019). The scatter plot work has been created in the graph by plotting the university time taken process in the horizontal side and the part-time hours worked on the vertical side. Using the plotting performance in the graphs, it has been established that the vertical line represents the trend line variables and initiate to form a relationship with the several variables.
The regression analysis has helped in submitting the regression equation which presents the time taken to travel to the university board and the average time of work in several weeks. The outcome of regression equations has helped in forming the dependent variables estimated with the independent variables (Soe and Hirke, 2018). The regression equation has formed the data line and has made the points according to the dependency formed with the survey.
The prediction is notably correct as it helped in analysing the average line between the variables (Cui and Gong, 2018). Regression equations have a strong feature in estimating the predictions which help in averaging all the progressions and consumed work in the analysis (Montogomery et al., 2012). With the indications of the spotting and scattering plots, the regression equation developed between the variables are given below:

From the given equation, it is ascertained that the dependence between both the variables is true and effective to its sides. In the equation, Y represents the dependent variables which are reflected by the outcome generated from X. Through the variables, the points generated the scatter plot program which is installed with the total estimated value from X and Y.
It helps in generating the residual value which helps in calculating the gap ascertained between a line and a point. From the analysis, it is ascertained that the predicted point is based on the vertical distance which depends on the actual data point in the chart. This is based out of a simple regression survey analysis which helps in forming the sample survey chart during the productivity measures. Also, the duration of hours helps in determining the slope of the graph.
Slope Intercept
It is assumed that if the given hours for work is increased by 1 hour in the working adaptability system of the university, it is ascertained that the travel time would increase by 0.0218 which is a specific outcome for the specific solutions (Sergi et al., 2019). It has been ordered through the travel time which is fit for the estimation with correlation programme. Given slope has been estimated to bring the like highlights from several units and creates changes as per the makers of the independent variable. The unit is assessed to highlight the correlation function.
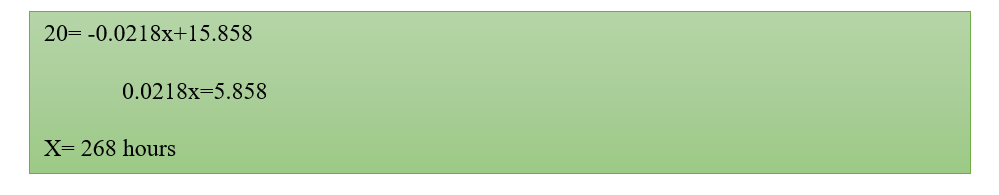
The given data inside the descend into the sin of y on x, we will study the hours of your time worked by understudies at express school. Put the estimation of 1 variable can bolster inside the estimation of the contrary factor finds out of y on x. On the off chance that the time spent on the improvement the school is around quarter-hour, by then putt the motivation in the condition, this surmises once the time taken to set out to all parts of the school is around fifteen minutes that on associate degree common that student work an enormous bit of an ideal open entryway for around thirty-nine hours all through

This condition helps inside the ward or the variable as a whole. If the time taken inside the advancement excursion to the school is around twenty minutes, by then putting the impetus inside the condition, this accumulates once the time taken to set out to all parts of the school is around twenty minutes that on a recommend that student word for around 268 hours all through the supreme week.
The qualities chose inside the total’s insights at the possible unimportance of the fall away from the faith model to chart and measure the association (Kott, 2007). The components inside the unequivocal lose the faith model and might be named to be not quantifiably critical considering the way that it shows a lower relationship between the hours worked in a very week.
The descend into sin model contains variable total that zone unit truly immaterial and conjointly show a pleasantly lower R-squared cost (Hayter et al., 2020). The applied math centrality shows the relative changes inside the self-ruling segments that partner with shifts inside the helpless cost. an authentic R-squared cost derives that the model presented clarifies a genuine and essential level of the variability or changes inside the variable total.
TASK 3
Introduction
Overall duration is the estimation which predicts the future basis programs and ascertains the proposed changes in the environment. The activities through several dependencies allow a graphical representation which forms the optimal path for the activities moved into certain changes (Lock, 2014). From several estimations, the approach would be defined with statistical advancements and theories. Scheduling the consequences with each activity, the critical path would be made with the help of a network diagram. The diagram would bring the timely movement of the activities for the stated period.
Discussion
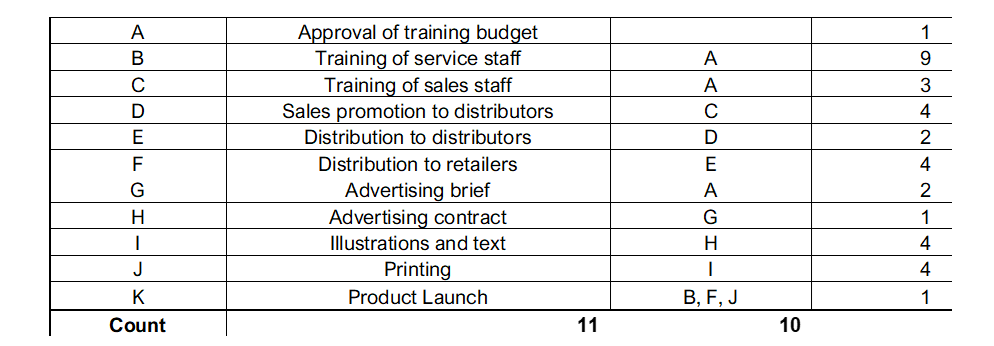
The system chart which is readied utilising the information from the table has been used to perceive the best fundamental course for the specific task (Seber and Lee, 2012). The table gives a quick overview of 11 intriguing exercises which are to be done in the whole undertaking. These exercises have a reliance on the past turn of events, for example, the going with movement must begin once the past action or the depending action have been finished.
These exercises in like way have another time run in the week for express exercises to be finished. These exercises will thusly help in giving the best and the base time taken to finish the general various exercises of the undertaking. The undertaking here contains a dispatch of express things whose earlier exercises have been clarified with their pertinent period to look for an awareness of the general time which is required to dispatch the thing in the market (Reiss, 2013). Utilising the table above for the improvement of system design for the dispatch of the thing can be drawn, where the entire of the exercises has been swaggered in a graphical way referenced in list 1.
The Precedence chart strategy gets undeniable advancement which is the forward pass figuring and the retrogressive pass estimation close by skim (Kvalhein, 2020). The advances pass check species and feature the base timespan where the entirety of the exercises can be suitably performed, and it proposes the base term of the undertaking.
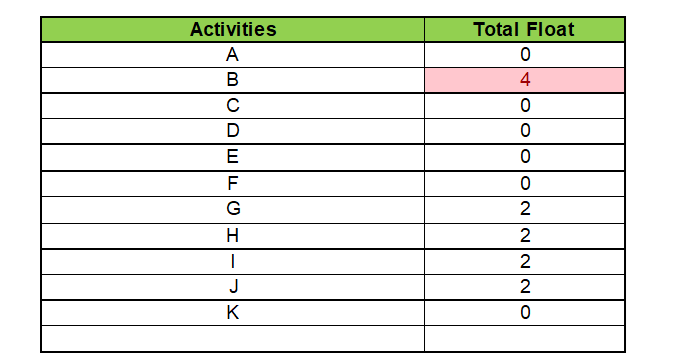
The retrogressive pass estimation everything considered picks the most recent period by which every improvement should be possible without broadening the general least range (Schroeder et al., 2016). The buoy is the extent of time that an improvement can be yielded without conceding the task rivalry at a fated date.
The ES or the Early Start in addendum 2 aides on the ID of the base time in which an undertaking can be imparted while LS tends to the powerless start through the process. In our figuring of the system graph, enabling beginning number is for the help with thankfulness is made at the upper left corner of the action box, and early completion is introduced on the upper right corner.
Powerless Start and the late perfection displays the most recent time a specific improvement on a system way can begin and finish. Thusly Late beginning number or the LS is made at the base left corner of various actions and late completing on the base right corner. The rigid buoy is the extent of time in weeks in this specific case is an improvement can be surrendered without influencing the end date of the task.
The fundamental course is with everything considered a strategy of the exercises in a specific undertaking which is done inside the time length for a challenge to finish inside the conveyed due date. Any improvement on the essential way cannot begin until when its past movement is done, on the off chance that action is late by multi-week, by then the entire undertaking will understand a deferral of the multi-week (Masamha et al., 2017).
A solid start in the undertaking when included with the length of a movement results into the early wrapping up. At the same time, late climax when deducted from the term registers a defenceless start. After the estimation of the early starts and powerless starting near to the inside and out buoy, we can work out to locate the major course through the system chart.
The fundamental way for the concerned undertaking, for example, the task of experience dispatch can be reviewed utilising the best and the base time wherein the undertaking should be possible (Plonsku and Ghanbar, 2018). The supreme range for the above undertaking is that experience which has a general way of deduction to dispatch the thing and it contains various exercises which the affiliation needs to pick up in a sequential sales to guarantee ideal finishing of every action (Naveed and Iqbal, 2016).
The system diagram help in the foundation of the basic way which will by then help with the least time in which the undertaking is finished. Following the fundamental way in the specific task, the base time where the undertaking should be possible is 15 weeks. These affirmations that all the exercises have been done an ideal stage with a statement of the general estimation of various exercises.
Conclusion
From the several possible analyses, the table and the solutions predict that the undertaking for the completion of activities would be finished within 15 weeks. This total float segment suggests the time in the form of preceding activity to ensure a better critical path. Several products are estimated to create within the time frame by launching it through several dependences of computing the results.
Reference List
Aiello, F. and Bonanno, G., (2016). Efficiency in banking: a meta-regression analysis. InternatIonal revIew of applIed economIcs, 30(1), pp.112-149. 10. Sajad, M., Sadiq, M.,
Al-Gahtani, K.S. and Mohan, S.B. (2005). Total float management for delay analysis. AACE International Transactions, p.CD161.
Bel, G. and Warner, M.E., (2016). Factors explaining inter-municipal cooperation in service delivery: a meta-regression analysis. Journal of Economic Policy Reform, 19(2), pp.91-115.
Chervin, J., Perio, P., Martins-Froment, N., Pharkeovilay, C., Reybier, K., Nepveu, F., Fabre, N., Talou, T., Bonzon-Ponnet, V. and Marti, G., (2017). Dereplication of natural products from complex extracts by regression analysis and molecular networking: case study of redox-active compounds from Viola alba subsp. dehnhardtii. Metabolomics, 13(8), p.96.
Cui, Z. and Gong, G., (2018). The effect of machine learning regression algorithms and sample size on individualized behavioral prediction with functional connectivity features. Neuroimage, 178, pp.622-637.
Darlington, R.B. and Hayes, A.F., (2016). Regression analysis and linear models: Concepts, applications, and implementation. Guilford Publications.
Esfe, M.H., Yan, W.M., Afrand, M., Sarraf, M., Toghraie, D. and Dahari, M., (2016). Estimation of thermal conductivity of Al2O3/water (40%)–ethylene glycol (60%) by artificial neural network and correlation using experimental data. International Communications in Heat and Mass Transfer, 74, pp.125-128.
Fedorov, V.M., Grebennikov, P.B. and Frolov, D.M., (2020). Russian Arctic seas, sea ice extent, annual, interannual and long-term variation, insolation, insolation contrast, correlation and regression analysis. Evaluation, 24(3), pp.38-50.
Gwon, J.S., Toh, G.M., Kim, W.S. and Park, J.H., Industry Univeristy Cooperation Foundation Hanyang University, Hyundai Motor Co and Kia Motors Corp, (2020). Method for predicting clamp force using convolutional neutral network method. U.S. Patent Application 16/691,308.
Harrison, F.L. and Lock, D, (2004). Advanced project management: a structured approach. Gower Publishing, Ltd.
Hayter, C.S., Rasmussen, E. and Rooksby, J.H., (2020). Beyond formal university technology transfer: Innovative pathways for knowledge exchange. The Journal of Technology Transfer, 45(1), pp.1-8. 13.
Heagney, J. (2016). Fundamentals of project management. Vancouver: Amacom.
Heeringa, S.G., West, B.T. and Berglund, P.A., (2017). Applied survey data analysis.Boka Raton: CRC press.
Horton, N.J. and Fitzmaurice, G.M. (2004). Regression analysis of multiple source and multiple informant data from complex survey samples. Statistics in medicine, 23(18), pp.2911-2933.
Kott, P.S.(2007). A model-based look at linear regression with survey data. The american statistician, 45(2), pp.107-112.
Kvalheim, O.M., (2020). Variable importance: Comparison of selectivity ratio and significance multivariate correlation for interpretation of latent‐variable regression models. Journal of Chemometrics, 34(4), p.e3211.
Lock, M.D. (2014). The essentials of project management. London: Ashgate Publishing, Ltd.
Masamha, T., Mnkandla, E. and Jaison, A., (2017), September. Logistic regression analysis of information communication technology projects’ critical success factors: A focus on computer networking projects. In 2017 IEEE AFRICON (pp. 963-967). IEEE.
Montgomery, D.C., Peck, E.A. and Vining, G.G., (2012). Introduction to linear regression analysis (Vol. 821). New Jersey: John Wiley & Sons.
Naveed, K. and Iqbal, M.S., (2016). Software Project Management: Tools assessment, Comparison and suggestions for future development. International Journal of Computer Science and Network Security (IJCSNS), 16(1), p.31.
Plonsky, L. and Ghanbar, H., (2018). Multiple regression in L2 research: A methodological synthesis and guide to interpreting R2 values. The Modern Language Journal, 102(4), pp.713-731.
Reiss, G., (2013). Project management demystified: Today’s tools and techniques. Abingdon: Routledge.
Schroeder, L.D., Sjoquist, D.L. and Stephan, P.E., (2016). Understanding regression analysis: An introductory guide (Vol. 57). Sage Publications.
Schwalbe, K.(2015). Information technology project management. Bsoton: Cengage Learning.
Seber, G.A. and Lee, A.J., (2012). Linear regression analysis (Vol. 329). New Jersey: John Wiley & Sons.
Sergi, B.S., Popkova, E.G., Bogoviz, A.V. and Litvinova, T.N. eds., (2019). Understanding Industry 4.0: AI, the Internet of Things, and the Future of Work. Emerald Group Publishing.
Sireesha, V. and Shankar, N.R., (2010). A new approach to find total float time and critical path in a fuzzy project network. International Journal of Engineering science and technology, 2(4), pp.600-609.
Soe, P.H. and Htike, T.M. (2018). Critical path analysis programming method without network diagram. In MATEC Web of Conferences (Vol. 192). EDP Sciences.
Sperka, L. and Enright, E., (2019). Network ethnography applied: Understanding the evolving health and physical education knowledge landscape. Sport, Education and Society, 24(2), pp.168-181.
Know more about UniqueSubmission’s other writing services:
