
7211AFE – Corporate Finance
Executive Summary
The purpose of this report is to provide a financial and risk analysis of BHP group limited that is an Australian mining material company. This company was established in 1885 and it provides the product and services in the overall world.

Andrew Mackenzie is CEO of BHP, who takes the support of 10 other independent or non- independent executive directors. This study provides the corporate governances of BHP with including financial market consideration and Corporate Social Responsibilities.
Moreover, the risk and return policy, earnings and cash flows, Financing Sources and dividend policy of the company are defined the study that perfectly represents the financial and risk analysis for BHP.
BHP Group Ltd is also known as BHP, BHP Billiton and BHP Group plc that is an Anglo-Australian multinational mining company. BHP was founded in 1885 at Broken Hill in New South Wales,
Australia but now it is headquartered in Melbourne. In 2017, BHP became the largest mining company on the basis of market capitalization and third largest company of Melbourne as per revenue (BHP Group ltd, 2019).
The below table is showing general information for BHP for the most recent financial results (FY18):
| Company | BHP Billiton |
| Origin Country | Australia |
| Establishment Year | 1885 |
| Sector | Basic Materials |
| Service | Industrial Metals & Minerals |
| Listing | ASX |
| ASX Code | BHP |
| Reporting Currency | US dollar |
| Revenue | $43.6 billion |
| EBIT | $23.2 billion |
| NPAT | $4.8 billion |
2.1 CEO (Chief Executive Officer)
The CEO and Managing Director of BHP is Mr. Andrew Mackenzie that was appointed as chief executive of non-ferrous in November 2008. On 10 May 2013, Mackenzie succeeded Marius Kloppers as the CEO of BHP Billiton.
He has experienced more than 30 years in oil and gas, minerals, over long-term cycles, global markets, technology, commodity value chains, and public policy.
There are 11 directors in the board team of BHP, where 8 directors are Independent Non-Executive Directions that are elected by shareholders.
In addition, a non-independent director is a CEO (Andrew Mackenzie), a Senior Independent Director (Shriti Vadera) and Group Company Secretary and Chairman of the Disclosure Committee (Margaret Taylor) are also included in the board of directors.
| Name | Appointment | Directorship | Remuneration (USD yearly) |
| Kenneth MacKenzie | 2017 | Independent Non-Executive Chairman of the Board | 826,000 |
| Andrew Mackenzie | 2013 | Chief Executive Officer, Executive Director | 8,106,000 |
| Peter Beaven | 2014 | Chief Financial Officer | 4,327,000 |
| Mike Henry | 2016 | President – Operations, Minerals Australia | 4,627,000 |
| Daniel Malchuk | 2016 | President – Operations, Minerals Americas | 4,332,000 |
| Steve Pastor | 2016 | President – Operations Petroleum | 3,560,000 |
| Laura Tyler | 2018 | Asset President Olympic Dam | |
| Diane Jurgens | 2016 | Chief Technology Officer | |
| Arnoud Balhuizen | 2017 | Chief Commercial Officer | |
| Geoff Healy | 2016 | Chief External Affairs Officer | 3,837,000 |
| Athalie Williams | 2015 | Chief People Officer | 2,522,000 |
| Rachel Agnew | 2014 | Company Secretary | |
| Caroline Cox | 2019 | Company Secretary | |
| Terence Bowen | 2017 | Independent Non-Executive Director | 179,000 |
| Malcolm Broomhead | 2010 | Independent Non-Executive Director | 244,000 |
| Ian Cockerill | 2019 | Independent Non-Executive Director | |
| Anita Frew | 2015 | Non-Executive Independent Director | 264,000 |
| Carolyn Hewson | 2010 | Independent Non-Executive Director | 237,000 |
| Susan Kilsby | 2019 | Independent Non-Executive Director | |
| Lindsay Maxsted | 2011 | Independent Non-Executive Director | 267,000 |
| John Mogford | 2017 | Independent Non-Executive Director | 198,000 |
| Shriti Vadera | 2015 | Senior Independent Non-Executive Director | 298,000 |
2.3 Financial Market Considerations
Financial market interactions of BHP are shown in the below Figure:
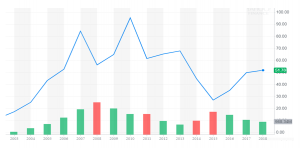
Figure: Share Price and Trading Volume (Jan 2003 – Dec 2018)
As per the above figure, it is identified that BHP has the highest share price in June 2010 with 95.42 and trading volume was 905.87 million. Currently, the share price 51.78 and trading volume is 568.34 million. In 2015, there was a higher recession due to this, the share price was reduced at 26.97 and trading volume was 1 billion.
The below figure is providing a comparison with movements in the Index of Dow Jones Industrial Average:
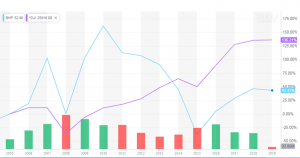
Figure: Interaction with ASX All Ordinaries Markets (Jan 2005 – May 2019)
The above figure is representing the composition between the stock price of BHP and DOW. In this, it is defined that BHP was having a higher share price than DOW before Jan 2014 but now it has very less.
Currently, BHP has 43.47% value of share price but DOW has 136.21% that is competitively much high.
2.4 Corporate Social Responsibility
The strategy of BHP provides long-life to assets means because it thinks and plans as corporate social responsibility. In the operation, BHP follows authentic and respectful relationships with the stakeholders and maintains it for a long by focusing on CSR policies.
In addition, BHP has an effective sustainability approach that puts health and safety first and then responsible for environment and supports the community.
In order to protect the environment, the CSR policy of BHP provides biodiversity support, rehabilitation & closure, water stewardship and response for climate change governance and manages operational emissions effectively.
The business environment of BHP includes different kinds of risk areas for investors due to the level of competition as well as mining is a very risky industry that is based on luck also.
It includes both financial and non-financial risks (International risks, Operational risks, Environmental risks, etc.). An effective strategy is followed by BHP for risk management that includes risk assessments, risk controls, risk materiality, and tolerability evaluation.
The historical risk parameters of BHP defines that the company has 0.24 risk beta currently. It indicates that the company has very fewer chances of the risk and the EPS is 2.05. The profit margin is 12.35% and returns on equity are 16.65%.
| Stock Price History | Values |
| Beta (3Y Monthly) | 0.24 |
| Risk free-rate | 2.35 |
| Forward Annual Dividend Yield | 4.46% |
| Trailing Annual Dividend Yield | 1.95% |
| 52-Week Change | 4.03% |
| S&P500 52-Week Change | 5.91% |
| 52 Week High | 57.25 |
| 52 Week Low | 43.19 |
| 50-Day Moving Average | 54.38 |
| 200-Day Moving Average | 50.12 |
The above table is representing the stock price history of BHP that is supportive to estimate the risk in the financial investment.
3.3 Valuation of BHP Stock Price
The stock price of BHP is determined by a financial comparable multiples analysis. In this, P/E (Price to Earnings) results are compared with its main competitors that are listed on ASX such as Anglo American, Exxon Mobil, BP, Nippon Steelm, etc.
Table: P/E Ratio for ASX Listed mining material firms:
| Company | P/E Ratio |
| BHP | 19.38 |
| Anglo American | 9.4 |
| Exxon Mobil | 17.28 |
| Nippon Steelm | 10.80 |
| BP | 11.29 |
In 2018, it is calculated that the P/E ratio of BHP is 19.38 that is comparatively higher than its competitors. In addition, the below table is representing the financial forecasting for BHP to operate the business in long-run.
| Long-Term financial forecast | FY 19 | FY 20 | FY 21 |
| Operating Revenue | 43,882 | 44,393 | 43,544 |
| EBITDA | 23,298 | 23,940 | 22,636 |
| Net income | 9,615 | 10,256 | 9,538 |
| P/E ratio | 13.8 | 12.9 | 14.0 |
| EPS ( $ ) | 1.88 | 2.01 | 1.85 |
In the above table, all amounts are in USD Million. As per this forecasting, the business of BHP will grow in the future.
3.4 Default Risk and Cost of Debt
In addition, it is also calculated that interest-bearing liabilities of BHP was US$26.8 billion at the end of FY2018 and cash and cash equivalents were US$15.9 billion.
This resulted in net debt of BHP as per FY 2018 is 69.46 billion. However, it can be said that BHP’s recent recovery and ability to perform batter reflected on its debts. In order to identify the risk and cost of debt, last five financial year’s net debts and interest coverage are provided in the below figures:
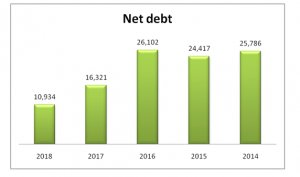
Figure: Net Debts of BHP
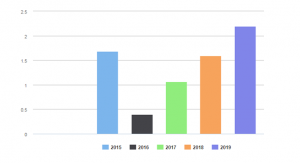
Figure: BHP Interest coverage
At the same time, it is identified that BHP has maintained strong liquidity where it reserved the US $15.87 million as cash and cash equivalents in 2018. The interest converges for the year ending 2018 was 0.93.
The capital structure of BHP is comprised of both debt and equity. The current capital structure of BHP is given as below:
| Total Debt | Interest | Long Term Debt | Percent Debt | Preferred Stock | Share Equity | Percent Equity |
| $36,267,082 | $2,120,146 | $32,565,282 | 30% | $0.00 | $75,215,803 | 70% |
| LT Debt to Equity (MRQ) | 51.05 |
| Total Debt to Equity (MRQ) | 53.22 |
| Interest Coverage (TTM) | 0.93 |
Currently, the total equity of the company is $55,592 million and a market value of $ 82,110 million adjusted to exclude hedge reserves. For the FY 2018, net on balance sheet debt was $ 69,460 million that also includes interest-bearing liabilities.
Below table is representing the capital structure of the BHP group Ltd’s subsidiary firms that are listed in ASX.
| Security ASX Code | Class | Number |
| BHP | EQY | 2,945,851,394 |
| BHPAA | EQY | 1 |
| BHPAB | EQY | 1 |
| BHPAC | RGT | 15,389,204 |
| BHPAU | COP | 569,779 |
In addition, the WACC for BHP is calculated to identify the overall cost of capital and effectiveness of the capital structure.
Formula: WACC =
| E / (E + D) | * | Cost of Equity | + | D / (E + D) | * | Cost of Debt | * | (1 – Tax Rate) |
| 0.8215 | * | 3.4% | + | 0.1785 | * | 3.7989% | * | (1 – 43.695%) |
WACC= 3.17%
- Weight of equity = E / (E + D) = 131763.864 / (131763.864 + 28639.5) = 0.8215
- Weight of debt = D / (E + D) = 28639.5 / (131763.864} + 28639.5) = 0.1785
- Cost of Equity = 1.96000000% + 0.24 * 6% = 3.4%
- Cost of Debt = 1088 / 28639.5 = 3.7989%
- The latest Two-year Average Tax Rate is 43.695%
4.1 Analyzing Existing Investments and Financial Returns
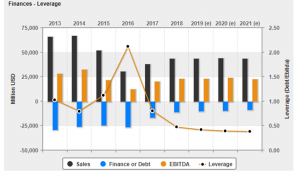
Figure: Financial leverage
In the above figure, the financial leverage of BHP is calculated on the basis of sales, debt and EBITDA. BHP is has debt of $10,934 million in FY 2018 and sales was $43,638 million.
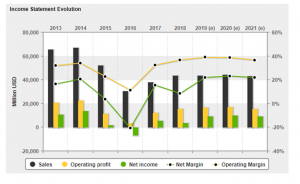
Figure: Income statement evolution
In this figure, the financial return of the company is provided, where the FY 2016 is showing negative income with -$6385 million.
| Activity Ratios | 2018 (US $m) | 2017 (US $m) | 2016 (US $m) |
| Inventory turnover | 38.25 | 25.15 | 46.45 |
| Account receivable turnover | 14.09 | 39.06 | 31.82 |
| Account payable turnover | 7.30 | 5.03 | 5.55 |
As per the above ratios, it is calculated that there is an increment in the inventory turnover and reduction in account receivable that is profitable for the firm. The account payable turnover is increased in FY 2018.
The marketable performances of BHP’s shares are showing improvement from the financial year 2016 to 2018.
| Year | 2016 | 2017 | 2018 |
| Price Per Share | 13.89 | 17.89 | 25.10 |
| EPS | -1.65 | 1.46 | 0.9 |
| P/E | -11.6 | 16.2 | 36.2 |
| Earnings Yield (%) | 2.16% | 4.64% | 4.70% |
| Book Value per Share ($) | 16.9 | 10.8 | 10.4 |
In this, the price per share has increased from 13.89 to 25.10 and yield increased from 2.16% to 4.70%.
In recent financial years, the financial position of BHP has increased that has provided a good competitive strength to the company. In addition, the BHP also has a strong market and financial position that provides a good return on assets and diversified revenue stream respectively.
At the same time, BHP has a very strong international brand name with a strong workforce with over 45,000 employees as well as it is one of the largest petroleum and mining companies (BHP Group ltd, 2019).
The petroleum and mining industry has several organizations in overall Australia but the main competitor of BHP is Anglo American mining company.
| BHP | Anglo American | |
| Revenue ($b) | 43.895 | 27.610 |
| EBIT ($b) | 7.02 | 5.24 |
| Net Profit Margin | 12.35% | 12.85% |
| ROA | 9.23% | 6.07% |
| ROE | 16.65% | 14.90% |
| Operating Cash Flow ($b) | 18.39 | 7.13 |
| EPS | 2.05 | 1.37 |
| P/E | 25.12 | 9.18 |
| Total Debt/Equity | 48.30 | 30.44 |
On the basis of the above table, it is identified that BHP has more financial value than Anglo American as per the revenue, profitability, cash flow and ROE.
The financing of BHP includes return on assets, investment, and equity over the previous 5 years.
| FY 2018 | Average of last 5 years | |
| Return on Assets | 5.27 | 5.1 |
| Return on Investment | 6.19 | 6.07 |
| Return on Equity | 10.56 | 8.78 |
As per the comparison of last five year’s data with current year data, it is identified that the current financing is more effective for investors that are providing a good return on the assets, investment, and equity.
5.2 Debt-Equity Trade-offs and Free Cash Flow
Trade-offs of BHP receives by the financing activates of the company.
| 2014 | 2015 | 2016 | 2017 | 2018 | |
| Net Income before Extraordinaire | 23.68 | 9.67 | -9.98 | 14.77 | 19.04 |
| Depreciation, Depletion & Amortization | 8.41 | 11 | 11.9 | 8.2 | 8.12 |
| Income Tax Expense | 7.39 | 4.4 | -1.45 | 5.89 | 9.04 |
| EBITDA | 31.02 | 24.42 | 15.66 | 24.11 | 28.63 |
As per the above table, the most significant impact of the one-off non-cash fleet down impairment that assists to deliver a $3.04 billion tax expense in FY18.
| 2014 | 2015 | 2016 | 2017 | 2018 | |
| Free Cash Flow ($B) | 11.05 | 8.82 | 5.06 | 17.38 | 17.4 |
| Free Cash Flow Growth | -20.12% | -42.70% | 243.77% | 0.11% | |
| Free Cash Flow Yield | 5.89% |
The free cash flow was negative in the past years but it is showing positive in the recent two years. Due to this, free cash flow yield is calculated at 5.89% in the current financial year.
On the basis of several cash transactions, it is identified that the current liquidity position of the company is strong because the current ratio for FY18 is 1.85 and the quick ratio is 1.53. In addition to this, the cost of debt is calculated (using: Cost of Debt = 1088/28639.5 = 3.7989%).
6.1 Historical Dividend Policy Analysis
The share price of BHP shredding half its value between FY15 to FY17 that negatively impacted on shareholders of BHP. The below figure is representing historical dividend data for BHP for the last five years:
It is defining that the company has provided the highest dividend on 1st Oct 2018 to its shareholders.
Dividend policies are typically used in relation to financial markets for collecting information about the current and potential future value of BHP.
The positive changes in dividends have really provided positive changes in the share price of a company such as investor demand. Consequently, it would be suggested to BHP that it may play a minor role in the dividend policies to increase the value of the organization.
In addition, the majority of the shareholders of BHP are holding shares between 1 and 5000 (BHP Group ltd, 2019). Due to this, the dividend policy directly impacts on the shareholders.
On the basis of the above study, it is concluded that over the last 5 years, the performance of BHP in the marketplace has been impacting on the investors and shareholders. The overall financial performance is showing positively with 2.01% as per the current financial data. In addition to this, the share price is also showing positive outcomes from the last five years.
The current volume is showing 1.37 million that is comparably higher with previous year data. In addition to this, the ratio analysis is showing positive strengths of the company, where BHP has positive current and quick ratios. BHP also has financial resources and effective dividend policy that satisfies the shareholders.
Aebi, V., Sabato, G., & Schmid, M. (2012). Risk management, corporate governance, and bank performance in the financial crisis. Journal of Banking & Finance, 36(12), 3213-3226.
Arnold, G. (2012). Corporate financial management. Pearson Education.
BHP Group ltd. (2019). Annual report 2018. Retrieved from: https://www.bhp.com/-/media/documents/investors/annual-reports/2018/bhpannualreport2018.pdf
BHP Group ltd. (2019). Market Screener. Retrieved from: https://www.marketscreener.com/BHP-GROUP-LTD-6492795/financials/
BHP Group ltd. (2019). Market Watch. Retrieved from: https://www.marketwatch.com/investing/stock/bhp
BHP Group ltd. (2019). Reuters. Retrieved from: https://www.reuters.com/finance/stocks/financial-highlights/BHP
BHP Group. (2019). Yahoo Finance. Retrieved from: https://finance.yahoo.com/quote/BHP?p=BHP
Brigham, E. F., & Houston, J. F. (2012). Fundamentals of financial management. Cengage Learning.
Burtonshaw-Gunn, S. A. (2017). Risk and financial management in construction. Routledge.
Hull, J. (2012). Risk management and financial institutions,+ Web Site (Vol. 733). John Wiley & Sons.
Karadag, H. (2015). Financial management challenges in small and medium-sized enterprises: A strategic management approach. EMAJ: Emerging Markets Journal, 5(1), 26-40.
Pham, T. H., Yap, K., & Dowling, N. A. (2012). The impact of financial management practices and financial attitudes on the relationship between materialism and compulsive buying. Journal of Economic Psychology, 33(3), 461-470.
