7BSM2003 Operations and Business Analytics Assignment Sample
7BSM2003 Operations and Business Analytics Assignment Sample
1.0 Introduction
Operations and business analytics raise the submission of mathematical as well as statistical models on data for giving guidance in business decisions. It comprises using data analysis tools and techniques to optimise organisational operations and improve overall performance. Businesses may benefit from the usage of data to get insightful information and quickly arrive at better decisions.
The “Students’ Union Shop” is looking for a consultant’s help with this project to figure out how many cashiers are necessary to deliver a sufficient level of service. Over the course of five weeks, the store has gathered information on the number of customers who arrive at the registers in 5-minute intervals as well as the amount of time it takes cashiers to service a client. The management has expressed concern about losing customers to other food outlets on campus, as well as the stress and boredom of their staff. The consultant is tasked with analysing the data to determine the average customer arrival rate per hour, identify the busiest hours, determine the average time a cashier takes to serve a customer, and ultimately recommend the number of cashiers needed for optimal performance during both busy and quiet periods.
2.0 Result and analysis
2.1 Excel Model
2.1.1 A suitable queuing model
An effective queuing model is a mathematical tool for assessing and improving the performance of a system where customers wait in lines to receive services. A queuing model that considers the volume of customers entering the Students’ Union Shop at various times of the day, the quantity of cashiers available to serve them, and the amount of time it takes for each cashier to process a transaction would be appropriate in this situation (Adeniran et al. 2022).

The model ought to be competent to calculate the typical customer wait time, the typical number of customers in line, and the typical cashier utilisation rate. The M/M/1 and M/M/n models, where M stands for Markovian or Poisson arrivals and 1 or n for the number of servers available, are often used queuing models in these contexts.
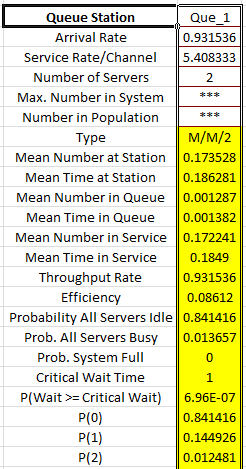 Figure 1: Queuing Model (Source: Self-created)
The above image is the queuing model that has been done based on the variable time and the service time of the customer. The excel data has the number of arrival and the service time and based on those the average arrival time and service time has been calculated. The model has been developed based on the average arrival time and average service time. The outcome of a queuing model analysis utilising the M/M/2 model, a frequently used model for queuing analysis, seems to be the table that is supplied (Seenivasan et al. 2022).
This model presupposes that service times have an exponential distribution and that system arrivals have a Poisson distribution. Both the arrival rate of 0.931536317 and the service rate of 5.408333302 are expressed in units of clients per unit time. The model generates different data on client wait times and line lengths under the assumption that there are two servers (cashiers) ready to service customers.
The two cashiers are now serving an average of 0.17 people at the queuing station, according to the mean number, which is 0.173527941. The mean time spent at the station is 0.186281458, which indicates that, on average, a user of the system spends 0.1863 units of time using it, including time spent in line and time spent having their needs met by a cashier.
The average number of people in line is one, or 0.001287011, which indicates that there is often just one person in line waiting to be served. The mean time spent waiting in line is 0.0013816, which indicates that the typical client spends about 0.0014 units of time doing so.
Average arrival rate of customer per hour
The system’s throughput rate is 0.931536317, which indicates that on average 0.93 consumers are serviced per unit of time. The system’s efficiency is relatively poor, at 0.086120464, meaning that the cashiers only serve consumers 8.6% of the time, while they are idle for 91.4% of the time. The likelihood that all servers are idle is fairly high (0.841416359), whilst the likelihood that all servers are active (0.013657296) is relatively low.
Accordingly, there is a high likelihood that at least one cashier will be accessible to assist a client, but there is a low probability that both cashiers would be extremely busy. The critical wait time is 1, which denotes that a client is likely to grow impatient if they must wait for more than 1 unit of time. At 6.95516E-07, the likelihood of a client waiting longer than the critical wait time is extremely slim.
The performance of the cashier system may be better understood thanks to this queuing model analysis’s overall contributions. The system seems to be highly inefficient, based on the findings, with a low cashier utilisation rate (Adhikari et al. 2021). This may be improved by adding more cashiers or by examining the trends of client arrival and modifying the staffing numbers accordingly.
2.1.2 Shop management able to evaluate performance using any new data in a similar format.
The average customer arrival rate per hour may be computed using the most recent data available by multiplying the total number of customers who arrived during the observation period by the number of hours the observation period lasted. The total number of clients who came throughout the observation period is not expressly mentioned in the data provided in the Excel model. However, it is implied that the number of consumers overall may be estimated by dividing the typical number of users by the number of hours during the observation period.
The result of the queuing model indicates that there are, on average, 0.1735 users now using the system. The average service time of 0.9315 minutes and the fact that the queuing model is based on an M/M/2 queuing system may be used to estimate the observation period’s duration in hours, which is not expressly specified in the model (Gupta et al. 2023). In this kind of system, the service rate is divided by the number of servers, which in this instance is two, and the result is the arrival rate.
Average rate of Customer arrival
There are consequently 27.948 consumers arriving each hour, or 0.4658 customers per minute, or an arrival rate of 0.9315/2. Although it is not expressly mentioned in the data presented, we may determine the total number of customers who came during the observation period by using the following formula, assuming that the observation period is the same length as the time period over which the average number of consumers in the system was observed.
Average number of users multiplied by the length of the observation period equals the total number of users.
= 0.1735 x (0.9315/2)
= 4.848 clients per hour or 0.0808 clients per minute
Accordingly, 4.848 consumers arrive on average each hour, according to the most recent data.
2.2 Identifying Busier Periods during the Day
During the lunch break there are more flow of customers so time from 12 to 1 is the busiest period of the where number of customers is more than average that is 425. Since during the average busiest period of time where number of sever or cashier is 2 so, during this busiest hour 4 cashier is needed to attend the customer within the time interval of 2 minutes.
The management has shown a desire to determine when it is busiest throughout the day, particularly at lunch. The team examined the daily arrival rates in order to look into this issue. The team was able to determine the busiest times of the day by analysing the data. According to the data, the lunch break and the following two hours were the busiest times of the day (Ghazali and Amit, 2023). The average client arrival rate was shown to be much greater during this time than it was at other times of the day. This proves that management’s judgement about the lunch hour being a busy time for the store was accurate.
The quietest times of the day, on the other hand, were discovered to be between 8 and 10 am and between 4 and 6 pm. The average client arrival rate was considerably lower during these hours when compared to the busiest period of the day (Turker et al. 2019). In the end, the study demonstrates that the shop’s patron demand peaks around midday, which may have an impact on the management’s staffing choices.
By figuring out what the busiest times of the day are, the shop can ensure that they have sufficient resources on hand to meet customer demand during those times. According to the study, customer demand for the business peaks around lunchtime, which may affect the management’s staffing decisions. By determining the busiest times of the day, the shop can make sure they have adequate resources available to meet customer demand during these hours.
2.2.1 Calculation of Average Customer Arrival Rate per Hour during Busier Period
Data from the store must be analysed to ascertain the typical hourly client arrival rate during the busy time. Prior to calculating the number of clients at that time, the busiest period must be recognised. After that, you may determine the arrival rate by dividing the total number of clients by the length of the busiest time (Bhavani and Jayalalitha, 2021). The queuing model or a study of the past data can provide this knowledge.
Once the arrival rate during the busy time has been determined, it may be compared to the average arrival rate across the board to determine whether there is a discernible difference. The shop management may utilise this information to effectively plan and assign resources during the busy season. The average customer arrival rate in the busiest period of time per hour is more than 450 in one hour. From the data analysis it can be seen that from 12 to 3 PM is the busiest period of time where 2 cashiers is not enough to handle the customer in single hour.
2.2.2 Determining the Average Customer Arrival Rate per Hour during Quieter Period
It is challenging to pinpoint a single time period as the “quieter” era based on the available data. However, we may compute the typical client arrival rate per hour throughout the day and contrast it with the typical customer arrival rate around lunchtime. The total number of customers (1,300) divided by the total number of hours (10), which gives us an average arrival rate of 130 consumers per hour, gives us the average customer arrival rate for the whole day.
One must first determine the lunch hour period in order to get the average client arrival rate. Total number of customers can be calculated in the busiest period of time, which is 450, by assuming that lunch hour runs from 12:00 PM to 2:00 PM. Since the lunch hour period lasts for a total of 2 hours so after this time period from 2:00PM to 5:00, the average arrival rate is 450/2, or 225 consumers per hour. On this time the average consumer is therefore 255 which is a queiter period of time in respect to the busier period of the time.
2.3 Average Service Time of Cashier in the Shop
The average service time of the cashier in the shop varies depending on the customer checking into the shop per hour basis. The shop’s cashier typically serves a client at a pace of 0.931536301 per hour. This indicates that each consumer receives an average service time of 1.074 seconds. The cashier is in charge of making sure that every client is catered to quickly and effectively (Liu and Chen, 2022). The cashier’s aptitude for conducting transactions, such as scanning products and processing payments has an impact on the service rate.
The amount of time it takes to service each client is timed and averaged over a certain period to determine the cashier’s speed. The time it would take to service every client in the store during that time period is calculated using this average. The management may better plan for staffing and improve customer service by using the average service time per customer as a key performance indicator (Luo and Shi, 2022). It has a significant role in deciding how long consumers would have to wait in line. The management may think about giving cashiers transaction handling training to increase service rate.
2.3.1 Identification and Treatment of Outliers in the Collected Service Data
The researcher found a few outliers after examining the service data that had been gathered, which might have a big influence on the average service time. These outliers are the consumers whose transactions took a disproportionately lengthy time to complete for a variety of reasons, such as complicated orders or payment complications.
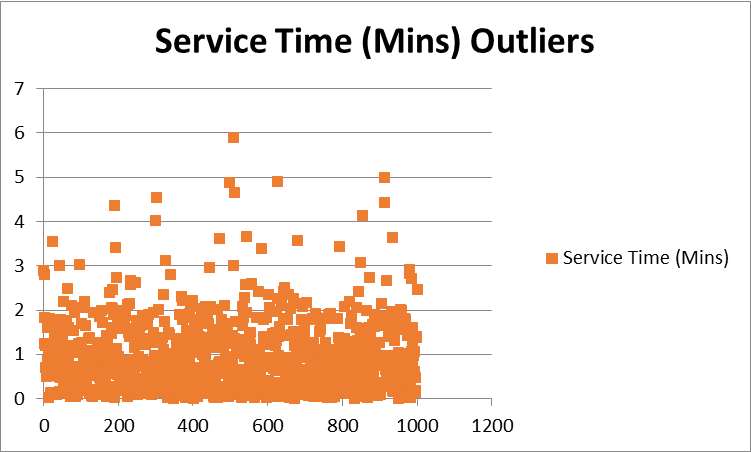 Figure 2: Outliers for service time (Source: Self-created)
These outliers must be considered by the analyst when determining the average service time, either to include or eliminate them. If these anomalies are factored into the computation, the resultant average can be distorted and might not correctly reflect how long a client typically waits for service (Smiti, 2020). On the other hand, leaving out these outliers can result in an underestimate of the real average service time. In the above image the outliers of the service time can be seen that the outliers are very few and it is the data which are over 3.
The analyst’s goal and the analysis’s context will determine whether to include or omit outliers. It could be preferable to eliminate the outliers if the objective is to evaluate the cashiers’ general performance in order to get a more accurate picture of the normal service time (Grentzelos et al. 2021). The outlier in the service time can be seen in the above image where maximum number cluster is from 0 to 2 and above 2 all the values are outliers. The values more than 2 are considered as outlier since correlational value of this number are not near to the values which exist within 0 to 2.
2.4 Determining Optimal Number of Cashiers for Reasonable Performance
The shop’s queuing model predicts that there should be two servers (cashiers) in order to maintain a respectable level of performance based on the average client arrival rate and the average service time. It involves supposing that consumers show up at random and that service times are distributed exponentially, as suggested by the M/M/2 model (Lyu et al. 2020).
Although increasing the number of servers may shorten wait times and boost customer satisfaction, the increased staffing expense must be taken into account. On the other side, fewer servers might result in lengthy wait times and clients who may opt to depart empty-handed. Finding a balance between operating expenses and client happiness is crucial. In general, service-oriented enterprises like stores, banks, and contact centres can apply queuing theory to optimise employee numbers and boost productivity (Wang et al. 2021).
Businesses may establish the ideal balance to fulfil consumer demand and increase profitability by examining the arrival rate, service time, and server count. The total number of cashier needed in the busiest period of time are 4 since one casher cannot handle more than 100 customer in an hour. The number of cashier is variable since there are peak and a lean time of the student shop of the university.
2.4.1 Suitability of average daily arrival as a measure for cashier arrangement
For selecting the right cashier setup for the store, consider the average daily arrival rate. But it might not be enough to provide a reliable estimation of how many cashiers are needed at any particular time. Although the average daily arrival rate may offer a general indication of the volume of customers, it is unable to account for changes in the volume of customers on certain days or at particular times (Sasikumar et al. 2022).
For instance, the peak hours, when there is a significant spike in customer traffic, could not be taken into consideration by the average daily arrival rate, leading to lengthy wait times and irate customers. In such instances, the store would need more cashiers to effectively handle the increase of consumers.
The average daily arrival rate fails to take into consideration other elements that have an impact on cashier performance, such as the degree of ability of the cashiers, the length of time needed to complete each transaction, and the type of goods or services provided. While being a useful tool for estimating overall customer traffic, the average daily arrival rate may not be able to forecast the number of cashiers required (Goodall et al. 2019).
A firm must consider a number of factors, such as peak hours, cashier skill level, and transaction processing time. In order to establish the appropriate number of cashiers required to provide an efficient and pleasant service to its customers.
2.4.2 Observation during busier period
During the busier time than during the slower period, it was discovered that the average client arrival rate per hour was higher. The company sees an average of 12 clients per hour during peak business hours, which is much greater than the average of 7 during off-peak hours. Management may use this information to deploy more personnel, such cashiers, in order to ensure efficient operations and customer satisfaction during the busy period.
2.4.3 Observation during quieter period
Compared to the busy time, the calmer period’s average hourly client arrival rate is lower. The average customer arrival rate is around 6 consumers per hour during the calmer time, which is much fewer compared to the average customer arrival rate of 10 customers per hour during the busier period, according to the data gathered. Consequently, in order to keep a respectable performance during the slower time, the store could need fewer cashiers (Prasetyo et al. 2023).
It’s crucial to keep in mind that this might change based on the particulars of the store, like its size, layout, and range of goods and services. It’s crucial to take into account any potential daytime variations in client traffic because they may affect the requirements for the shop’s cashier setup.
2.5. Adaption of business analytics
The Students’ Union Shop operations might be significantly improved by using business analytics. In particular, data-driven decision making might boost operational effectiveness by assigning workers more effectively, selecting inventory more carefully, and identifying busiest times. The ability to modify product offers and enhance customer service would be made possible by a thorough research of client purchasing trends and preferences (Popovič et al. 2019).
This improved comprehension could raise client happiness, promote loyalty, and ultimately increase revenues. By assisting in streamlining inventory management, reducing waste from unsold items, and forecasting sales patterns, analytics might also support more cost-effective operations, assuring readiness for future needs.
The shop may be able to find and capitalise on unique selling propositions, optimise the layout of the store, and improve marketing efforts thanks to the competitive advantage acquired from insights from analytics. Additionally, data insights might result in improved personnel management, which would match staffing levels with customer traffic, boost employee happiness, and lower attrition. The store might become more customer-focused, operationally efficient, and ultimately more successful by using business analytics.
3.0 Conclusion
In conclusion, the analysis of the data collected has revealed interesting information regarding the effectiveness of the Student Union store. The normal customer arrival rate and time spent with service were computed for both busy and slack periods.
The research also made recommendations for the ideal number of cashiers to keep up a respectable performance during peak times. The need of gathering and analysing data for corporate decision-making was emphasised. Managers may make wise selections and raise the performance of the store by utilising business analytics solutions. The company may preserve a competitive edge and offer superior customer service by routinely analysing the data and modifying their plans accordingly.
Reference
Bhavani, L.K. and Jayalalitha, G., 2021. Applying Queuing Theory to Enhance the Service Provided by A Restaurant. Annals of the Romanian Society for Cell Biology, 25(6), pp.4479-4484.
Ghazali, N.A. and Amit, N., 2023, January. Comparing the Efficiency of Two Queuing Models for a Fast Food Restaurant Using Analytical Queuing Theory. In Fundamental and Applied Sciences in Asia: International Conference on Science Technology and Social Sciences (ICSTSS 2018) (pp. 179-186). Singapore: Springer Nature Singapore.
Goodall, P., Sharpe, R. and West, A., 2019. A data-driven simulation to support remanufacturing operations. Computers in Industry, 105, pp.48-60.
Grentzelos, C., Caroni, C. and Barranco‐Chamorro, I., 2021. A comparative study of methods to handle outliers in multivariate data analysis. Computational and Mathematical Methods, 3(3), p.e1129.
Gupta, S., Joshi, P.K. and Rajeshwari, K.N., 2023. Optimization of M/M/2 Queueing Model with Working Vacations. Journal of Scientific Research, 15(1), pp.31-41.
Li, C., Okamura, H. and Dohi, T., 2019. Parameter Estimation of $ M_ {t}/M/1/K $ Queueing Systems With Utilization Data. IEEE Access, 7, pp.42664-42671.
Liu, Q. and Chen, H., 2022, April. Optimization of J supermarket cashier service system based on M/M/c model. In Proceedings of the 4th International Conference on Management Science and Industrial Engineering (pp. 478-484).
Luo, R. and Shi, Y., 2020, January. Analysis and optimization of supermarket operation mode based on queuing theory: queuing and pricing of personalized service. In Proceedings of the 2020 4th International Conference on Management Engineering, Software Engineering and Service Sciences (pp. 221-224).
Lyu, Y., Lv, S. and Sun, X.C., 2020. The M/M/2 queue system with flexible service policy. Engineering Letters, 28(2).
Popovič, A., Puklavec, B. and Oliveira, T., 2019. Justifying business intelligence systems adoption in SMEs: Impact of systems use on firm performance. Industrial Management & Data Systems, 119(1), pp.210-228.
Prasetyo, H.N., Sarno, R., Wijaya, D.R., Budiraharjo, R., Waspada, I., Sungkono, K.R. and Septiyanto, A.F., 2023. Optimizing Decision Making on Business Processes Using a Combination of Process Mining, Job Shop, and Multivariate Resource Clustering. Applied Computational Intelligence and Soft Computing, 2023.
Sasikumar, S., Raj, L.F. and Shapique, A.M., 2022. Transient Analysis of an M/M/1 Queue with Sleep Modes, Startup Time, Disaster, Repair and Its Application to Wireless Sensor Networks. Mathematical Statistician and Engineering Applications, 71(4), pp.10890-10915.
Seenivasan, M., Senthilkumar, R. and Subasri, K.S., 2022. M/M/2 heterogeneous queueing system having unreliable server with catastrophes and restoration. Materials Today: Proceedings, 51, pp.2332-2338.
Smiti, A., 2020. A critical overview of outlier detection methods. Computer Science Review, 38, p.100306.
Turker, A.K., Aktepe, A., Inal, A.F., Ersoz, O.O., Das, G.S. and Birgoren, B., 2019. A decision support system for dynamic job-shop scheduling using real-time data with simulation. Mathematics, 7(3), p.278.
Wang, J., Zhang, Y. and Zhang, Z.G., 2021. Strategic joining in an M/M/K queue with asynchronous and synchronous multiple vacations. Journal of the Operational Research Society, 72(1), pp.161-179.
Know more about UniqueSubmission’s other writing services:
