7FNCE043W Artificial Intelligence and Machine Learning in Financial Services
Part A-Review of Research Literature
1. Introduction
Artificial Intelligence along with Machine Learning in financial services encompasses the activities such as chatbots assistance, fraud detection, task automation, and many more. The aggregation of AI and ML in financial services is the potential of saving costs at $447 billion by the end of 2023. The complexity of the optimal asset allocation problem enhances the enhancement of a number of assets. The implication of the “Portfolio Optimization Algorithm” helps in automatically selecting assets to invest to optimize the overall return and minimize the credit risks.
Aims:
The prime aim of this research is to evaluate the importance of AI and ML in financial services.

Objective:
- To evaluate the importance of Portfolio Optimization Algorithms and data mining techniques in Financial services
- To evaluate the importance of Machine Learning in “Credit Risk Modelling”
- To conduct a Literature review on wealth and Risk management with the Machine Learning technique
Research Question and Hypothesis:
Question:
What is the impact of AI and Machine Learning in Financial Services?
Hypothesis:
Null Hypothesis (H0): There is no significant impact of AI and Portfolio Optimization Algorithms in enhancing the effectiveness of financial services.
Alternative Hypothesis (Ha): There is a significant impact of AI and Portfolio Optimization Algorithms in enhancing the effectiveness of financial services.
2. Literature Review
2.1 Importance of AI and Machine Learning in financial services
Starting from the traditional hedge fund management firms to FinTech service providers, are heavily relied on the acquisition of data science and machine learning algorithms. The study by Goodell et al. (2021) conducted “co-citation” and “bibliometric-coupling” analyses and infer thematic structures. Through this process, Goodell et al. (2021) have stated that the implication of machine learning algorithms helps in “algorithmic trading”, “automation, financial modeling”, “loan and insurance underwriting”, “trade settlement”, and “sentiment analysis”, along with “asset and derivative pricing (Holzinger et al. 2018)”.
The research by Senet al. (2021) has discussed portfolio management and algorithmic trade. As per the view of Sen et al. (2021), through evaluating the information provided by the users like the amount of investment, ages of retirement along with associate information such as current assets, the machine learning algorithms allocate the “invested amount” into “multiple asset classes” in order to optimize the return on Investment. In fact, it can be possible to identify the risks associated with the investment.
2.2 Importance of Machine Learning in Credit Risk Modelling
Credit Risk can be considered as the main aspect of financial risks, which formulates when the borrowers fail to meet the associated debt obligations towards the creditors. As per the view of Andriosopoulos et al. (2019), the fundamental components of the “credit risks modeling” are the “Probability of loan default (PD)”, “Loss given default (LGD)” and “Exposure at Default (EAD)”. The expected loss can be defined as the multiplication of “Probability of loan default (PD)”, “Loss given default (LGD)” and “Exposure at Default (EAD)”. According to Andriosopoulos et al. (2019), the most common methods for the evaluation of credit scoring and rating are neuro-fuzzy systems, the Bayesian model, kernel methods, classification trees, and many more. As per the view of Andriosopoulos et al. (2019); Yao et al. (2017), the combination of “multiple base models” gets formulated through the implication of the single classifier for optimization in combined forecasting. The success of the ensemble scheme is dependent on the diversity of base models, the reduction of biases and variances, and many more. The methods that can be used for the ensembles are “bagging and boosting algorithms”.
The research by Chen and Zhou (2018) has used SURV methodology and a multi-state estimation approach for the development of the LGD modeling on consumer loans. The research by Chen and Zhou (2018) has stated that the implication of the SURV methodology and multi-state estimation approach in Machine Learning has helped in detecting credit risks and algorithmic trading risks. On the other hand, the study by Yao et al. (2017); Andriosopouloset al. (2019) have evaluated SVM (Support Vector Machine) methodology to develop the LGD modeling with credit loans.
2.3 Portfolio Optimization Algorithms
As per the view of Yang et al. (2018); Nakano et al. (2018), the prime aim of the Portfolio Optimization algorithms is to determine the optimal allocation of wealth. Through the implication of the Optimization Portfolio Algorithm, it becomes possible to automatically detect good-performing assets and mutual funds based on multiple factors, which are credit risks, credit screening, and many more. The two fundamental approaches are to match the underlying patterns of the “asset prices”. The implication of the “Correlation-driven Nonparametric” system helps in matching the current stock price pattern with the historical patterns of similar types of stocks. On the other hand, the “Anti Correlation” system helps in automatically transferring the financial assets from bad performing to “good-performing stocks or mutual funds or IPOs”. The study by Yang et al. (2018) has developed a “Trend Representation based Log-density Regularization (TRLR) system” for the performance of Portfolio Optimization. Through this research, Yang et al. (2018) have concluded that the PAMR (“Passive Aggressive Mean Reversion”) system exploits the mean reversion through the implication of passive learning methods.
As per the findings of Yang et al. (2018); Lai et al. (2022), and Zheng (2021), the deployment of the Portfolio Optimization Algorithm helps in identifying the “price trend patterns”, which further helps in predicting the dynamic changes in asset prices. As a result, it becomes possible to recognize fluctuation in upward and downward trends along with its strength.
2.3 Financial Decision-making
As per the view of, the development of the prescriptive and predictive models allows the identification of the non-trivial patterns in ill-structured financial data. In fact, supervised along with unsupervised learning are commonly used for classification and regression along with the “intelligent optimization system”. As per the view of Andriosopouloset al. (2019), the development of the optimization models such as stochastic, multiobjective, and fuzzy are widely utilized in order to perform “asset allocation”, “financial planning”, and “risk management” system. The research by Andriosopouloset al. (2019) originated the optimization model for financial decision-making from “Markowitz (1959) on portfolio selection Theory”. The implication of AI and ML with the decision analysis along with the “decision support system” helps in automating the decision-making procedures.
The research by Fievet and Sornette (2018) has used the Decision Tree and Markov models in order to evaluate the impact of the Machine Learning algorithm on the financial decision-making process. The research by Fievet and Sornette (2018) has stated that through the development of the Decision Trees and Markov Model, it becomes possible to evaluate the risks in Stocks. The fluctuation in different stock prices can be predicted and forecasted. As a result, the risks associated with a financial investment decision can be minimized to an optimal extent. The study by Yang et al. (2018) has developed the Ridge Regression Model on different financial portfolios and Nakano et al. (2018) has developed an ANN algorithm for the evaluation of Machine learning algorithms in the process of financial decision-making.
2.4 Wealth and risk management with ML techniques
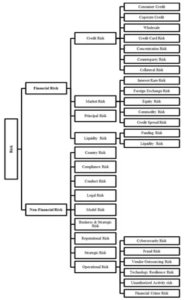
Figure 2.4.1: Taxonomy of financial risks
(Source: Leo et al. 2019)
As per the view of Leo et al. (2019), the emerging growth of consumer credits has increased the urgency of the credit scoring model. The implication of the machine learning algorithm helps in predicting the underlying risks in financial decision-making. In fact, the use of SVM, decision trees, and random Forest classifiers helps in detecting the market volatility of stocks or assets in the dynamically changing marketplace. Henceforth, through the integration of the machine learning model, it becomes possible to main optimal operation in wealth management systems.
2.5 Theoretical paradigm
- Markowitz’s theory of portfolio selection
As per the view of Qu et al. (2017), the concept of “Markowitz’s theory of portfolio selection” is based on the quantified return of assets and the “risk of security” through the measures of standard deviation and expected return. As per the concept of “Markowitz’s theory of portfolio selection” an investor needs to consider the volatile market risks along with considerable return in order to determine the distribution of the funds. Therefore, due to the existence of the two conflicting factors, it becomes important to deploy a machine learning model in predicting the market risks of a particular stock and forecasting the future value of a stock. Henceforth, it can be said that, through the alignment of Machine Learning models and AI technology, it becomes possible to optimize the effectiveness of financial services.
3. Displaying detailed knowledge and experience in applying ML techniques and identification of research gaps
3.1 Description of the ML techniques
ML technique can be used for describing the operation of the financial service and several approaches are used for obtaining the detailed operation based on the service. The approach can be implemented for developing the operation and the appropriate planning process can be used for improving the financial operation. The ML technique helps to interpret the financial service for explaining the operation of the financial service and the process can be developed to minimize the risk of the financial services. ML technique can develop a better-optimized portfolio based on the mutual fund dataset (Hodson et al. 2019). In developing the financial service, the trading activities, as well as the financial service can be identified based on the analyzing process. The financial service helps to improve the service and the fraud detection technique helps to explain. The financial forecasting process helps to understand the prediction value of the financial service and the risk of the entire operation.
The risk of the financial service can be determined based on the ML technique and the effective outcome can be used for explaining the ML approaches using the mutual fund’s dataset. An algorithmic trading process can be used based on the mathematical model that helps to make decisions based on the trading process. The trading activity can be detected based on developing the model. In the financial service, the fraud detection technique can be implemented for obtaining the risk of the entire operation. A portfolio optimization algorithm can be used for describing the entire operation and the technique can help to improve the performance of the service (Sen and Dutta, 2022). The risk tolerance factor and the other factors in the service can be identified to improve the effectiveness of the analysis process. The concerning algorithm can provide a financial portfolio based on the investor’s goal and the appropriate strategy can be used for obtaining the required parameters of the financial service.
3.2 Research gap
The research gap helps to determine the obstacles of the analysis process and the financial service can be developed based on effective ML techniques. The appropriate machine learning model can be used for making predictions based on mutual fund data. For developing the service, an effective decision-making process can be interpreted as improving the performance of the service. Lack of data interpretation techniques cannot be implemented for obtaining the details of the financial service. The performance of the financial service can be based on the data quality and the appropriate availability process helps to explain the details of the financial service. The portfolio optimization method can be used for describing the performance of the service. The return value can be measured for describing the financial service; for this reason, an appropriate return value has been required for obtaining the risk of the financial service.
4. Methodology and Project plan
A secondary qualitative research approach has been evaluated in this research in order to evaluate the impact of machine learning and AI on the effectiveness of financial services. Multiple scholarly articles and academic journals on the related topic have been chosen and analyzed using the thematic analysis technique.
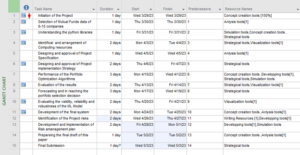
Figure 4.1: Gantt chart
(Source: Developed by the learner in MS-Project)
The above figure has demonstrated the overall plan for executing the project. In order to complete the development of the Portfolio Optimization algorithms and data mining operations on the mutual fund’s dataset, a total time of 20 days is required.
Part B -Application of the ML technique
1. Demonstrate the data mining process based on financial service
The data mining technique can be implemented based on the python programming language used to improve the performance of the financial service. Different types of parameters are identified for explaining the operation of the financial service and the relevant software tool can be used for examining the detail of the financial services (Andriosopoulos et al. 2019). Several kinds of features of the python programming language can be implemented for explaining the details of the analysis process.
An effective mathematical model can be implemented for explaining the details of the portfolio optimization algorithm based on the mutual fund dataset. For describing the operation of the financial service, appropriate library functions are required to implement for explaining the details of the financial service. The specific dataset can be used for explaining the issues of financial services, and fraud detection techniques, as well as the data visualization process, helps to describe the operation of the financial operation (Sen et al. 2021). An effective mathematical formula can be implemented for obtaining the details of the financial services and the appropriate objective function has been used to explain the details based on the return value.
Mutual fund portfolio data can be identified for describing the operation of the financial service and the capital requirements help to explain the portfolio level. An appropriate data analysis process and the computational technique has been implemented for identifying the different area of the analysis process such as financial fraud detection process, efficiency analysis, risk modelling, as well as determining the performance of the financial services. The mutual fund dataset can be used for explaining the details of the financial service based on the specific optimization process.
2. Methodology
2.1 Justification of the choice of methods
Complex financial optimization techniques can be solved based on the portfolio optimization algorithm and the technique helps to explain the details of the asset allocation, as well as the index tracking process. The technique has been used for collecting data for developing the operation of the financial services and the appropriate measurement is taken place for improving the financial service. An effective algorithm has been applied for describing the operation of the financial operation and the value-at-risk can be used for explaining the details of the services (Goodell et al. 2021). The concerning algorithm has the ability to build an appropriate model that helps to explain the financial service and the optimal solution can be determined based on the financial data.
The algorithm has been used for explaining the details of the model specification and the appropriate goals, as well as objectives have been implemented for collecting information. The measurement of the required factors can be explained based on the financial analysis process and the effective solution can be used for describing the computational process. The effective solution, as well as the selection process, can be used for improving the function of the analytical method.
2.2 Validity, quality and robustness
The appropriate data source has been used for describing the mutual fund details in the financial service. For describing the quality of the analysis process, an appropriate algorithm such as a portfolio optimization algorithm has been implemented to explain the details of the financial service. An effective approach helps to explain the optimization problem based on the appropriate dataset for improving the quality of the financial service. In this task, the approach has been used for determining the value of the optimization weight-based assets. The algorithm allows for obtaining the important factor that is used for improving the details of the analysis process. Python programming language will be used for collecting information on the financial services and the effective algorithm helps to identify the optimization problem based on the mutual fund’s dataset.
3. Results
Python programming language has been used for describing the details of the data mining process based on the mutual fund dataset (Kruse et al. 2019). Various approaches are used for obtaining the outcomes based on the appropriate approaches.
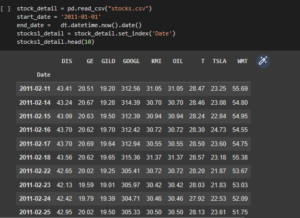
Figure 3.1: Description of the dataset
The above code has been used for explaining the details of the mutual fund data and the code helps to gather information about the financial service.
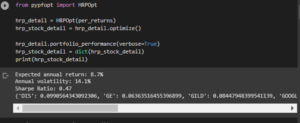
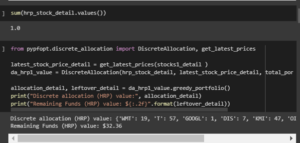
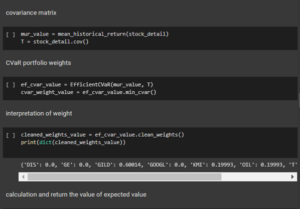
Figure 3.2: Obtaining the value of the required variables
The code has been used for determining the hrp details based on the portfolio optimization process.
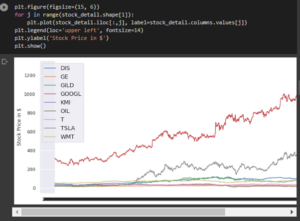
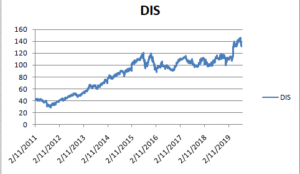
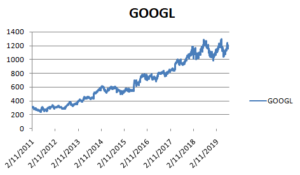
Figure 3.4: Explanation of the stock detail
The above plot has been used for developing the forecasted graph based on the mutual fund dataset.
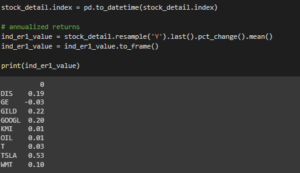
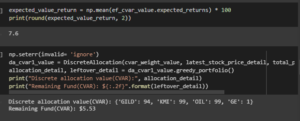
Figure 3.5: Determining the required value
The above code has been used for finding the required parameters based on the mutual funds.
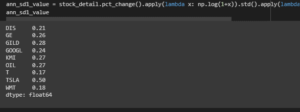
Figure 3.6: ann_sd1
The effective code has been used for obtaining the value based on the dataset to explain the details function of the mutual funds.
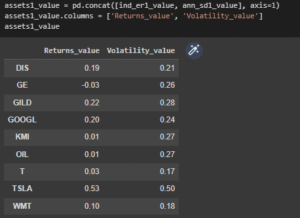
Figure 3.7: Table
The above table has been used for showing the details of the return and the volatility value based on the dataset.
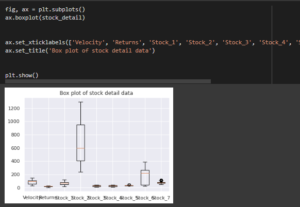
Figure 3.8: Box plot
The above plot has been applied for explaining the details of the data quality based on the effective patterns and the plot describes the details of the financial services.
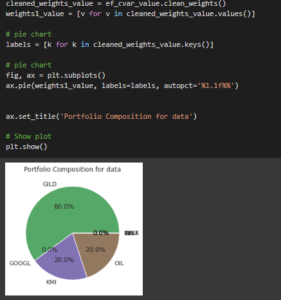
Figure 3.9: Pie chart
The pie chart has been used for describing the details of the mutual fund based on the portfolio composition method and the proper variable has been used for explaining the details of the funds.
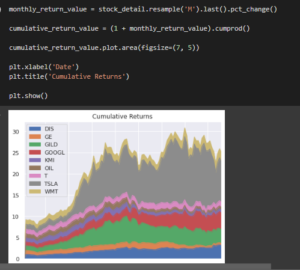
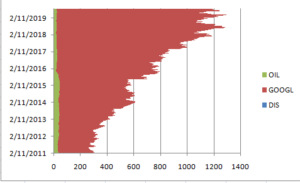
Figure 3.10: Forecasting analysis
The graph has been shown for describing the details of the mutual funds based on the forecasting model and the specific date column has been used for collecting information about the financial service.
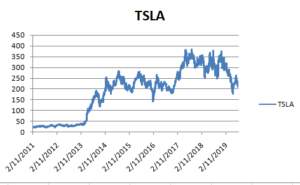
Figure 3.11: Forecasted data
The above graph has been used for describing the data based on the graphical visualization process.
4. Conclusion
The report sheds light on the machine learning approaches that are used for explaining the entire services based on financial activities. Several kinds of machine learning techniques can be used for obtaining the details of the mutual funds and the portfolio optimization technique helps to collect data based on the mutual fund details. An effective methodology has been implemented for finding the details of financial services. The proper forecasting model has been used for gathering data for making decisions based on the portfolio optimization technique.
Reference List
Andriosopoulos, D., Doumpos, M., Pardalos, P.M. and Zopounidis, C., 2019. Computational approaches and data analytics in financial services: A literature review. Journal of the Operational Research Society, 70(10), pp.1581-1599.
Chen, C. and Zhou, Y.S., 2018. Robust multiobjective portfolio with higher moments. Expert Systems with Applications, 100, pp.165-181.
Fiévet, L. and Sornette, D., 2018. Decision trees unearth return sign predictability in the S&P 500. Quantitative Finance, 18(11), pp.1797-1814.
Goodell, J.W., Kumar, S., Lim, W.M. and Pattnaik, D., 2021. Artificial intelligence and machine learning in finance: Identifying foundations, themes, and research clusters from bibliometric analysis. Journal of Behavioral and Experimental Finance, 32, p.100577.
Hodson, M., Ruck, B., Ong, H., Garvin, D. and Dulman, S., 2019. Portfolio rebalancing experiments using the quantum alternating operator ansatz. arXiv preprint arXiv:1911.05296.
Holzinger, A., Kieseberg, P., Weippl, E. and Tjoa, A.M., 2018. Current advances, trends and challenges of machine learning and knowledge extraction: from machine learning to explainable AI. In Machine Learning and Knowledge Extraction: Second IFIP TC 5, TC 8/WG 8.4, 8.9, TC 12/WG 12.9 International Cross-Domain Conference, CD-MAKE 2018, Hamburg, Germany, August 27–30, 2018, Proceedings 2 (pp. 1-8). Springer International Publishing.
Kruse, L., Wunderlich, N. and Beck, R., 2019. Artificial intelligence for the financial services industry: What challenges organizations to succeed.
Lai, Z.R., Li, C., Wu, X., Guan, Q. and Fang, L., 2022. Multitrend conditional value at risk for portfolio optimization. IEEE Transactions on Neural Networks and Learning Systems.
Leo, M., Sharma, S. and Maddulety, K., 2019. Machine learning in banking risk management: A literature review. Risks, 7(1), p.29.
Nakano, M., Takahashi, A. and Takahashi, S., 2018. Bitcoin technical trading with artificial neural network. Physica A: Statistical Mechanics and its Applications, 510, pp.587-609.
Qu, B.Y., Zhou, Q., Xiao, J.M., Liang, J.J. and Suganthan, P.N., 2017. Large-scale portfolio optimization using multiobjective evolutionary algorithms and preselection methods. Mathematical Problems in Engineering, 2017.
Sen, J. and Dutta, A., 2022. A comparative study of hierarchical risk parity portfolio and eigen portfolio on the NIFTY 50 stocks. In Computational Intelligence and Data Analytics: Proceedings of ICCIDA 2022 (pp. 443-460). Singapore: Springer Nature Singapore.
Sen, J., Mondal, S. and Mehtab, S., 2021, October. Portfolio optimization on NIFTY thematic sector stocks using an LSTM model. In 2021 International Conference on Data Analytics for Business and Industry (ICDABI) (pp. 364-369). IEEE.
Sen, J., Sen, R. and Dutta, A., 2021. Introductory Chapter: Machine Learning in Finance-Emerging Trends and Challenges. Algorithms, Models and Applications, p.1.
Yang, P.Y., Lai, Z.R., Wu, X. and Fang, L., 2018. Trend representation based log-density regularization system for portfolio optimization. Pattern Recognition, 76, pp.14-24.
Yao, X., Crook, J. and Andreeva, G., 2017. Enhancing two-stage modelling methodology for loss given default with support vector machines. European Journal of Operational Research, 263(2), pp.679-689.
Zheng, M., 2021. A Comprehensive Price Prediction System Based on Inverse Multiquadrics Radial Basis Function for Portfolio Selection. Applied Mathematics, 12(12), pp.1189-1209.
Appendices
Appendix A
| !pip install yfinance
!pip install mplfinance !pip install pandas_datareader import warnings warnings.filterwarnings(“ignore”) import pandas as pd import numpy as np import statsmodels.api as sm import scipy import scipy.stats as stats from matplotlib import pyplot as plt import seaborn as sns from plotly import express as px import datetime as dt import os # —————————————– pd.options.display.float_format = ‘{:,.2f}’.format pd.options.display.max_rows = 1000 pd.options.display.max_columns = 1000 #——————————————- sns.set() stock_detail = pd.read_csv(“stocks.csv”) start_date = ‘2011-01-01’ end_date = dt.datetime.now().date() stocks1_detail = stock_detail.set_index(‘Date’) stocks1_detail.head(10) per_returns = stocks1_detail.pct_change().dropna() !pip install PyPortfolioOpt sum(hrp_stock_detail.values()) from pypfopt.discrete_allocation import DiscreteAllocation, get_latest_prices
latest_stock_price_detail = get_latest_prices(stocks1_detail ) da_hrp1_value = DiscreteAllocation(hrp_stock_detail, latest_stock_price_detail, total_portfolio_value=10000)
allocation_detail, leftover_detail = da_hrp1_value.greedy_portfolio() print(“Discrete allocation (HRP) value:”, allocation_detail) print(“Remaining Funds (HRP) value: ${:.2f}”.format(leftover_detail)) from pypfopt.efficient_frontier import EfficientCVaR from pypfopt.expected_returns import mean_historical_return stock_detail = pd.read_csv(“stocks.csv”, index_col=0) stock_detail = stock_detail.apply(pd.to_numeric) plt.figure(figsize=(15, 6)) for i in range(stock_detail.shape[1]): plt.plot(stock_detail.iloc[:,i], label=stock_detail.columns.values[i]) plt.legend(loc=’upper left’, fontsize=12) plt.ylabel(‘Stock Price in $’) plt.show() mur_value = mean_historical_return(stock_detail) T = stock_detail.cov() ef_cvar_value = EfficientCVaR(mur_value, T) cvar_weight_value = ef_cvar_value.min_cvar() cleaned_weights_value = ef_cvar_value.clean_weights() print(dict(cleaned_weights_value)) expected_value_return = np.mean(ef_cvar_value.expected_returns) * 100 print(round(expected_value_return, 2)) np.seterr(invalid= ‘ignore’) da_cvar1_value = DiscreteAllocation(cvar_weight_value, latest_stock_price_detail, total_portfolio_value=10000) allocation_detail, leftover_detail = da_cvar1_value.greedy_portfolio() print(“Discrete allocation value(CVAR):”, allocation_detail) print(“Remaining Fund(CVAR): ${:.2f}”.format(leftover_detail)) stock_detail.index = pd.to_datetime(stock_detail.index)
# annualized returns ind_er1_value = stock_detail.resample(‘Y’).last().pct_change().mean() ind_er1_value = ind_er1_value.to_frame()
print(ind_er1_value) ann_sd1_value = stock_detail.pct_change().apply(lambda x: np.log(1+x)).std().apply(lambda x: x*np.sqrt(252)) ann_sd1_value assets1_value = pd.concat([ind_er1_value, ann_sd1_value], axis=1) assets1_value.columns = [‘Returns_value’, ‘Volatility_value’] assets1_value p_ret_value = [] p_vol_value = [] p_weight_value = [] num_asset_value = len(stock_detail.columns) num_portfolio_value = 10000
cov_matrix_form = per_returns.cov() for portfolio in range(num_portfolio_value): weights1_value = np.random.random(num_asset_value) weights1_value = weights1_value/np.sum(weights1_value) p_weight_value.append(weights1_value) returns = np.dot(weights1_value, ind_er1_value) p_ret_value.append(returns) var = cov_matrix_form.mul(weights1_value, axis=0).mul(weights1_value, axis=1).sum().sum() sd = np.sqrt(var) ann_sd1_value = sd*np.sqrt(250) p_vol_value.append(ann_sd1_value) stock_data = {‘Returns’: p_ret_value, ‘Volatility’: p_vol_value} num_col = len(stock_detail.columns)
if len(p_weight_value) == num_col: for counter, symbol in enumerate(stock_detail.columns.tolist()): stock_data[symbol + ‘ weight’] = [w[counter] for w in p_weights] portfolios = pd.DataFrame(stock_data) else: print(“Error: in stocks length of p_weight_value does not match the number of columns “) stock_data = {‘Returns’: p_ret_value, ‘Volatility’: p_vol_value} fig, ax = plt.subplots() ax.boxplot(stock_detail)
ax.set_xticklabels([‘Velocity’, ‘Returns’, ‘Stock_1’, ‘Stock_2’, ‘Stock_3’, ‘Stock_4’, ‘Stock_5’, ‘Stock_6’, ‘Stock_7’]) ax.set_title(‘Box plot of stock detail data’)
plt.show() cleaned_weights_value = ef_cvar_value.clean_weights() weights1_value = [v for v in cleaned_weights_value.values()]
# pie chart labels = [k for k in cleaned_weights_value.keys()]
# pie chart fig, ax = plt.subplots() ax.pie(weights1_value, labels=labels, autopct=’%1.1f%%’)
ax.set_title(‘Portfolio Composition for data’)
# Show plot plt.show()
returns = stock_detail/stock_detail.shift(1) year = 3 cagr_value = (stock_detail.iloc[-1]/stock_detail.iloc[0])**(1/year) – 1 cov_value = returns.cov() print(cagr_value) print(cov_value) def random_weights(n): k = np.random.rand(n) return k / sum(k) exp_return = [] sigma = [] for _ in range(20000): w = random_weights(len(stocks.columns)) exp_return.append(np.dot(w, cagr.T)) sigma.append(np.sqrt(np.dot(np.dot(w.T, cov), w))) plt.plot(sigma, exp_return, ‘go’, alpha=0.1)
plt.show(); monthly_return_value = stock_detail.resample(‘M’).last().pct_change()
cumulative_return_value = (1 + monthly_return_value).cumprod()
cumulative_return_value.plot.area(figsize=(7, 5))
plt.xlabel(‘Date’) plt.title(‘Cumulative Returns’)
plt.show()
|
Appendix B
Know more about UniqueSubmission’s other writing services:
