AAF040-6 Financial Markets and Portfolio Management Assignment Sample
Module code and Title: AAF040-6 Financial Markets and Portfolio Management Assignment Sample
Introduction
The significance of the financial market plays quite a vital role in the facilitation of smooth functioning of the capitalist economies by the allocation of the resources and the creation of the entrepreneur’s and businesses’ liquidity. In this report, 4 companies are selected that are listed under the LSE “London Stock Exchange”, “St. James’s Place, plc Royal Mail plc, 3i Group plc, and abrdn plc”.
This entire firm’s historical data are collected for 3 years on daily basis and then the computation is done concerning the average price, mean returns, covariance relationship, beta, etc. After that, the use of solver computation in regard to minimum variance portfolio, etc is done.
Section 1
1. Share price performance
abrdn plc
| Average Share’s Price | 237.7033 |
| Average returns | -2% |
| lowest price | 144.4241 |
| Highest price | 303.3644 |
Table 1: Computation of abrdn.l (Source: self-made)

As per the above table 1, it can be seen that for the firm “Abrdn Plc”, the computation on its stock price, and daily return is done for understanding the performance of the share price of this firm. It is known that 10% can be taken as average and here the price is 237.7.33 which depicts the firm trading per day is quite high.
But in the case of the average return based on the daily returns the average needs to be 10% or more. but here it’s a negative figure, hence the rate is too low. As per the analysis, it can be said the firm share performance is quite low(Abdullah et al. 2019).
3i Group plc
| Standard/ Share Price | 1079.728756 |
| Standard return | 0.54724835 |
| lower price | 559.292419 |
| Higher price | 1503.5 |
Table 2: Computation of III.l (Source: self-made)
The stock price analysis has been done in this section as per the average stock price of the IILI to find out the efficiency of the company to provide the return on the investment (Syafii et al. 2020).
However, the average price of the company has been taken as £1079.72 which defines the overall standard return on the stock price. It also has been identified that the company has the standard return of 0.54% as per the computation. The higher price and the lower price of the stock have also been presented in the table as £559.29 as the lower price and £1503.5 as the lower price of the stock value.
Royal Mail plc
| Average retail price | 304.1425597 |
| Average return | 0.179016956 |
| low price | 117.125504 |
| High price | 571.399109 |
Table 3: Computation of RMG.L (Source: self-made)
The average price of the Royal mail plc has been presented in the above tables to get an idea about the growth rate in the share price of the company. However, the average value of the share has been identified as £304.14 along with the average return of 0.17% which represents the decision of making the investment in the company.
The high price and the low price of the company have also been presented in the table to find out the performance of the company (Jianu and Jianu, 2018). Moreover, it can also be stated that the highest price of the company has been identified as £571.39 which represents that the company has a better capability of providing the return.
St. James’s Place plc
| Average consumer price | 1105.597569 |
| Average return | 0.556102684 |
| Stunted price | 573.449524 |
| Elevated prices | 1678.291016 |
Table 4: Computation of STG.L (Source: self-made)
Averaging up the share price can be identified as an attractive strategy for taking advantages of the momentum throughout the rising market as the investor believes that the stock price of the company will be raised. However, in this scenario, the average share price of the company has been presented along with the average return on the investment.
The avg share price of STGL has been identified as £1105.59 which defines the company as having the higher prices of their shares as compared with the other chosen companies. Moreover, the lowest and the highest share prices of the company have also been presented to know about the potential growth and decline in the stock price.
2. Covariance and correlation between the stocks
Correlation
| “abrdn plc” | “3i Group plc” | “Royal Mail plc” | “St. James’s Place plc” | |
| “abrdn plc” | 1 | |||
| “3i Group plc” | 0.353141718 | 1 | ||
| “Royal Mail plc” | 0.455960537 | 0.819600649 | 1 | |
| “St. James’s Place plc” | 0.358463133 | 0.916336851 | 0.900311274 | 1 |
Table 5: Computation of correlation (Source: Self-made)
In the above table 5, the enumeration is done by taking into consideration the stock price of all the 4 firms. Here the correlation is computed as it can guide in revealing the important relationship between the firms present or mentioned here. The greater the value of correlation, the stronger the relationship is among both the variables or in this scenario both the firms.
Thus, it can be said as “abrdn plc” and “3i Group Plc”, has a correlation at 0.3531 they have a strong relation., the strongest among them is among “3i Group Plc” and “St. James Place Plc” at 0.91633 approximately.
Covariance
| “abrdn plc” | “3i Group plc” | “Royal Mail plc” | “St. James’s Place plc” | |
| “abrdn plc” | 758.6402806 | |||
| “3i Group plc” | 1896.805475 | 38004.55446 | ||
| “Royal Mail plc” | 1710.915124 | 21758.21096 | 18544.11593 | |
| “St. James’s Place plc” | 2735.546623 | 49476.45779 | 33956.37956 | 76709.87028 |
Table 6: Computation of covariance (Source: Self-made)
In regard to the above-provided table 6, the covariance is computed among each of the variables/companies. The reason for doing this is that it helps in increasing the precision of the trials and the adjusted attempts for the sources of the bias in the studies that are observational (Dordi and Weber, 2019).
The “St James’s Place Plc”, has the highest covariance with “3i Group plc”, other than itself, hence it can be said that the SJP, L has a stronger relation with “3i Group Plc”, in contrast to the others. The others, it is depicted in the table above.
3. Calculation of beta for each company stock
| Companies | Standard Deviation | Benchmark STDEV | Beta |
| “abrdn plc” | 12.0162481 | 14.82 | 0.81 |
| “3i Group plc” | 20.5131725 | 25.86 | 0.79 |
| “Royal Mail plc” | 7.184698239 | 9.54 | 0.75 |
| “St. James’s Place plc” | 21.3436967 | 24.56 | 0.87 |
Table 7: beta calculation (Source: self-made)
Beta computation is utilized for dividing the covariance product of the market and security returns from the market return variance over a certain period (Raza et al. 2021). The above provide table 7, is made for comparing the beta among the firm, and which one is better. As it can be seen that the standard deviation is computed here for the firm, on the daily return and the benchmark is the firm’s industry holdings.
The Beta is computed by division of the STDEV with the benchmark STDEV. Here it can be seen the highest beta is for the firm, is for “St. James Place Plc”, and the lowest is “Royal Mail Plc”, at 0.75, hence it can be said that the form “Roal plc”, it has the less riskiest project, or the stock is quite low volatile. As less than 1 beta is considered as being good and has a minimum amount of risk present.
4. Estimate the mean return of each stock
| Mean Return(MR) for “Capital Asset Pricing Model” (CAPM) [ABRDN] | |
| Particulars | Amount |
| Risk-free rate (Rf) | 2.00% |
| Market risk (Rm) | 5.6% |
| Beta (β) | 0.81 |
| Formula: Re = Rf + β (Rm – Rf) | |
| The MR | 4.92% |
Table 8: Mean return enumeration (Source: self-made)
The above table 8, the return is at 4.92%, less than the expected 10 returns.
The action that can be taken in increasing the returns can be by balancing the risks and booking the profits in time.
| Mean Return in “Capital Asset Pricing Model” (CAPM) [ABRDN] | |
| Regards | Amount |
| Risk-free rate (Rf) | 2.00% |
| Market risk (Rm) | 5.6% |
| Beta (β) | 0.79 |
| Technique: Re = Rf + β (Rm – Rf) | |
| The MR | 4.84% |
Table 9: Mean return enumeration (Source: self-made)
In table 9, the mean return is computed at 4.84%, which is less than the expected return that is 10%, this can be termed under-prized.
The suggestion for getting higher returns is by balancing the expenses and avoiding over-diversifications.
| Mean Return on “Capital Asset Pricing Model” (CAPM) [ABRDN] | |
| Elements | Amount |
| Risk-free rate (Rf) | 2.00% |
| Market risk (Rm) | 5.6% |
| Beta (β) | 0.75 |
| Procedure: Re = Rf + β (Rm – Rf) | |
| The MR | 4.70% |
Table 10: Mean return enumeration (Source: self-made)
In regard to table 10, the mean return is computed at 4.70% which is less than the expected 10%, hence it is under-prized.
The suggestion would be rebalancing and equities over the bond (Saad et al. 2020).
| the Mean Return under “Capital Asset Pricing Model” (CAPM) [ABRDN] | |
| Aspects | Amount |
| Risk-free rate (Rf) | 2.00% |
| Market risk (Rm) | 5.6% |
| Beta (β) | 0.87 |
| Method: Re = Rf + β (Rm – Rf) | |
| The MR | 5.13% |
Table 11: Mean return enumeration (Source: self-made)
As the return expected was 10% and for this firm, it is at 5.13%, hence it is under-prized.
The firm can manage its expenses, or by diversification, this action can help in increasing the returns.
Section 2
1. Critical explanation of the two stocks
The investment process plays a very important role to know about the profitability by investing into stocks of the company. Moreover, the effective analysis of the company can be done through the identification of the return that is being provided by the companies (Ghasemi et al. 2018). However, in this scenario the companies that have been selected for making the investment for getting the return at 10% are the Royal Mail plc, St. James’s Place plc, abrdn plc and the 3i Group plc.
Moreover, the effectiveness of the return has been identified through gathering the data about the efficiency and the sales of the company. Thereafter, the best two companies that have the higher return along with an continuous flow are the Royal mail plc and the abrdn plc. The decision of making the investment into these companies can be very beneficial for the client to get the effective and high return along with the lower risk association (Gercekovich et al. 2020).
However, the effectiveness of the company has been identified through gathering the statistical data along with performing the comparison between the stock prices of the companies.
The stcom price of Royal mail plc has been identified as higher among all the four companies with an value of £2,868.58 million GBP that indicates that the company has the higher return on investment. Moreover, it can also be stated that the sales and the efficiency of the company is also higher in this company that can be very beneficial for making the investment into this particular company. As per the view of Yeganegi (2018), the higher stock price and the higher revenue in the companies has the highest potential of providing the higher return on the proposed investment.
The second company which that is best for making the investment is the abrdn plc as it has the £3,901.32 million GBP price. Thereafter, it can also be stated that the company has also the higher potential for giving the higher return through the investment. On the contrary, Breault and Cleveland (2020), the lower price of the stocks and the lower profit can have a negative impact on the overall generation of the profit.
The chosen companies can provide higher return on the investment as the company has the benchmark of 14.82 on the other side the Royal mail plc has the benchmark of 9.54 which defines the profit growth of the company. However, as per the analysis of the all four companies the impact of all the colonies has been identified through gathering the data of the companies through the revenues and the stock prices of the companies (Meek et al. 2020). Thereafter, it can be stated that the investing princess must be put into the Royal Mail and the Abrdn plc for gaining the higher return on the investment.
2. Identifying the portfolio mix
The representation of the data regarding the risk and the return from the portfolio has been specified in this section. However, the decision variables have been taken to identify the volume and the stock price according to higher and lower capacity of getting the return from the investment.
“Minimum-variance portfolio” used for the maximization of the return through reducing the risk from the investments. However, the mean variances has been calculated into this section as per the beta into the recent times along with the factors of mean return and the market risks into that particular investment (Rusanen, 2019). Moreover, it can also be stated that the impact of these minimum variances has been done on the basis of the decision variables as per their higher or lower impact on the overall investment of £100,000 to get the return of 10% as per the investing decision.
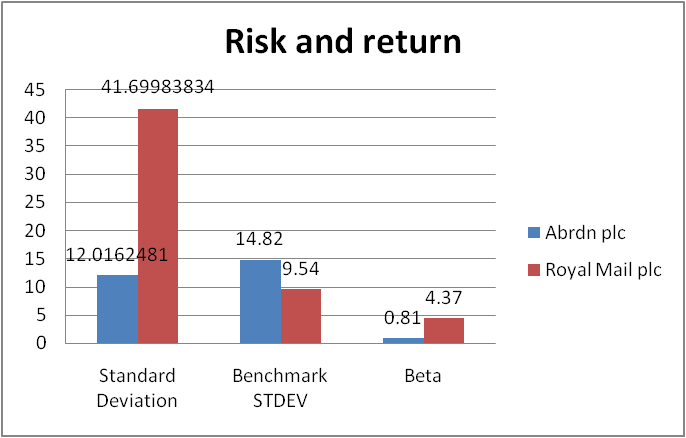 Figure: 2 Risk and return on the investment (Source: Self-Developed)
The comparison of the stocks has been done to know about the overall impact of risk and the return of investing into these companies. Moreover, the companies that had the better return on the investment have been identified as Royal mail plc and Abrdn plc as these two have the better capability. However, if the comparison is done through taking the risk and return factors, it can be stated that the Beta value of the Abrdn is lower.
However, the lower value of Beta means that the company has better visibility of getting the higher return on the investment. Therefore, it can be stated that Abrdn has the better capability of providing higher and continuous returns as per the CAPM model (Ghasemian et al. 2020). However, the identification of benchmark comparison shows that the Abrdn has the higher value as compared with the Royal mail plc that also indicates that the company has better visibility for producing the higher return. [Refer to Appendix 1]
3. Identification of best portfolio
The identification of the best portfolio can help to get the better return through the investment decision of the company. Moreover, after the identification of the profit from the investment it can be stated that the Abrdn has the better accessibility of getting the higher return from the investment procedure (Ghasemian, 2020). The company has the better capability of getting the higher return as per the comparison of variance and the standard deviation of the company.
However, it can also be stated that Abrdn has the better capability of providing the higher return on the investment as the company. Moreover, the requirement of the client can be mitigated through identifying the return on the investment of 10% that can be achieved through investing into portfolio A as per the portfolio comparison.
This portfolio suits the client best as it can provide a better enhancement to the return to the client (Kumar and Shahid, 2021). However, the property identification of the portfolio can provide several types of benefits as this company has better capability to provide the better opportunity in investment decision.
The overall increase in the portfolio can be achieved through taking the details about the effective return as Standard deviation of 6% at a growing rate that has been increased at the end at 10.08% according to the calculation of the effective portfolio analysis. [Refer to Appendix2]
4. Sharpe ratio and Jensen’s Alpha of Portfolio
The sharpe ratio of the companies has been calculated to know about the impact of the investment decision on the company. However, the impact had been given through the effective decision making of the investment decision (Forouli et al. 2019). The enhancement of ratio and the calculator has been done on the basis of the risk-free return along with the expected return of the companies.
Moreover, the data of the expected returns and the risk-free return has been taken as the 10% and 2% as per the calculation of the Sharpe ratio. Moreover, it can also be stated that the analysis of the values has been done through taking the standard deviation of the companies. In the case of the Abrdn Company the standard deviation has been calculated as 14.82 along with the sharpe ratio of 1.18% and 0.81 for the Jensen Alpha.
Moreover, the overall ratio of the share defines the overall performance of the company. Moreover, the overall data of the company has the better capability of presenting the higher return on the investment as compared with the other companies. Therefore, it can be stated that Portfolio A (Abrdn plc) has the better capability of performing the investing decisions of the company. Therefore, it can be stated that the decision to make the investment into this company has the better chance of finding a higher return throughout the period (Knollenberg et al. 2021).
Considering the Sharpe ratio of Royal Mail plc the Sharpe ratio of the company has been calculated 0.76 which shows that the investment would be less profitable for the company and hence can be ignored by the company.
A sharp ratio of greater than 1 is considered good for a company as it provides an estimate of the company’s investing approach. However, it must be kept in mind that the company must calculate the risk-free rate of return and expected rate of return. Therefore, from the comparison point of view it can be said that Abrdn plc is better as the Sharpe ratio of a company is more than 1 which shows that investing in the company will be more profitable for investors.
However, it must be kept in mind that these estimations do not guarantee that investment in these companies will surely yield profit to the company as there are several other external factors that tend to affect the profitability of a company and investor must look at other important factors to make a decision regarding whether to invest in a particular company. Jensen Alpha of Royal Mail plc has been calculated to be 1.99 which shows a positive value and hence it can be said that the risk adjusted return has delivered a great return. [Refer to Appendix 3]
Conclusion
In the end, it can be concluded by saying that the financial markets are necessary for a firm as it provides the buyer and sellers to do the trade. In this report for the investment purpose, 4 firms are considered which are listed under LSE. The Firm’s “abrdn Plc” and the “Royal mail plc”, both the firm has higher profitability in contrast to the other.
Also, both of the firm’s share price performances seem better than the other two. Here as per the benchmark of the firm’s “St. James’s Place plc” beta was the highest, depicting the stock price swinging widely, or can be said more volatile depicting the firm to underperform, in the bear market. On the other hand, Royal Mail Plc with the highest beta indicates its higher performance in the bear market.
Reference
Dordi, T. and Weber, O., 2019. The impact of divestment announcements on the share price of fossil fuel stocks. Sustainability, 11(11), p.3122.
Fiszeder, P., Fałdziński, M. and Molnár, P., 2019. Range-based DCC models for covariance and value-at-risk forecasting. Journal of Empirical Finance, 54, pp.58-76.
Forouli, A., Doukas, H., Nikas, A., Sampedro, J. and Van de Ven, D.J., 2019. Identifying optimal technological portfolios for European power generation towards climate change mitigation: a robust portfolio analysis approach. Utilities Policy, 57, pp.33-42.
Gercekovich, D., Gorbachevskaya, E. and Shilnikova, I., 2020. Identification of basic criteria of portfolio analysis based on the rolling verification principle. In AICTS (pp. 57-63).
Ghasemi, F., Sari, M.H.M., Yousefi, V., Falsafi, R. and Tamošaitienė, J., 2018. Project portfolio risk identification and analysis, considering project risk interactions and using Bayesian networks. Sustainability, 10(5), p.1609.
Ghasemian, S., Faridzad, A., Abbaszadeh, P., Taklif, A., Ghasemi, A. and Hafezi, R., 2020. An overview of global energy scenarios by 2040: identifying the driving forces using cross-impact analysis method. International Journal of Environmental Science and Technology, pp.1-24.
Ghasemian, S., Faridzad, A., Abbaszadeh, P., Taklif, A., Ghasemi, A. and Hafezi, R., 2020. An overview of global energy scenarios by 2040: identifying the driving forces using cross-impact analysis method. International Journal of Environmental Science and Technology, pp.1-24.
Jianu, I. and Jianu, I., 2018. The share price and investment: Current footprints for future oil and gas industry performance. Energies, 11(2), p.448.
Knollenberg, W., Brune, S., Harrison, J. and Savage, A.E., 2021. Identifying a community capital investment portfolio to sustain a tourism workforce. Journal of Sustainable Tourism, pp.1-17.
Kumar, A. and Shahid, M., 2021. Portfolio selection problem: Issues, challenges and future prospectus. Theoretical & Applied Economics, 28(4).
Meek, M.H., Stephens, M.R., Goodbla, A., May, B. and Baerwald, M.R., 2020. Identifying hidden biocomplexity and genomic diversity in Chinook salmon, an imperiled species with a history of anthropogenic influence. Canadian Journal of Fisheries and Aquatic Sciences, 77(3), pp.534-547.
Nakagawa, K., Imamura, M. and Yoshida, K., 2018. Risk-based portfolios with large dynamic covariance matrices. International Journal of Financial Studies, 6(2), p.52.
Pericoli, M., 2018. Macroeconomics determinants of the correlation between stocks and bonds. Bank of Italy Temi di Discussione (Working Paper) No, 1198.
Raza, H., Gillani, S.M.A.H., Kashif, M.T. and Khan, N., 2021. The impact of corporate social responsibility on share price: A systematic review and bibliometric analysis. Studies of Applied Economics, 39(4).
Rusanen, O., 2019. Crafting an omnichannel strategy: Identifying sources of competitive advantage and implementation barriers. In Exploring omnichannel retailing (pp. 11-46).
Saad, N.M., Mohamad, N.E.A. and Haniff, M.N., 2020. Relationship between Share Price and COVID Cases among All Sectors in Main Market of Bursa Malaysia. Global Business &
Saad, N.M., Mohamad, N.E.A. and Haniff, M.N., 2020. Relationship between Share Price and COVID Cases among All Sectors in Main Market of Bursa Malaysia. Global Business &
Syafii, M., Ulum, B., Suparman, P., Rahayu, D.I. and Syasindy, N.B., 2020. The Effect Of Financial Performance On The Company’s Share Price: A Case Study Indonesian. European Journal of Molecular & Clinical Medicine, 7(, pp.1055-1071.
Symitsi, E., Symeonidis, L., Kourtis, A. and Markellos, R., 2018. Covariance forecasting in equity markets. Journal of Banking & Finance, 96, pp.153-168.
Yeganegi, K., 2018. The Identification of Portfolio Attraction (Customer) Approaches; Case Study: Iran Insurance Company-Tabriz City. Case Study: Iran Insurance Company-Tabriz City (August 16, 2018).
Know more about UniqueSubmission’s other writing services:
