AAF040-6 Financial Markets and Portfolio Management Sample
1. Introduction
Portfolio analysis helps the organization develop the details about the organizational progress in the share markets and provides suggestions to the investors to make the decision to continue the research into the global market. The diversion of the portfolio develops the details about the organization to find out its scope and the advantages that help the organization to maintain the progress in the investment appraisal activity (Demir, 2019). In this research, the two chosen organizations are Tesco and Shell plc and both of the organizations belong to two different sectors but are listed on the London stock exchange. This research critically evaluates the portfolios of the two chosen organizations to understand the better profitable options. These methods are used in this research to develop the details about the organization to add its development practice in the global market to maintain the profitable outcome that can be used in this research to control the development practices. That is used in this research to maintain the progress of this research.
This research chose the stock options of Tesco and Shell plc to develop daily time series with graphical representation. In order to do this decision-making activity the chosen organization critically evaluates the details about the organization to maintain the quality management in this research to increase the quality details of this research. The main aim of this research is to develop knowledge about the systematic approaches in financial activity. This report provides the optimum investment weights and completed the maximum measurement in this research. This research demonstrates the following knowledge and understanding of the role of the financial markets. This research also develops the details about the portfolio analysis and develops the financial portfolio to find out the minimum risk and required return.
2. Identification of rationale for chosen stocks
In this research, the chosen stock has been chosen as Tesco and the daily time series has been measured in this research to develop the details about the organization to maintain the development. The chosen stocks have been chosen in its research on the basis of the “preferably diverse and less-correlated industries”.

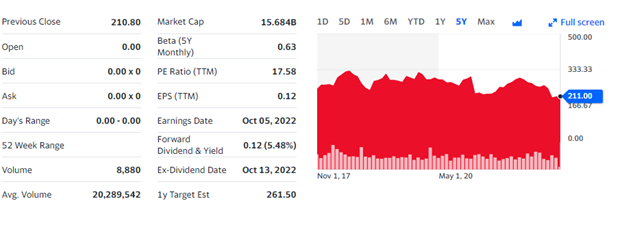
Figure 1: TESCO plc’s share value
(Source: Finance.yahoo.com, 2022)
In this research, Tesco is the first chosen organization and this organization is dealing with the retail business in the UK. This organization operates its business all over the world and is able to generate profitability by using online marketing (Karmiani et al. 2019). The market capitalization of Tesco is 15.226 billion and able to maintain a huge number of sales from all over the UK (Tesco.com, 2022). This organization was established in 1919, in the East End of London and now the organization is able to operate 4,673 shops in the UK to maintain its business. This organization is a large retail chain that aims to support the daily lifestyle of the citizens of the UK by providing various different products to their needs.
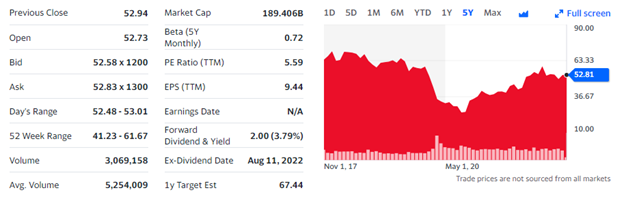
Figure 2: Shell plc’s share value
(Source: Finance.yahoo.com, 2022)
The other chosen organistaion is Shell plc and it is a huge oil and gas manufacturing and tech supply company in the world. This organization was established in 1912, in the US and currently continues the business successfully across the world. SHELL plc has been developing its business carefully and is able to maintain 182.97 Billion US dollars as its market capitalization (Shell. in, 2022). This organization fully focussed on the low carbon imitation in the production department to support the environment. Shell plc have maintained two most important ethics hats, honesty and integration and that support this organization to maintain productivity in the global market to enhance its profitability from the global market. The main strength of this organization is that shell plc maintains the quality of production to provide better
3. Discuss the daily time series graphical representation data
Presentation of daily time series data
Figure 3: Return of Shell Plc and Tesco Plc.
(Source: Self-created)
The return of Tesco and Shell plc has been mentioned in this research to develop the details about the organisation to maintain the development in the shares. This research provides support and investigation about the growth rate of the return of both organizations to develop the details about the organization to maintain the progression of the share market (Bahers et al. 2020). This figure shows that shell plc is able to maintain the quality of the management where the other organization is now facing a decrease of the stock valuation in this research to maintain the quality knowledge to the investors. in this calculation, the values of the adjusted close have been mentioned from 2020 to 2022 to find out the better result in the calculation.
The value of the adjusted close of the shell is 47.232 in 2020, whereas the Tesco valuation of the adjusted close in 2020 is at 256.642. The adjusted close of shell plc in 2022is £54.44, whereas Tesco is able to maintain £204.60 (Finance.yahoo.com, 2022). The high adjusted close value definite a good position in the global market. After this research, it can be said that Tesco is doing well compared to Shell plc. After this research, it can be said that Tesco is doing great to maintain its share prices in the global market to develop its organizational position in the share markets.
Calculation of key summary statistics
The calculation of the descriptive statistics can be used in this research to develop the details about the organizational analysis of this search. Descriptive statistics is important data that has been used in this research to develop an understanding of the statistical analysis that has been used in this organization to maintain the progress in share market analysis (Devpura and Narayan, 2020). This research develops the details about the two most different shares and their stock analysis that has been used in this research to maintain the progress in the global markets. Descriptive statistics is a tool that has been used in this research to develop the progress of statistical reports. It is able to provide various factors that help the organization to maintain progress in the global market by developing the idea about the condition.
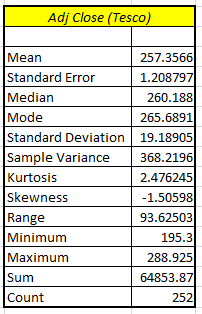
Figure 4: Descriptive statistics of Tesco.
(Source: Self-created)
After this research, it can be said that descriptive statistics can develop the details about the organization to maintain quality management in this research to develop the details about the organizational development. The descriptive statistics of Tesco can help the investors to develop the details about the organization to maintain its progress in the global market to develop the details about its progress (Sharma, 2020). The descriptive statistics presents the “mean” 50.6569, “Median” 51.67,”Mode” 42.06382, and “Standard Deviation” 4.646303. The other factors are also measured in this research like “Range”20.12476, “Minimum” 40.846, “Maximum” 60.97076, “Sum” 12816.2, and “Count” 253 are also provided in this research. After this calculation of the data analysis, it s find out the maximum values of the stocks were 288.925, the average or mean is 257.35 at the lowest values are 195.3.
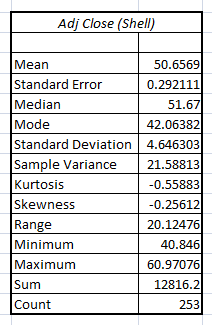
Figure 5: Descriptive statistics of Shell
(Source: Self-created)
The descriptive statistics of Shell plc are also mentioned in this research to find out the details about the statistical data of the stocks. the important factors of the statistical data are “Median” 260.188, “Mode” 265.6891, and “Standard Deviation” 19.18905.other importnet data are “Range” 93.62503, “Minimum” 195.3, “Maximum” 288.925, “Sum” 64853.87, and “Count” 252. After this calculation of the data analysis, it s find out the maximum values of the stocks are 60.97, the average or mean is 50.65 ad the lowest values are 40.84
Calculation of expected annual return using “annualized return” and “Single-index model”
The annual return rates are an important factor that determines the details about the organizational progress in the global market to develop the idea about the organizational developments. After the calculation, it can be said that the annual rate of return of both Tesco and Shell plc are 8% and 15% respectively. The weights of both organization stocks are respectively 34% and 66% and it can be said that Shell plc has a better position in the annual return or share weight in the share market compared to Tesco.
4. Calculation of optimum investment weights
“Optimum investment weights”
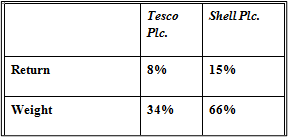
Figure 6: Both organisation’s weights value
(Source: Self-developed)
The weights of the portfolio are mainly referring to the portfolio of investment which is mainly related to the percentage value. It is mainly held and also holds a kind of compromise. It is not normally referred to and related to the determination of the findings to the weights of the assets by dividing the value of dollars by the portfolio dollar total value (AL-Badran, 2018). It has also been designed with the “Risk and returns” on the basis of perfect balance. The portfolio optimum value has been searched and looked at and accepted the value of securities and risks which has been offered with the possibilities of the highest value with accepted the risk value.
It has also shown the highest securities and also the reduced lower risk value related to the “Expected rate of return”. It has shown 3% related to Tesco plc and 10% for Shell plc. Therefore, with the effect of that, it has been shown that the expected return value of Shell plc is greater as compared with Tesco (Wang et al. 2020). However, it can be shown that Shell plc has better performance in the portfolio as it is different from Tesco.
“Mean-variance efficient portfolio”
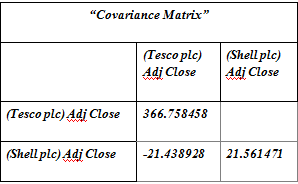
Figure 7: “Mean-variance and optimum ratio”
(Source: Self-developed)
It is the tool that is mainly related to the investors who utilize it in spreading the risk in its portfolio. In measuring the investors, assess the risk and express the variances. It compared with the likely return assets and goal related to the optimization mean-variance. Along with that, it has been optimized to maximize the reward of investment based on the risk value. Mean and also variance is mainly measuring the central dispersion (Fang et al. 2019). It is the main provided average in setting the numbers with the squared average comparison from the mean is the variance.
The central dispersion has told us in the process of taking for the scattered observation and also distributed. It can be seen that the adjustment value of Tesco has shown at -21.43 times and shell plc’s adjustment close value has shown at the value of 21.56 times. However, it can be observed that shell plc’s value has shown to be higher as compared with Tesco. The mean-variance is significant in the way of measuring and also calculating the individual data set numbers (Tang et al. 2019). It is needed by using the techniques of mathematics like arranging the numbers of quartiles. The main advantage is related to the treated variances with deviations from the mean value.
In the statistics, the variance was used in determining the messing process in the data for the mean variation. For example, it has indicated higher variance with more inside-range data. The scientist spreading out with the number which has shown related to the variances given with spread standard and rough deviation is more concrete (Khakbaz et al. 2020). Therefore, with the effect of that, it has provided the exact mentioned numbers in the way of distancing the median, mode, and mean valuation.
“Combination of risk-return”
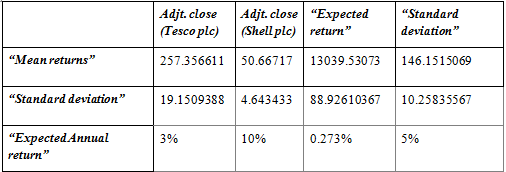
Figure 8: calculation of “expected rate of annual return value ”
(Source: Self-developed)
It can be seen that the above-mentioned table has mentioned the “expected rate of annual return”. However, it can be observed that Tesco plc’s expected return has indicated the 3% value and also 10% for Shell plc. The expected rate of return has been mentioned as greater on shell plc as compared with Tesco plc. It is major for the investors messaging to be applied to the organizations (Oluwapelumi, 2021). Thus, with the effect the company is capable of getting the profit of the organization. Once the investors have received and invested around the estimated value return which can be planned for a better operational course.
It is generally dependent on the findings which can be shown in the above-mentioned table. The “Standard deviation (SD)” is important in the way of data measuring that can be distributed. The data is more distributed with a greater value which can be shown in standard deviation. It can be measured with the dispersing process in the data related to the mean value (Tan et al. 2020). However, shell plc has shown a greater value related to the SD as differentiated from Tesco plc. Moreover, the lower value of SD has been shown as measured in the data in relation to the Tesco value (Murthy, 2019). They mainly referred to the clustered value with the mean value. Therefore, with the effect of that, the greater value of higher deviation standard value has shown in the major spreading out.
Efficient Frontier
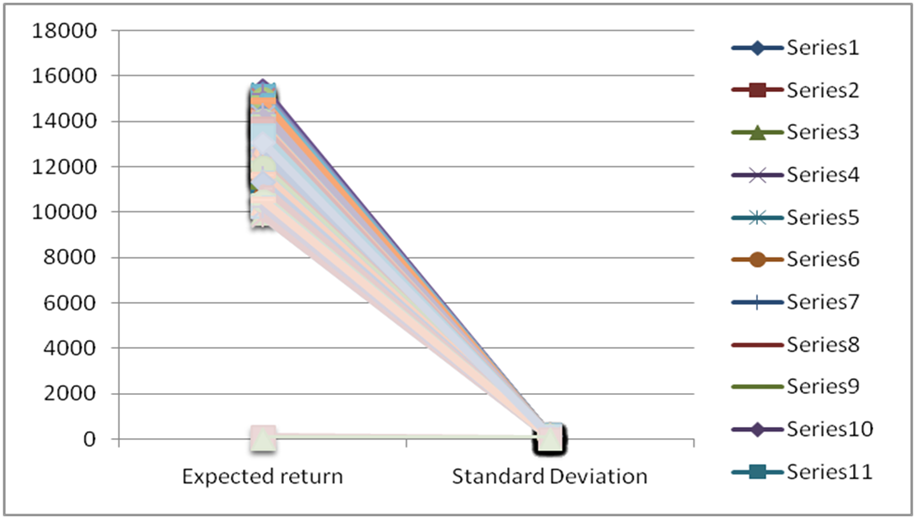
Figure 9: Expected return and SD efficient frontier
(Source: Self-developed)
The efficient frontier value is mainly dependent on the set of investment portfolios. However, it is mainly dependent and expected with the provided highest given risk level return. The portfolio is set to be more efficient at the time of shown maintained portfolio value (Zhang et al. 2021). The portfolio is more efficient which has shown no other kind of portfolio that offers the highest return for the higher and equal return on the risk amount. It is more efficient frontier value rates in the portfolio that have been encouraged and coordinated with the plan. It has been shown and plotted with the X-axis value which is related to the SD and expected return.
5. Identification of the metrics of performance measurement
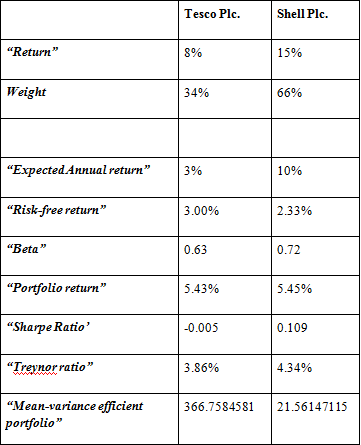
Figure 10: Determine the value of “The Sharpe Ratio”, “Treynor Ratio”, and “Mean-variance efficient portfolio”
(Source: Self-developed)
As above mentioned in figure 10, the “Sharpe Ratio” is mainly shown as a differentiation between the “return of investment” and “Risk added in such investment”. Therefore, with the effect of that, it can be stated that this research can be recognised and determined with added risk in both the organization inside building the investment (Soleymani and Paquet, 2020). The Tesco Sharpe ratio has shown at -0.005 times on Shell plc has shown the ratio at 0.109 times. Hence, with the effect of that, it can be shown that Tesco has more risks in the way of making inside the shell’s value that it has less risk as compared to Tesco.
“Treynor ratio” is referred to the metric performance utilized in determining the capability-related organization (Aslam et al. 2021). It has created excess in return with each of the units in risks related. It has been obtained with a portfolio and based on the exam based on ratio used can assist in recognising Tesco more capability in creating a higher return or shell plc. In the value of Tesco, The “Treynor ratio” indicates a value of 3.86% inside the shell plc ratio. It has shown at the 4.34% value as per the basis of research identified on the Treynor ratio related to the shell. It is more than the Tesco ratio which can be assisted in recognising the shell is more efficient in way of generating profit in each of the obtained risk units (Saputra, 2022). “Mean-variance efficient portfolio” is significant in the way of determining the investor. Along with that, it can be utilized as a way of spreading portfolio risk (Adekoya and Oliyide, 2021). Therefore, with the effect of that, it measured the risk of the asset which has expressed with the variance related to the expected return on investors. Moreover, it used the examination related to the mean-variance for investors to make decisions.
Providing advice to the investors
As per the basis of the previous decision made on the value of Tesco stock price is more than shell plc. According to Singhal et al. (2019), It has stated that investors can get more returns by creating decisions with their company. Along with that, it has assisted in recognising Tesco’s “annual expected return” at the value of 3% inside the shell plc has shown at 10% related with “Expected Annual Return”. The data has shown that the enhanced value capability relates to investors in creating for return with making with Shell’s investment. Moreover, Tesco’s Sharpe ratio has shown lower risks with making better investments in shell plc. It shows the investors can create fewer risks by generating the investment in the shell plc. Lastly, shell plc related to the Treynor ratio” is more than Tesco which shows the enhancement of Tesco’s capability in creating an excess return. Alternatively, it has shown in the research for the investors which can be selected with shell’s plc in investing funds in order in creating enhanced profit and return as well.
6. Conclusion
It can be concluded from the results of the above calculation such as “mean-variance efficiency, optimal investment weights, and also Jensen’s alpha”. It can be said that shell’s plc performance is much better as it is different from Tesco plc. Therefore, with the effect of that, the outcome has shown in the “Treynor ratio, shape ratio, mean-variance”, and also the weights of investment. These calculations help the individual in determining clear findings with set off a better decision. The daily time series graphical representation can provide huge support that has been ensured in this research to develop a summary of both organizational performances at a glance. The calculation has been completed with historical data that has been gathered from authentic sources. The “Single-index model” is the simple pricing asset model determined by both stock return and risks. It is the model which has been developed by utilizing suitable and accurate data from companies such as Shell plc and Tesco.
This research has suggested investors in making an investment in shells for the purpose related to creating positive returns and profits. It can be said that Shell plc has a better position in the annual return or share weight in the share market compared to Tesco. Descriptive statistics have been mentioned in the research to develop the details about the stock market’s development in this research. Descriptive statistics provide various data at the rate used in this research to measure the statistical measurement about progress of their growth. In this research, the organization has mentioned the development factors that are used in the research to maintain the progression of the global markets. The statistical tools like mean, median, mode, average, and range, maximum, minimum have been understood by completing the descriptive statistics in this research.
Reference list
Adekoya, O.B. and Oliyide, J.A., 2021. How COVID-19 drives connectedness among commodity and financial markets: Evidence from TVP-VAR and causality-in-quantiles techniques. Resources Policy, 70, p.101898.
AL-Badran, O.R.A., The Optimal Portfolio of Investment in Banks and How to Manage Them: Study and Analysis of Iraqi Banks 2010-2018.
Aslam, F., Ferreira, P., Mughal, K.S. and Bashir, B., 2021. Intraday volatility spillovers among European financial markets during COVID-19. International Journal of Financial Studies, 9(1), p.5.
Bahers, J.B., Tanguy, A. and Pincetl, S., 2020. Metabolic relationships between cities and hinterland: a political-industrial ecology of energy metabolism of Saint-Nazaire metropolitan and port area (France). Ecological Economics, 167, p.106447.
Demir, C., 2019. Macroeconomic determinants of stock market fluctuations: The case of BIST-100. Economies, 7(1), p.8.
Devpura, N. and Narayan, P.K., 2020. Hourly oil price volatility: The role of COVID-19. Energy Research Letters, 1(2), p.13683.
Fang, M., Tan, K.S. and Wirjanto, T.S., 2019. Sustainable portfolio management under climate change. Journal of Sustainable Finance & Investment, 9(1), pp.45-67.
Karmiani, D., Kazi, R., Nambisan, A., Shah, A. and Kamble, V., 2019, February. Comparison of predictive algorithms: backpropagation, SVM, LSTM and Kalman Filter for the stock market. In 2019 Amity International Conference on Artificial Intelligence (AICAI) (pp. 228-234). IEEE.
Khakbaz, S.B., Shahhoseini, M.A., Divandari, A. and Rabiee, H., 2020. Dynamic Product Portfolio Management Modeling for the Financial Technology Industry. Iranian Journal of Finance, 4(3), pp.49-79.
Murthy, S.R., 2019. Excel-Based Financial Modeling for Making Portfolio Management Decisions. Information Management and Business Review, 11(2 (I)), pp.35-41.
Oluwapelumi, O.S., 2021. THE EFFECTS OF MONETARY POLICY ON PORTFOLIO MANAGEMENT IN THE NIGERIAN BANKING INDUSTRY. European Journal of Accounting, Finance and Investment, 7(7).
Saputra, F., 2022. Analysis of Total Debt, Revenue and Net Profit on Stock Prices of Foods And Beverages Companies on the Indonesia Stock Exchange (IDX) Period 2018-2021. Journal of Accounting and Finance Management, 3(1), pp.10-20.
Sharma, S.S., 2020. A note on the Asian market volatility during the COVID-19 pandemic. Asian Economics Letters, 1(2), p.17661.
Singhal, S., Choudhary, S. and Biswal, P.C., 2019. Return and volatility linkages among International crude oil price, gold price, exchange rate and stock markets: Evidence from Mexico. Resources Policy, 60, pp.255-261.
Soleymani, F. and Paquet, E., 2020. Financial portfolio optimization with online deep reinforcement learning and restricted stacked autoencoder—DeepBreath. Expert Systems with Applications, 156, p.113456.
Tan, X., Sirichand, K., Vivian, A. and Wang, X., 2020. How connected is the carbon market to energy and financial markets? A systematic analysis of spillovers and dynamics. Energy Economics, 90, p.104870.
Tang, Y., Xiong, J.J., Luo, Y. and Zhang, Y.C., 2019. How do the global stock markets Influence one another? Evidence from finance big data and granger causality directed network. International Journal of Electronic Commerce, 23(1), pp.85-109.
Wang, W., Li, W., Zhang, N. and Liu, K., 2020. Portfolio formation with preselection using deep learning from long-term financial data. Expert Systems with Applications, 143, p.113042.
Zhang, Y.J., Bouri, E., Gupta, R. and Ma, S.J., 2021. Risk spillover between Bitcoin and conventional financial markets: An executive-based approach. The North American Journal of Economics and Finance, 55, p.101296.
Websites
Finance.yahoo.com, 2022, Shell plc, Available at: https://finance.yahoo.com/quote/SHEL?p=SHEL, [Accessed on: 26th October 2022]
Finance.yahoo.com, 2022, Tesco plc, Available at: https://finance.yahoo.com/quote/TSCO.L?p=TSCO.L, [Accessed on: 26th October 2022]
Tesco.com, 2022, “Company back ground of Tesco”, Available at:https://www.tesco.com/. [Accessed on: 26th October 2022]
Shell.in, 2022, “company back ground of shell”, Available at:https://www.shell.in/. [Accessed on: 26th October 2022]
Know more about UniqueSubmission’s other writing services:
