ACC4029 Managing Operations and Finance 2023
QUESTION 1
MANAGEMENT ACCOUNTING:
The management accountant are responsible for collecting, recording and presenting the data in the required format to the management. The collect the multiple types of data from multiple units of the organization and report the same to the management. They compare the variances with the budget and report the variances to the top management.
They also collect the reasons for the variances through which the management can take appropriate decisions. They support the management with the required data to take appropriate decision related to production, marketing, operation, sales and investment. They help in increasing the profit and optimizing the cost.
Management Accountant is responsible for the budget. Budge is a guideline for the company’s next year income and expenses. With the help of management accounting, the promoters can pass on the next year’s topline target and the expenses that are to be incurred for the same. Management accounting thus it helps in guiding the company to the next level. Management accounting also helps in measuring the efficiency of the organization and plays a major role in meeting the same.
MANAGEMENT ACCOUNTING AND FINANCIAL ACCOUTING:
CVP Analysis or P/V Analysis:

CVP Analysis is the acronym of Cost Volume Profit analysis. CVP is the part of management accounting. CVP analysis helps the management to understand the types of cost, their implication and the volume that they have to attain to achieve the breakeven point or to achieve the desired profit level. It also helps us to understand the best sales mix for the company that yields higher profit.
Given Input:
Contribution per Unit = SP / Unit – VC / Unit
= £ 200 – £ 150
= £ 50
The company has to manufacture and sell 2,00,000 units to make a profit before tax of £7,500,000.
QUESTION 2:
CAPITAL INVESTMENT APPRAISAL TECHNIQUE:
The company’s invest a huge quantum of money in their projects which has got a longer time frame and the management is interested to know whether those projects that they choose are the right ones or not. The Capital Investment Appraisal Technique are the management accounting techniques used to access the investment in a new machine, new project or a new company.
The PV of the Capital Investment Appraisal Techniques helps to compute the current value of the cash flows that arrives in future at some discounting rate. The discounting rate might be fixed by the management or it can be the cost of capital where we have found the weighted average. The project which has got a higher present value is considered for the investment.
The NPV is the total sum all cash flows at today’s price. If the NPV is greater than zero, then the function is viable for investment. If not, it means that the project is not able to get back the invested amount and we say that the project has to be rejected.
Payback Period is the time period in which the company can take back the invested money from the project. The shorter the duration, it is better. If the duration is longer, it means that there is higher possibility of the projection being misled or it may not be achieved. Hence, the Payback Period suggests that the project with lower time frame is considered.
The future cash flows are brought back to today’s value by considering some rate to adjust for the timing of the cash flows. Post discounting, the Payback Period is computed with the discounted cash flows. Thus it is called as Discounted Payback Period:
NET PRESENT VALUE:
| Cash flow (in Mil) | Prop-1 | Prop-2 | Prop-3 | Prop-4 |
| Year-0 | -£ 24.00 | -£ 19.00 | -£ 16.00 | -£ 32.00 |
| Year-1 | £ 16.00 | £ 2.00 | £ 6.00 | £ 6.00 |
| Year-2 | £ 12.00 | £ 8.00 | £ 8.00 | £ 10.00 |
| Year-3 | £ 8.00 | £ 8.00 | £ 6.00 | £ 18.00 |
| Year-4 | £ 4.00 | £ 12.00 | £ 6.00 | £ 16.00 |
| Year-5 | -£ 8.00 | £ 10.00 | £ 4.00 | £ 12.00 |
| Residual value | £ – | £ – | £ – | £ 8.00 |
| Net Present Value | £ 4.24 | £ 9.85 | £ 7.16 | £ 13.62 |
The Net Present Value of Proposal 4 is found to be £13.62 Million which is much higher than the other projects. Thus as per NPV Proposal 4 is preferred.
PAYBACK METHOD:
| Cash flow (in Mil) | Prop-1 | Prop-2 | Prop-3 | Prop-4 |
| Year-0 | -£ 24.00 | -£ 19.00 | -£ 16.00 | -£ 32.00 |
| Year-1 | £ 16.00 | £ 2.00 | £ 6.00 | £ 6.00 |
| Year-2 | £ 12.00 | £ 8.00 | £ 8.00 | £ 10.00 |
| Year-3 | £ 8.00 | £ 8.00 | £ 6.00 | £ 18.00 |
| Year-4 | £ 4.00 | £ 12.00 | £ 6.00 | £ 16.00 |
| Year-5 | -£ 8.00 | £ 10.00 | £ 4.00 | £ 12.00 |
| Residual value | £ – | £ – | £ – | £ 8.00 |
| Pay Back Period | 1-Year and 8-Month | 3-year and 1-Month | 2-Year and 4- Month | 2 Year and 11- Month |
If we go with the Payback Method, the Proposal 1 is considered to be the best proposal for the investment. The reason being Proposal 1 has got the lowest payback period of 1 Year 8 Month which is lower than the other projects.
DISCOUNTED PAYBACK METHOD:
| Cash flow (in Mil) | Prop-1 | Prop-2 | Prop-3 | Prop-4 |
| Year-0 | -£ 24.00 | -£ 19.00 | -£ 16.00 | -£ 32.00 |
| Year-1 | £ 14.56 | £ 1.82 | £ 5.46 | £ 5.46 |
| Year-2 | £ 9.96 | £ 6.64 | £ 6.64 | £ 8.30 |
| Year-3 | £ 6.00 | £ 6.00 | £ 4.50 | £ 13.50 |
| Year-4 | £ 2.72 | £ 8.16 | £ 4.08 | £ 10.88 |
| Year-5 | -£ 4.96 | £ 6.20 | £ 2.48 | £ 7.44 |
| Discounted Payback Period | 2 Years | 3 Year 6 Months | 3 Years | 3 Years 5 Months |
From the above table, it is evident that the Proposal 1 has got the lowest Discounted Payback Method. That is the invested money can be taken back in 2 years as per the Discounted Payback Method.
INTERNAL RATE OF RETURN:
| Cash flow (in Mil) | Prop-1 | Prop-2 | Prop-3 | Prop-4 |
| Year-0 | -£ 24.00 | -£ 19.00 | -£ 16.00 | -£ 32.00 |
| Year-1 | £ 16.00 | £ 2.00 | £ 6.00 | £ 6.00 |
| Year-2 | £ 12.00 | £ 8.00 | £ 8.00 | £ 10.00 |
| Year-3 | £ 8.00 | £ 8.00 | £ 6.00 | £ 18.00 |
| Year-4 | £ 4.00 | £ 12.00 | £ 6.00 | £ 16.00 |
| Year-5 | -£ 8.00 | £ 10.00 | £ 4.00 | £ 12.00 |
| Residual value | £ – | £ – | £ – | £ 8.00 |
| IRR | 24% | 25% | 27% | 24% |
The IRR capital appraisal technique is higher for Proposal 3 and it stands at 27%. If the internal rate is higher than the expected rate or whichever is higher than that project can be considered.
CONCLUSION:
Each method has got its own importance. Payback gives importance toward the time required to take back the invested money. NPV gives importance towards the higher net present value. IRR gives importance to the Rate of Return. We prefer Proposal 3 as the rate of return is higher.
QUESTION 3:
BUSINESS PLAN & BUDGET:
Business Plan is a financial document which is prepared by the CFO or the Entrepreneur of the organization. The Business Plan is a written document about the targeted sales for the next year, marketing strategy, cost of the materials by purchase department, Other costs which are controlled by Operations team, Selling and Distribution, Collections department, Cash Budget prepared by accounts and finance team etc.
Different Budgets combined together makes a Business Plan. Some of the budgets are
- Sales Budget
- Purchase Budget
- Prodction Budget
- Operations Budget
- Marketing Budget
- R-&-D Budget
- Cash Budget
- Balance Sheet forecast
The budget and the business plan that has been prepared is compared with the actuals to understand the difference between Actual and the Budget. It is called as variance. The team which is responsible for the variance has to provide the answer for the negative variance. They are asked to work to fix the variance in the coming months. Thus the companies can attain their target as per the plan. All these analysis has to be performed as early as possible once the month is closed and the rectification has to be made at the earliest so that the company can align its path at the earliest.
If the company’s fail to prepare the budget, then there will be a lot surprises in their journey. For example, if the business is doing good. The marketing team will ask for more products. However, the production department might not be able to fulfil the demand. If they try to fill the same, there will not be enough inventory to process it. If they ask for more inventory, the purchase department might some time to scout for the additional raw materials and thus it might be difficult for the company to achieve the target.
NOV – BUDGET VARIANCE:
Given below is the November’19 Budget Variance that has been prepared by the earlier Finance Director on 21st Dec’19
| Production Activity | Budget | Actual | Variance | Variance% |
| Unit Produced | £ 5,000 | £ 6,000 | £ 1,000 | 25% |
| Costs | Budget | Actual | Variance | Variance% |
| Materials | £ 41,000 | £ 49,000 | -£ 8,000 | -26% |
| Suppliers | £ 21,000 | £ 22,500 | -£ 1,500 | -14% |
| Direct Labour | £ 10,000 | £ 10,500 | -£ 500 | -6% |
| Indirect Labour | £ 6,000 | £ 6,200 | -£ 200 | -4% |
| Depreciation | £ 3,000 | £ 3,000 | £ – | 0% |
| Share of Sale Costs | £ 4,500 | £ 4,800 | -£ 300 | -12% |
| Apportioned Overhead | £ 20,000 | £ 25,000 | -£ 5,000 | -50% |
| Total | £ 105,500 | £ 121,000 | -£ 15,500 | 22% |
The right Nov’19 Budget Variance is below.
| Production Activity | Budget | Actual | Variance | Variance % |
| Unit Produced | £ 5,000 | £ 6,000 | £ 1,000 | 20.0% |
| Costs | Budget | Variance | Variance | Variance % |
| Materials | £ 41,000 | £ 49,000 | -£ 8,000 | -19.5% |
| Suppliers | £ 21,000 | £ 22,500 | -£ 1,500 | -7.1% |
| Direct Labour | £ 10,000 | £ 10,500 | -£ 500 | -5.0% |
| Indirect Labour | £ 6,000 | £ 6,200 | -£ 200 | -3.3% |
| Depreciation | £ 3,000 | £ 3,000 | £ – | 0.0% |
| Share of Sale Costs | £ 4,500 | £ 4,800 | -£ 300 | -6.7% |
| Apportioned Overhead | £ 20,000 | £ 25,000 | -£ 5,000 | -25.0% |
| Total | £ 105,500 | £ 121,000 | -£ 15,500 | -14.7% |
If we look at the above table, it is very clear that the there is an increase in units produced by 20%. In that case, the variable costs are also expected to grow at a maximum of 20%. However, we see that Supplier cost, direct labour, Indirect labour & share of sales cost has increase by single digit. Materials is increasing in tandem with increase in volume. The only point of concern is that Apportioned Overhead which has increased by 25%. The apportioning is segregating the overhead cost by some logic to a specific product or segment.
Moreover, the Nov variance has been discussed only on 21st Dec’19. This is too late for the company. The reason being it give very less room for correction in the subsequent month.
| Production Activity | Budget | Cost/Unit | Actual | |
| Unit Produced | 5000 | 6000 | ||
| Costs | Budget | Variance | ||
| Materials | £ 41,000 | £ 8.20 | £ 49,000 | £ 8.17 |
| Suppliers | £ 21,000 | £ 4.20 | £ 22,500 | £ 3.75 |
| Direct Labour | £ 10,000 | £ 2.00 | £ 10,500 | £ 1.75 |
| Indirect Labour | £ 6,000 | £ 1.20 | £ 6,200 | £ 1.03 |
| Depreciation | £ 3,000 | £ 0.60 | £ 3,000 | £ 0.50 |
| Share of Sale Costs | £ 4,500 | £ 0.90 | £ 4,800 | £ 0.80 |
| Apportioned Overhead | £ 20,000 | £ 4.00 | £ 25,000 | £ 4.17 |
| Total | £ 105,500 | £ 21.10 | £ 121,000 | £ 20.17 |
The same Budget vs Actual has been prepared by modifying slightly and finding Cost per unit. We conclude that the company is doing good and the cost per unit stands at £ 20.17 vs the budget of £ 21.10
QUESTION 4:
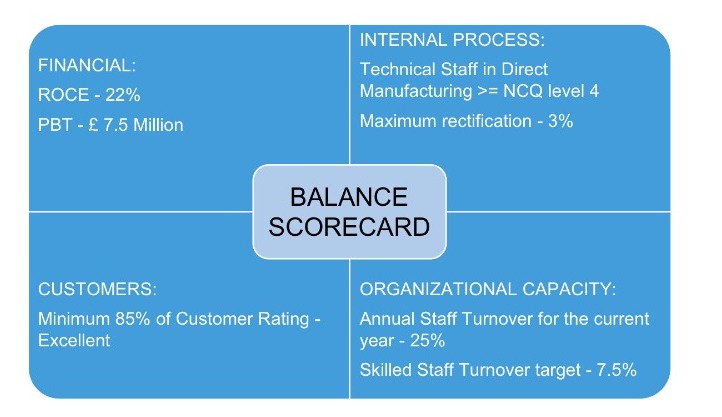
USEFULNESS OF BALANCE SCORECARD:
Balance Scorecard is a management tool. It is considered to be a semi structured report which can be used to measure the staff performance within one’s department and can be used to monitor the outcomes of the actions performed from these actions.
Some of the uses of Balance Scorecard are
- Set of parameters to monitor the performance against the target
- It contains both financial and nonfinancial data
- It focuses on the core agenda of the company.
SIMPLE BALANCE SCORECARD FOR N-TECH UK LTD.
REFERENCE:
1) Richard Pike and Bill Neale, 2006, Corporate Finance and Investments – Decision & Strategies
2) Internalization Theory and Corporate International Finance – Alan M. Rugman – https://doi.org/10.2307/41164920
3)Richard Pike and Bill Neale, 2006, Corporate Finance and Investments – Decision & Strategies
4) J Craig, K Moores – Family business review, 2005, Balanced scorecards to drive the strategic planning of family firms
5) RM Abrams – 2003, the successful business plan: secrets & strategies
6) C Mason, M Stark – International small business journal, 2004, What do investors look for in a business plan? A comparison of the investment criteria of bankers, venture capitalists and business angels
Know more about UniqueSubmission’s other writing services:
