
ACCOUNTS (MYOB)
MYOB is an Australian multinational company, founded on 1991. This company provides software solution and involves in information technology services to the small businesses. The CEO of the company is Tim Reed.
It provides products of accounting, job management services, services related to human resource management, retail tax products, payroll, customer relationship management and professional tax. Its headquarters resides in Victoria, Australia. The stock price of the company on Sept 08, 2017 is AUD$3.58 and fiscal year ended was 31 December 2016.

The main area for their operations includes New Zealand besidesAustralia.The auditor report is maintained and prepared by PWC (price water house coopers),the auditor claims that the financial reporting is accordance with the companies act 2001, and it also follows the ethical and standards of the accounting information APES 110 code of ethics,which makes it free from misstatement.
Company current situation and future plans
There are few current highlights that will look upon the financial and operational highlights of the MYOB i.e.It records its revenue $370 million,increase in clients by 92%,249k subscribers online.
Moreover,theoperational highlights include,they are investing their 1.15% of revenue in research and development process,consistent growth in new users by 47%,award retrieving team and lastly the integration of the green tree,which overall ensures development and opportunities in inorganic growth.
MYOB Australia wants to be on top in financial services.The company is building their reputation in market by delivering qualifiable interconnected services to their clients.
Alongside they are enhancing their market share and revenue by attracting SMEs business towards their business.They are adopting various strategies which help them to enhance core competencies and these competencies help MYOB to gain mid to long period growth opportunity.
According to officials of MYOB coverage on retail market help the company to attain huge potential growth because of the strength of small businesses.Small business enterprises help large business to become a leader in a competitive market.
In 2016,the company acquires Pay direct mobile online solutions which enhance the revenue of the company in an effective manner.63% of the revenue of MYOB is coming from small business enterprises which gave birth to many growth and expansion policies.In New Zealand market MYOB is the leader but in US marketit is facing many problems.They are implementing and formulating various policies to meet the future competencies.

Financial statement Analysis
The income statement for the year ended 2017.
Gross Profitis the profit earned by reducing the cost of goods sold from overall revenue.Whereas, the income that is earned before paying any tax and interest is knownto be income for the operations.Net income is the income that is left after subtracting all interest from revenue.The same thing has been presented in below tables:
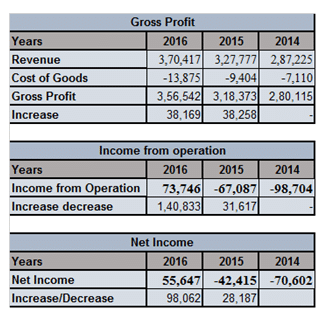
- Income Statement Trend Analysis
The working of MYOB is done according to the accounting policies,revenue which says that it is calculated at the fair value of the accounts receivables.It is recognized to fulfill few more criteria
like subscriptions,other revenue,transaction services,goods sold etc.It is needed to consider until and unless the benefits of the economy will able to flow in the company and through this,the analysis of revenue can be seamlessly measured.
The trend company has followed in the above three years which have been mentioned are very much correlated to industrial norms and their performances. Moreover the industrial growth has been contributed and affected by MYOB growth.
- Financial Position Statement of the MYOB Limited
Below shows the balance sheet of the company:
Assets are those that have the ability to convert them into cash within certain time period. Various assets are cash and cash equivalents,inventoryetc.Whereas,the liability is the money that is owned by the company from its suppliers,provider of goods and services.
The below table shows the relationship between the assets and liabilities i.e. (Assets= liabilities +shareholder equity).
Balance Sheet Trend Analysis
III.
The company follows proper standards to accounting so as to classify the investments wholly. If it meets the requirements,then this aligned as a subsidiary.It is calculated on the basis ofsum of value at the time of acquiring.Whereas,acquisition expense is classifying in other expense. Borrowings are treated as non-current liabilities when the company has unidentified to make a defer settlement for minimum one year.
IV.
The company have positive relationship with the norms and followed procedures.Moreover, the industrial growth in normshas been contributed to the company growth.
Cash Flow Statement
The relationship between net income and operating cash flow:
From the above table of the cash flow statement,it is clear that company (MYOB),investing activities are not more in 2015 and 2016 as compared to 2014,this analyzes that company is investing a lot inacquisition of Greentree in 2016.
Talking about the vital source of financing for MYOB company proceeds from the borrowings and shares issued which seem to be very big value in 2015 and 2014 as it shows null in 2016.
In cash and cash equivalents,the company has an increase in cash inflow rather than cash outflow,whichensures that MYOB is good enough in cash.It is seemed to be rising from the last three years.
From the above parts,it is analyzed that company is in good hands because they are incorporating more cash inflow means increasing finance in the operations.But on investing activities they have made huge investment that’s why they now have negative value.Whichanalyze that company is expanding in operating activities as well as investing activities,but not good in terms of financing activities.
Ratio analysis is a financial tool which is helpful in evaluating various types of financial operations so as to ensure its liquidity and efficiency,profitabilityratio.
This will ensure whether MYOB or any company financial performance is improving or reducing.Moreover,the use of ratio analysis is done through the interpretation of the financial statement.So, various ratios have been discussed in given below tables of MYOB,these are classified as:
Liquidity Ratios
The above table shows the relationship between the assets and current liabilities of last three years.As the current ratio of MYOB is decreasing which examines that,their assets are deteriorating from the last two years i.e. in 2014 it was above 2 lakhs and in 2016, it is nearly about 96000.Likely to that of liabilities it is also decreasing which is agoodindicator,as they are not able to thelarge amount of debt which the MYOB owned from outside parties.
Profitability Ratios
The table shows the profit margin that MYOB is earning from the last three years i.e. 2014 to 2016.It shows the steady growth in the profit margin.Where it was negative in 2014 and 2015 and in 2016 it shows the positive amount i.e. 0.150.With this,MYOB is able to handle its cost aspects.
Long Term (Solvency Ratios)
This above table shows that MYOB long term debt is decreasing with thetimeperiod.In 2014 it was 14.7 and in 2016 it was 0.621 which is higher than 2015.It also predicts company is not able to generate too few amounts of cash to make their debt payoffs.
Cash Flow Adequacy
Cash flow to sales analyzesthe increase or decrease in working capital.As the tableshows that cash to sales ratio is increasing from 2014 to 2016.Which ensures that company operating cash flow is better as compared to its previous years.
Market strength Ratios
Price earnings ratio is the ratio shows the relation between stock price and earnings fromit.As the given table shows that company is increasing its price earnings ratio,which indicates that MYOB stock is expensive to buy,unlikely to that of 2014 and 2015.
From the above ratio analysis,itis examined that MYOB is less in their current assets as compared to their liabilities.And their profit margin is also increasing but not up to the mark. MYOB have to utilize and must increase its assets to ensure that company willbe able to pay off their debts seamlessly.
But still the company cash to sales ratio is good and from it,they are gaining profit from every sale of their services and products.Which also may improve their long-term debt ratio up to the mark.
As their strength is high-profit margin as compared to previous two years.The weakness that is analyzedis,less current assets,low-debt as they are not able to pay off their debts due to less generation of cash.
From the above,it is analyzed from the income statement that company is earning better revenue in 2016,as compared to previous years,the reason for being in negative is because of negative net financial cost.AsMYOB is lacking in their current assets i.e. the ideal current ratio is 2:1 but in this case the company ratio 1.052:1 in 2016
.Through the analysis of cash flow statement,it is declared that investing activities was positive in 2014 followed by negative in 2015 and 2016,this examines that company has purchased and invested a lot.Afterwards,the important source of the financing activities is negative which is not good for MYOB as unlikely in 2014.
Moreover,the cash equivalents are good this shows anincreasingpath.AsMYOB company is performing good in its profit margin ratio which now had increased from the last two years. Which shows agood return from their sales.
Even though,the company is not taking ahuge risk which makes them apart from the losses.As their debt ratios examine that the company is performing safe and make their well fair/ good management of the debt and equity.
So,the recommendation to this situation is,The company has to increase its assets to gain 2:1 ratio.Hence,they have to improve its current ratio.
- Ahmed, H. (2017). Long Term solvency Ratio | Definition | Formula | Examples. [online] Guidanceportal.com. Available at: http://guidanceportal.com/ratios/long-term-solvency-ratio-analysis.html [Accessed 9 Sep. 2017].
- Averkamp, H. (2017). Financial Ratios and Analysis | Explanation | AccountingCoach. [online] AccountingCoach.com. Available at: https://www.accountingcoach.com/financial-ratios/explanation [Accessed 9 Sep. 2017].
- Faulkenberry, K. (2017). Explain Balance Sheet: Define Assets, Liabilities, and Net Worth – Arbor Asset Allocation Model Portfolio (AAAMP) Value Blog. [online] Arbor Asset Allocation Model Portfolio (AAAMP) Value Blog. Available at: http://www.arborinvestmentplanner.com/explain-balance-sheet-define-assets-liabilities-and-net-worth-2/ [Accessed 9 Sep. 2017].
- Munoz, D. (2017). MYOB’s future is a platform, not just software. [online] Financial Review. Available at: http://www.afr.com/technology/myobs-future-is-as-a-platform-not-just-software-20170227-gum1rh [Accessed 9 Sep. 2017].
- com (2017). Accounting Software & Online Business Solutions | MYOB Australia. [online] Myob.com. Available at: https://www.myob.com/au [Accessed 9 Sep. 2017].
- Peavler, R. (2017). Market Value Ratios Can Tell You Plenty About a Company. [online] The Balance. Available at: https://www.thebalance.com/what-are-market-value-ratios-and-how-are-they-used-393224 [Accessed 9 Sep. 2017].

When I initially commented I clicked the “Notify me when new comments are added”checkbox and now each time a comment is added I get four e-mails with the samecomment. Is there any way you can remove me from that service?Many thanks!
https://suba.me/