
Assignment
ECO105 ASSIGNMENT QUESTIONS
Q1.
Market power shows the ability of an organization to control the price of the product through manipulation of supply, demand or both. In monopoly, the organization has the power to reduce the output or supply for increasing prices. It results in a decline in demand at which time the organization can raise the price. Elasticity is the measurement of sensitivity in a variable to make a change in another variable (Besanko and Braeutigam, 2010). As per the concept of elasticity, the demand or the amount supplied can be changed in response to the price or income changes. The ability to make a change in supply for raising the price is price elasticity (Bar-Isaac et al., 2012).
Water supplies are necessity goods that have higher elasticity because if the firm reduces the water supplies, then it may cause a higher impact on the people as compared to landline phone connections. The landline phone connections are not more important than water supplies for the public. Therefore, Water Supplier Company has more market power than the landline phone connections company because it may influence the price more by reducing the supply.
Q2.
KFC, MacDonald’s and Hungry Jack are having an oligopolistic market structure. In an oligopoly structure, there are few firms that dominate the market. KFC, MacDonald’s and Hungry Jack acting as independent units are dominating the marketplace as they are few sellers offering homogenous products. They have a major market share with few other competitors and thus, limit the entry of new players. McDonald’s have acquired economies of scale so new firms require to reach economies of scale to be viable in the marketplace. Thus, in this market structure, it is difficult for a new firm to enter as the barrier to entry is high. These firms are interdependent as changes in pricing decisions of one firm might force the other firms to alter prices (Tennent and Lockie, 2012). The demand curve for these companies operating in an oligopolistic markets is kinked. Other market characteristics for KFC, McDonald’s and Hungry Jack are the elasticity of demand which is relatively inelastic, high market power, and firms in this market structure are capable to earn higher profits.

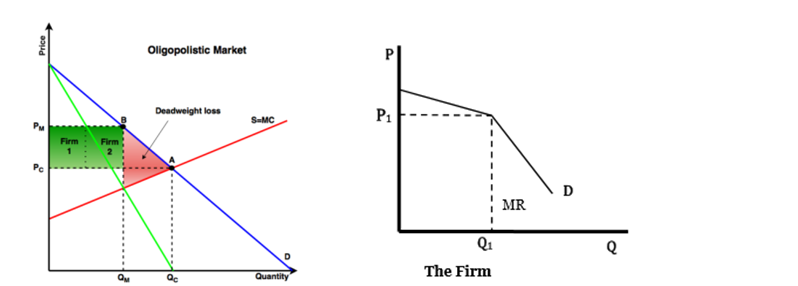
Figure 1 Firm in Oligopolistic Market Figure 2 Kinked demand in Oligopoly Market Structure
Q3.
The level of competition faced by CDU in Darwin with the Sydney campus is a direct form of monopolistic competition as the university is offering similar/homogenous products and have rivals offering services in the same business. In this competitive market, the campus at Darwin affects the market price as the students will compare to similar universities or another campus at Sydney if the campus raises its price. The demand curve for the CDU is downward sloping that is due to products has are slightly differentiated from other universities in terms of distinct courses and extracurricular activities. The downward demand curve indicates that with a certain rise in price at both universities, the demand will not drop and the campus will be able to enrol students. There is an elastic demand curve due to the presence of different universities. This kind of competition among the CDU campus at Darwin location with more focus on advertising can develop brand loyalty. The campus in monopolistic competition can achieve a level of output point of profit maximization where the marginal revenue is equal to marginal costs. Thus, CDU campuses can identify the price from its demand curve where it can maximize its profit-output level.
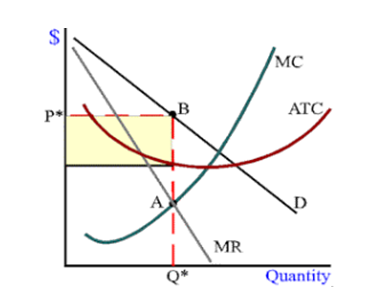
Figure 3 Short Run Pricing and Output
Q4.
The price elasticity of demand is an effect on the demand of a good or service by proportion change in price (Rios et al., 2013). If the fire emergency services are provided by the private companies in Australia then the price elasticity of demand will be inelastic. It is because it provides a low response to change in the price of the service of a fire emergency. In short term, the demand for fire emergency services after privatization will be more inelastic. As there is no alternative substitute, the price of fire emergency services will be in demand and the increase in demand will be inelastic. The important factor that determines the price elasticity of demand is the substitutability factor (Rios et al., 2013). Thus, with more numbers of close substitutes will be present in the market the demand will be elastic.
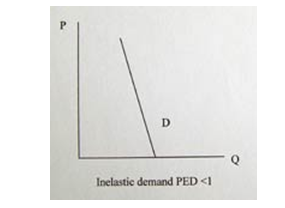
Figure 4 Price Inelastic Demand
Moreover, inelastic demand can lead to an increase in revenues with the increase in the price of emergency services as shown below.
Figure 5 Increase in price and revenue
Q5.
In monopoly competition, the firm will have full control over the product prices. The firm will be a price maker and will not alter decisions on price according to rivals. The elasticity of demand describes the level up to which monopolists can raise their firm products prices in the marketplace. The lowering of price by firms in monopoly is due to cost conditions (McEachem, 2016). There is no competition in the short-run and long run. But in reality, such a competition model does not exist.
Monopolistic competition is another competition model where firms experience some competition from rivals having close substitute products and the pricing and output decisions are affected by the strategies and action of rival firms to a certain extent. Product differentiation forms the key factor in this competition model (Nocco et al., 2014). Under this competition, the demand curve and the cost curves are identical. Moreover, the market structure with a few number of firms producing similar or differentiated products leads to an oligopolistic competition model. The competition is intense between firms and experiences firm interdependence in making key market decisions based on prices and outputs. There is the presence of few dominant forms in the market having the majority of market share. This market concentration by the dominant firms makes it difficult for other firms to enter the market thus; this form of competition creates a high barrier for the entry of new players in a closed oligopoly situation (Tennent and Lockie, 2012). Considering the Australian firms, the most realistic models of competition are monopolistic to give an advantage to both buyers and sellers. In monopolistic competition, the new firms can enter the Australian marketplace for gaining market share. Thus, new firms will be attracted for economic profits in this completion model. Companies initial gain market share by the addition of new products and services offering but will not be creating market concentration. As in the long –run the firm will have a reduction in market share due to close substitutes that would be available in markets over time.
Figure 6 Long-run in a monopolistic competition model
Q6.
The increase in pass marks in CDU will have an impact on the demands which will affect the student enrollment at the campus. The demand for enrolments will inversely relate to the rise in pass marks. If the pass marks are not changes it will result in a shift in demand whereas changes in pass marks will move along the demand curve. As the demand curve is downwards sloping, it indicates a negative relation between the enrollments and passes marks. The increase in pass marks can change the preferences for the university selection which is a non-price factor. The shift in the demand curve will take place due to this non-price factor (McEachem, 2016). The expectations of the students towards the pass marks are changed and it can change its preference of CDU University.
Figure 7 Shift in the demand curve
Q7.
- The slope of marginal cost curves is downward and it will decline when firms increase the production activity to a certain level as firms will not gain from specialized labour but at a higher level of production, the marginal cost curve will slope upwards (Besanko and Braeutigam, 2010). The curve intersects at its minimum points of the variable cost curve and average total costs. As the quality increases the marginal cost will decline. With further increase in quantity there will be a decrease in cost per unit. With labour specialization, the cost curve will slope downwards with increased output. To increase additional units, more labour and effort is put and marginal cost per unit increases. At a certain level, cost per unit and marginal cost goes up and the curve slope upwards. It is a U- shaped curve in a competing market.
Thus, the marginal cost curve represents the relationship between the marginal cost and level of output but the other variable should be constant such as technology and product price (Besanko and Braeutigam, 2010). The marginal cost refers to the cost of the production of one more unit. While the opportunity cost provides help to the organization by scarifying the highest cost unit of the production. The opportunity cost represents the cost of making one more unit in the production.
- Marginal cost is important as it represents the relation between the quantity of output produced and the marginal cost of a product/service (Gu and Li, 2011). It indicates the cost incurred in producing one more unit of good/service. The concept of the marginal cost is very important because it is helpful to provide the cost and benefits of the increase in production. Marginal cost also affects the total cost by the addition in the production of the output units. It allocates the efficiency of per-unit production and provides the cost and benefits of the per-unit increment in the production. The marginal cost is used by the firm to make an effective pricing policy by the use of cost/benefit analysis of the production units.
- The marginal cost for an additional household unit to NBN network would be a change in the opportunity cost which will arise when the household (quantity) will be produced is increased by one household unit. Marginal Cost is the change in costs divided by change in quantity. Thus, it is the cost of additional inputs required in producing one more unit of a household. For instance, additional labour in producing one household will increase the opportunity cost.
Q8.
The success of the supermarkets contributes to its oligopoly market structure where the few dominant supermarket chains concentration is high. This has led these chains to achieve economies of scale and provide quality products at low prices to customers. This forms a strategic component for these market leaders in an oligopolistic competition model. This market structure provides an imperfect form of competition for the different supermarket giants operating in the competitive marketplace (Levin et al., 2009). These supermarkets have a larger share proportion and face competition from a small number of competitors who sell homogenous or slightly differentiated products. Moreover, the dominant firms such as Woolworths pose a high entry barrier for other new firms as they are already controlling the majority of the market and have the advantage of economies of scale. Thus, it is easier for the dominating firms to monitor the strategy and decisions of few rival firms and react accordingly. The price-cutting to attract customer base by leading firms is thus a limiting force to drive out other firms planning to enter the low-profit margin market.
Figure 8 Demand curve in oligopoly market structure
Thus, it can be seen that the supermarket in an oligopoly market structure do not concentrate on increasing the prices by the rivals but the focus of the supermarket chains is on the decrease in prices of rivals firms. This leads to an increase in the elasticity of the demand curve.
These characteristics of an oligopoly market structure for the underlying reason for the success of supermarkets in many countries.
References
Bar-Isaac, H., Caruana, G. and Cuñat, V. (2012) Search, design, and market structure. The American Economic Review, 102(2), pp. 1140-1160.
Besanko, D. and Braeutigam, R. (2010) Microeconomics. USA: John Wiley & Sons.
Gu, C. and Li, F. (2011) Long-run marginal cost pricing based on an analytical method for revenue reconciliation. IEEE Transactions on Power Systems, 26(1), pp. 103-110.
Levin, Y., McGill, J. and Nediak, M. (2009) Dynamic pricing in the presence of strategic consumers and oligopolistic competition. Management Science, 55(1), pp. 32-46.
McEachem, W. A. (2016) Microeconomics: A Contemporary Introduction. USA: Cengage Learning.
Nocco, A., Ottaviano, G. I. and Salto, M. (2014) Monopolistic competition and optimum product selection. The American Economic Review, 104(5), pp. 304-309.
Rios, M. C., McConnell, C. R. and Brue, S. L. (2013) Economics: Principles, Problems, and policies. US: McGraw-Hill.
Tennent, R. and Lockie, S. (2012) Production relations under GLOBAL. AP: the relative influence of standards and retail market structure. Sociologia ruralis, 52(1), pp. 31-47.
