
Assignment Problem questions
Question 1:
Identification of the estimates of price elasticity of demand for three products/ services
The three products chosen are soft drinks, tobacco and gasoline. The study of Guerrero-López et al. (2017) estimated the price elasticity of demand for soft drinks in the urban areas in Chile along with other high energy dense foods and sugar-sweetened beverages for evaluation of possible Chilean households ‘

response for its consumption with relation to any changes in prices of soft drinks and others beverages and foods in the target location. Guerrero-López et al. (2017) found that the price-elasticity of soft drinks in Chile is −1.37 which impaled that an increase in price of soft drinks by 10 percent will reduce its consumption by 13.7 percent.
Thus, it means that the demand is price sensitive among the households in Chile. A similar study by Grünfeld (2017) estimated price elasticity of demand for soft drinks which was computed by to be -1.43 in the context of Netherlands.
Another study by Chacon et al. (2018) estimated the price elasticity on sugar-sweetened beverages and found that own-price elasticity is -1.39 of soft drinks in Guatemala region and also suggest that a price boost by 10 percent would cut its consumption by 13.9 percent.
It can be said that the price-elasticity of soft drinks is elastic as the price elasticity of demand is greater than one in all the three different studies. In relation to the determinants of the price elasticity of demand such as the availability of close substitutes for the soft drink products, it can be stated that there are many close substitute for soft drinks such as tea, coffee, yogurt-based drinks that easily available for consumers.
Thus, this makes it easier for the consumers to switch from soft drinks to substitute drinks even when the price of the soft drinks is changed with a small proportion (Colchero et al., 2015). Thus, the availability of many substitutes for this product makes it elasticity greater.
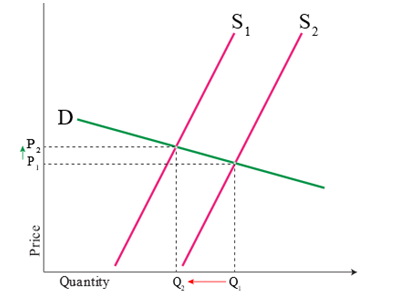
Figure 1: An elastic demand graph
(Source: ThisMatter.com, 2018)
For Tobacco product, the study of Tsighe et al. (2017), the price elasticity of demand for tobacco was estimated to be at -1.67 in Eritrea regions. From the article of Huang et al. (2018), it was identified that for pipe tobacco the price elasticity was −2.570 and for cigarettes it was −0.20 in the United States.
The tobacco product has elastic demand in Eritrea and United States (for pipe tobacco). The consequence is that when price will increase or change there will be high response of tobacco demand in Eritrea and United States even if there is a small proportionate price.
Considering the accessibility/ availability of substitute products, it can be said that in Eritrea and United states there is more possible substitute of tobacco products which tend to increase elasticity and demand tend to be elastic in these locations.
On the other hand, the Chonviharnpan & Lewis (2018) found the estimates of price elasticity of demand for tobacco products in Thailand to be at – 0.27. This finding suggest that in Thailand the tobacco is not price sensitive thus, its consumption is not sensitive to change in prices of tobacco products thus, there will be no significant reduction in tobacco consumption with price changes (excise tax).
Thus, it can be said that tobacco has relatively inelastic demand in Thailand. It can be said that the availability of substitute products in Thailand region is less making the demand tend to be inelastic. Also, considering the degree of necessity for the tobacco product, it can be said that it has become necessity to consumers in Thailand which has reduced the elasticity and made the demand inelastic due to development of habit for tobacco consumption.
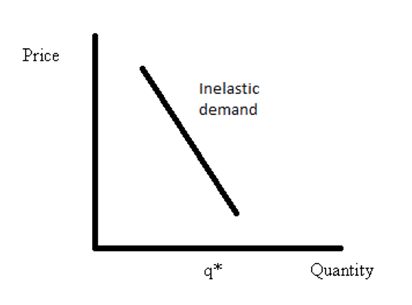
Figure 2: An inelastic demand curve
(Source: CFI, 2019)
The study of Coglianese et al. (2017) analysed the price elasticity of demand for gasoline and it was estimated to be -0.37 in the United States market for oil.
The price elasticity of demand for gasoline is estimated to be – 0.88 in Canada in the study of Moshiri & Aliyev (2017). Here, it can be said that there is an inelastic demand in Canada for the gasoline product.
In this type of demand elasticity it can be said that Canadian populace will have same amount of gasoline purchase in situation of price changes (increase or decrease) and the amount or demand of gasoline product will not change in particular increase when the process change i.e. gets reduce.
Another study on gasoline product price elasticity of demand by Jing & Wenhao (2018) estimated that it was – 0.445 in China. Thus, these studies estimated that for gasoline products the price elasticity is less than one which signifies that price elasticity of demand for this product is inelastic.
The price increase in gasoline the demand/ consumption will lessen by a small percentage when compared to the increase in its price. Thus, there is low responsiveness by buyer to price changes of the gasoline product in Canada, China and the United States.
There is less availability of substitute goods, which lower the elasticity thus, the demand for gasoline product tend to be inelastic. Also, considering the significance of the gasoline product cost in household budget is considered to have less attention in the budget in Canada, China and the United States.
Thus, this product forms a less proportion of the buyer budget in these countries thus, their demand tend to be inelastic. On the other hand, it can be argued considering the duration of price change for gasoline.
It can be said that elasticity is greater in long run when compared to short run as immediate substitute are difficult to find but in long time the consumer may adjust with their behaviour by increasing the use of public transportation, sharing car, and preference to buy fuel/ energy efficient vehicle (Lestari et al., 2018). This means that demands would tend to be elastic over the long-run in situation when there is a longer a price change hold for gasoline product.
Organisation with monopoly power in the Australian industry
It is identified though research that the broadband access network player in Australia has monopoly power. At the same time, this Australian wholesale broadband provider does not come under natural monopolies but it is governmental granted monopoly authority. The sole player is National Broadband Network (NBN) that is having major monopoly power.
The market dominance of this wholesaler player organisation is highest in the Australian marketplace in the wholesale broadband market and this has given NBN to develop its monopoly power (Heatley & Howell, 2010).
The National Broadband Network is also considered to have monopoly power as it has no number of direct competitors which has increase its market power and its ability to influence the broadband service prices in the marketplace. It can be said that small number of competitors has given NBN a superior monopoly power.
In addition, NBN has economies of scales which act as a barrier giving the organisation cost advantages and also had ability to finance the high capital requirements.
According to McShane et al. (2014), the NBN has gained technology superiority which has been serving as a barrier for other entrants to compete with this wholesale broadband service giant in Australia. It can be said that due to these economic barriers the organisation has monopoly power.
This monopoly power is used by the organisation in market competition and to earn profits even in situation when the consumers take internet service from other private competitors.
Also, in relation to the technological superiority, it can be said that the NBN has acquired latest technologies and uses the new and emerging technologies in its broadband services operations and management which has given an edge over its competitors to operate at lower cost (McShane et al., 2014).
This adds to NBN monopoly power as many firms are unable to do this due to lack of investments in new technologies and are unable to bear the expense to acquire and train employee to make best use of technologies thus, cannot operate at lower cost like the NBN.
Thus, it can be said that high market dominance, high barriers to entry, economies of scale, expensive entry barriers, and small number of direct competitors are the key sources of monopoly power of National Broadband Network.
The organisation gains benefits from this monopoly power in gaining a cost advantages in due to economies of scale and due to investment in new technologies (Wilken et al., 2013) in relation to the decrease its unit’s costs thus; other competitors will not be able to match the average cost (or the competitive costs).
In essence, it can be added that the high capital requirements in the broadband network market for laying down a network of fibre across the country and also expensive satellite technologies have also excluded the other players to establish them as big players in Australia.
This has also lead to provide monopoly power to NBN in the Australian marketplace. This organisation also makes use of its monopoly power to gain a strong control over the market and act as a price maker for raising the price of internet broadband services access for the regional areas and metropolitan areas in Australia.
The NBN monopoly power can be also considered to keep out from a competition to a full extent from the private companies for internet access and high internet speeds to Australian households.
The government act as a monopolist for NBN to grant access and authority to this single giant service organisation to get hold of the broadband internet access and speed and access in different areas (Heatley & Howell, 2010). This type of government initiative is also used by this organisation to prevent market entry of other private players.
Under the monopoly model, NBN is making supernormal profits where it can seek to maximise its business profits by setting the output where marginal cost (MC) is equal to marginal revenue (MR). This can be highlighted from the below figure which show marginal price (Pm), competitive price (Pc), junction of marginal quantity (Qm) and competitive quantity (Qc) when the total revenue go beyond the total costs to achieve supernormal profits.
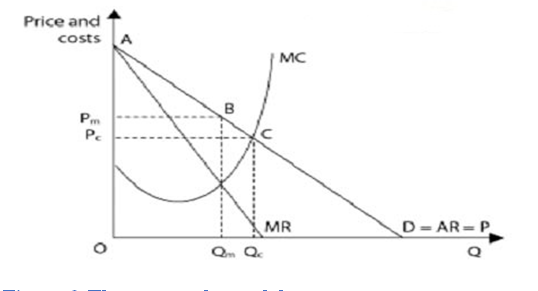
Figure 3:The monopoly model
(Source: Djolov, 2014).
The monopoly power can be considered to be a problem for other private player and customers owing to the high bargaining power of NBN. This gives the organisation an upper hand to behave as an independent large internet broadband service provider at the wholesale level for the populace and lower the market competitive pressure from other private players’ side.
It can be said that the organisation take benefit from its monopoly power in bargaining with its internet service retailers (Schram et al., 2018). Also, the price sensitive customer and the household customers with less disposable income are likely to get affected if monopoly power is exercised by the NBN to set or charge high prices of the internet speed and access.
The government intervention to curb the monopoly power in the internet broadband network services in Australia can be lowering and removing the tariffs barriers and other industry specific regulation that are supportive towards the monopoly power of NBN.
Thus, government can lower the entry barrier (Schram et al., 2018) and can provide them support for increasing the competition to provide an equivalent choice of internet access and high speed services at competitive rates to the consumers if monopoly power is exercised by NBN.
Also, the Australian government can develop a more stringent policy for fines and increase in level of existing penalties in situation of abuse of monopoly power (Wu & Ramesh, 2014) by NBN towards price discrimination, limiting services, setting higher prices to make high profits, or undertaking price cuts below the average cost price to pressure the rivals and their exist from business or when posing price restrictions with their internet service retailers.
Other than this, the government interventions can be also strict implementation and monitoring of price capping and promotion of health competition to avoid or prevent the development of monopoly power. Thus, yardstick competition, or rate of return regulation can be used by the government to regulate the monopoly power (Elzinga & Mills, 2011) in relation to the size of the organisation and the level of reasonable profits that relates to its size.
CFI. (2019). Inelastic Demand. Retrieved from: https://corporatefinanceinstitute.com/resources/knowledge/economics/inelastic-demand/
Chacon, V., Paraje, G., Barnoya, J., & Chaloupka, F. J. (2018). Own-price, cross-price, and expenditure elasticities on sugar-sweetened beverages in Guatemala. PloS one, 13(10), e0205931. Retrieved from: https://journals.plos.org/plosone/article?id=10.1371/journal.pone.0205931
Chonviharnpan, B., & Lewis, P. (2018). The Effects Of Tax Changes On Tobacco Consumption In Thailand. The Singapore Economic Review, 63(03), 629-646. Retrieved from: https://www.researchgate.net/profile/Bird_Chonviharnpan/publication/281631042_THE_EFFECTS_OF_TAX_CHANGES_ON_TOBACCO_CONSUMPTION_IN_THAILAND/links/55f142fd08aedecb68ffe262.pdf
Coglianese, J., Davis, L. W., Kilian, L., & Stock, J. H. (2017). Anticipation, tax avoidance, and the price elasticity of gasoline demand. Journal of Applied Econometrics, 32(1), 1-15.Retrieved from: https://www.nber.org/papers/w20980.pdf
Colchero, M. A., Salgado, J. C., Unar-Munguía, M., Hernandez-Avila, M., & Rivera-Dommarco, J. A. (2015). Price elasticity of the demand for sugar sweetened beverages and soft drinks in Mexico. Economics & Human Biology, 19, 129-137.
Djolov, G. G. (2014). The economics of competition: the race to monopoly. UK: Routledge.
Elzinga, K. G., & Mills, D. E. (2011). The Lerner index of monopoly power: origins and uses. American Economic Review, 101(3), 558-64.
Grünfeld, A. (2017). Price elasticity of the demand for soft drinks in the Netherlands: The effectiveness of a sugar tax. University of Amsterdam. Retrieved from: http://scriptiesonline.uba.uva.nl/document/654770
Guerrero-López, C. M., Unar-Munguía, M., & Colchero, M. A. (2017). Price elasticity of the demand for soft drinks, other sugar-sweetened beverages and energy dense food in Chile. BMC public health, 17(1), 180. Retrieved from: https://bmcpublichealth.biomedcentral.com/track/pdf/10.1186/s12889-017-4098-x
Heatley, D., & Howell, B. (2010). Structural Separation and Prospects for Welfare-Enhancing Price Discrimination in a New’Natural Monopoly’Network: comparing fibre broadband proposals in Australia and New Zealand.
Huang, J., Gwarnicki, C., Xu, X., Caraballo, R. S., Wada, R., & Chaloupka, F. J. (2018). A comprehensive examination of own-and cross-price elasticities of tobacco and nicotine replacement products in the US. Preventive medicine, 117, 107-114. Retrieved from: https://tobacconomics.org/wp-content/uploads/2018/05/1-s2.0-S009174351830135X-main.pdf
Jing, C. A. O., & Wenhao, H. U. (2018). Estimating the elasticities of gasoline demand for urban households in China. Journal of Tsinghua University (Science and Technology), 58(5), 489-493. Retrieved from: http://jst.tsinghuajournals.com/EN/10.16511/j.cnki.qhdxxb.2018.22.026
Lestari, S. D., Indrabudiman, A., Handayani, W. S., & Sugiarto, T. (2018). Estimation with Macroeconomic Variables in Long-Term Elasticity of Gasoline Consumption. International Journal of Energy Economics and Policy, 9(1), 326-329.
McShane, I., Wilson, C., & Meredyth, D. (2014). Broadband as civic infrastructure: The Australian case. Media International Australia, 151(1), 127-136.
Moshiri, S., & Aliyev, K. (2017). Rebound effect of efficiency improvement in passenger cars on gasoline consumption in Canada. Ecological Economics, 131, 330-341. Retrieved from: https://www.researchgate.net/profile/Saeed_Moshiri/publication/308739172_Rebound_effect_of_efficiency_improvement_in_passenger_cars_on_gasoline_consumption_in_Canada/links/59d6ad97458515db19c50128/Rebound-effect-of-efficiency-improvement-in-passenger-cars-on-gasoline-consumption-in-Canada.pdf
Schram, A., Friel, S., Freeman, T., Fisher, M., Baum, F., & Harris, P. (2018). Digital Infrastructure as a Determinant of Health Equity: An Australian Case Study of the Implementation of the National Broadband Network. Australian Journal of Public Administration, 77(4), 829-842.
ThisMatter.com (2018). Demand Elasticity. Retrieved from: https://thismatter.com/economics/demand-elasticity.htm
Tsighe, Z., Hailemariam, S., & Fesshaye, H. (2017). Price elasticity of demand for tobacco consumption in Eritrea: an exploratory study. MOJ Public Health, 5(6), 208‒213. Retrieved from: https://medcraveonline.com/MOJPH/MOJPH-05-00149.pdf
Wilken, R., Nansen, B., Arnold, M., Kennedy, J., & Gibbs, M. (2013). National, local and household media ecologies: The case of Australia’s National Broadband Network. Communication, Politics & Culture, 46(2), 136.
Wu, X., & Ramesh, M. (2014). Market imperfections, government imperfections, and policy mixes: policy innovations in Singapore. Policy sciences, 47(3), 305-320.
