BMG880 Data Analytics Assignment Sample
Module Code And Title – BMG880 Data Analytics Assignment Sample
Introduction
With the advancement of time the business analytics systems has been updating and companies’ focus on the appropriate business system has been growing rapidly. Every organization or Company compiles and documented their every internal and external data of communication, experience, details of their financial transaction for future use and access.
The documentation of various data helps an organization to understand the whole things related to the organization in an effective way and it also helps an organization to understand where the focus needs to be given. In Spite of all the evidence available for the access, it still remains a great problem for the analyst and the decision makers to gain appropriate visibility in the critical market intelligence.

In the context of market intelligence it is very important to mention that the evaluation of such intelligence helps an organization in their “specific and systematic wide data integration”. It is that type of process or technology which helps to transform any particular data into information. There is no doubt that the information helps to create awareness and it gives a clear idea about various opportunities and hindrances.
Analysis of proper data and business intelligence is very effective for customer satisfaction and better ROI. The appropriate business analysis is also very effective for risk management. Therefore it can be said that the appropriate business analysis is very effective for increasing the productivity of the organization. With the increase in productivity, the effectiveness of an organization increases. The effectiveness and the profitability of an organization are interconnected. So it can be said that with the increase in the effectiveness the profitability of an organization increases.
In the business intelligence process the data is processed in the algorithm format. It derives the key performance indicator from a huge and vast database. It displays the whole database in a visual context. This visual context is referred to as a dashboard. The dashboard is one of the most important and necessary things for business intelligence and giving information.
This report is going to apply business intelligence to Unilever Plc. after collecting various data related to it. The raw data has been collected from appropriate websites and then cleaned and refined to get the appropriate information. The cleaned and refined data then passed through Power BI for generating the dashboard.
Case Company and Problem Statement
Unilever Plc is a multinational Company who have their business operations all over the world. The Company deals in various products and they have been fulfilling the demands and needs of millions of people worldwide (Aklan and E 2019). From the very beginning of their business operation the Company has been trying to focus on providing quality products to their consumers and they have been doing this for a long time.
That is why the brand value of the Company has been growing rapidly and profitability of the organization has been increasing but the management of the Company is little bit conscious about the continuous decrease in the revenue. The result of the last five years has been showing that the revenue of the Company has been decreasing in an immense way and that can be a great consciousness for the Company. The decrease in the revenue can be an indication of shifting consumers. Therefore it can make a great impact on the business operation of the organization.
In this context it can be said that with the increase in the time the competition in the market has been increasing and such increase in the competition has been creating an adverse situation for the appropriate growth of an organization. When the Unilever Company started their business operation there were hardly any players in the market who provided the same kinds of products but in the current scenario there are many organizations who provide the same types of products and services to their consumers.
Therefore it can be said that the competition of the Unilever Company has been increasing and that can be the greatest reason for decrease in the revenue of the organization. On the other hand the shortcoming in fulfilling the demands and needs of consumers can also be a reason for the decrease in revenue.
The Unilever Plc has been focusing on gathering and visualize various data related to their business operation and revenue for generating business intelligence knowledge which will help the Company in
- i) Increasing their revenue.
- ii) Giving them an advantage in the competitive atmosphere.
iii) Help them to understand the shortcoming and where the focus needs to be given.
- iv) Analyzing the gross profit, net profit, debt of the Company.
Framework
Theoretical Framework
Business analytics is one of the most important things for an organization and the appropriate software solution is required for appropriate analysis of business data. The appropriate analysis of data helps an organization to understand the current market trends and the necessity of consumers.
The appropriate business analysis is a huge concept and various things like business analysis, predictive analytics, human performance management, and visualization of data are connected with it. Various researchers have stated in various times that there are many complex steps involved in the business analytics and that is why a proper framework is required for this. According to many analysts, general business analysis is the best for the appropriate business analysis framework.
Collection of Data
The appropriate data of an organization exists in a variety of formats and various locations. So it is very important to centralize those data in an appropriate way. There are generally two types of data sources, one is internal sources and the other one is external sources. The internal sources of data comprises various operational records of an organization (Comm, et al. 2018).
The operational record of an organization can be defined as the records of everyday transactions of an organization. On the other hand the evaluation of external data can be very effective and beneficial for an organization to understand the market competition and current market trends. The analysis of this external data is very important and beneficial for any organization.
In the context of this report it is very crucial to mention that the data of Unilever Plc has been collected from websites. The data of Balance sheet, Income statement and the cash flow analysis of the Company has been collected for the last five years (Osemwota and O 2021). The reason behind collection of such data is to understand the financial condition of the Company. Then various ratios have also been calculated from the data to understand the whole thing in an appropriate way.
Rational behind Calculation of Ratios
The ratio analysis is a key indicator for understanding the appropriate financial condition of an organization. It helps to understand the profitability and the debt of the organization. The effectiveness of an organization very much depends on the customer satisfaction and effective management system (Mees, et al. 2019). That is why the calculation of various ratios are very important and effective for understanding the financial condition of Unilever Plc in an effective way.
- The first ratio which is a key indicator of understanding the financial condition of an organization is Gross Margin The formula of the gross profit margin is “{(Revenue – Cost of goods sold)/Revenue} x 100” The gp margin is very beneficial for understanding how a Company have been generating profit from their products and services. The gp margin of Unilever plc has been calculated for five consecutive years from 2017 to 2021.
- The second ratio which is also very important for understanding the financial condition of a Company is the quick ratio. The formula of Quick Ratio is “(Current Assets – Inventory)/Current Liabilities. The quick ratio is very helpful for understanding the position of current assets and current liabilities of an organization. The higher the result of the ratio indicates the better an organization’s financial condition and liquidity. The higher result of the ratio determines the higher performance and stable financial condition of the Company.
- The cash ratio has also been calculated for understanding the liquidity of an organization. Calculation of this ratio indicates the willingness of an organization in measuring liquidity of them without selling their assets. The formula of the Cash ratio is “(Cash and Cash equivalent + Marketable Securities) / Current Liabilities”.
- The Current ratio of Unilever Plc has also been calculated. The formula of Current ratio is “Current Asset / Current Liabilities”. The ratio is a great indicator for credits for evaluating whether the Company is able to pay their short term debt or not. The Calculation of current ratio is very helpful for the investment in an organization. On the other hand it gives a clear indication of the Company’s stability by indicating the position of current asset and current liability of the organization.
Besides the calculation of ratio, the changes in the net profit, changes in asset, Eps growth of the Company has also been calculated (Cheng and Y 2021). It has already been mentioned that the Company has been facing revenue related issues for the last couple of years. The revenue of the Company has been decreasing rapidly and it is a great concern for the Company. The reason behind calculating those ratios and changes in the net profit or asset is, everything is interconnected with one another. Therefore evaluation of those things are very important and necessary.
Analysis of Dashboard
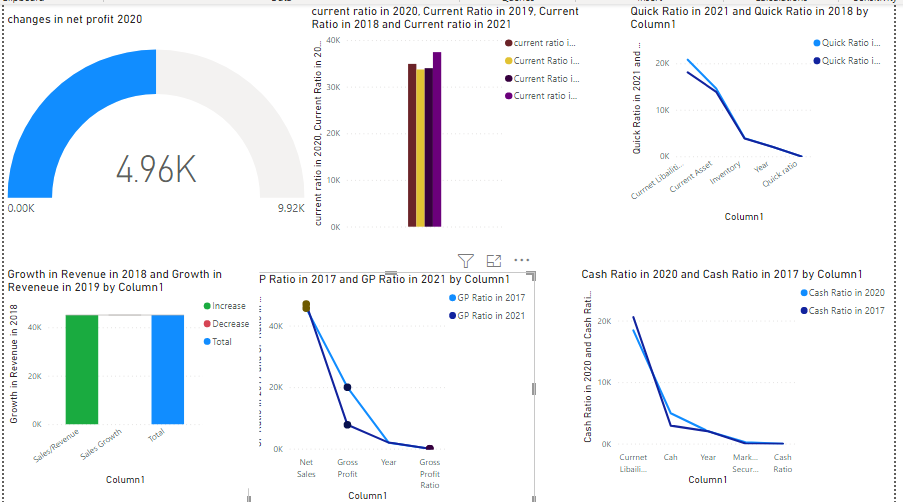 Figure 1: Dashboard Generated from Power BI (Source: Power BI)
The figure 1 is representing the dashboard generated from the Power BI. The dashboard that has been generated from the Power BI software shows the calculation of Quick ratio, current ratio, cash ratio, GP ratio, Growth in revenue and changes in net profit for the last five years (Chebiego, et al. 2018). The calculation of this thing is very effective and very beneficial for identifying the reason for the decrease in the revenue of Unilever Plc.
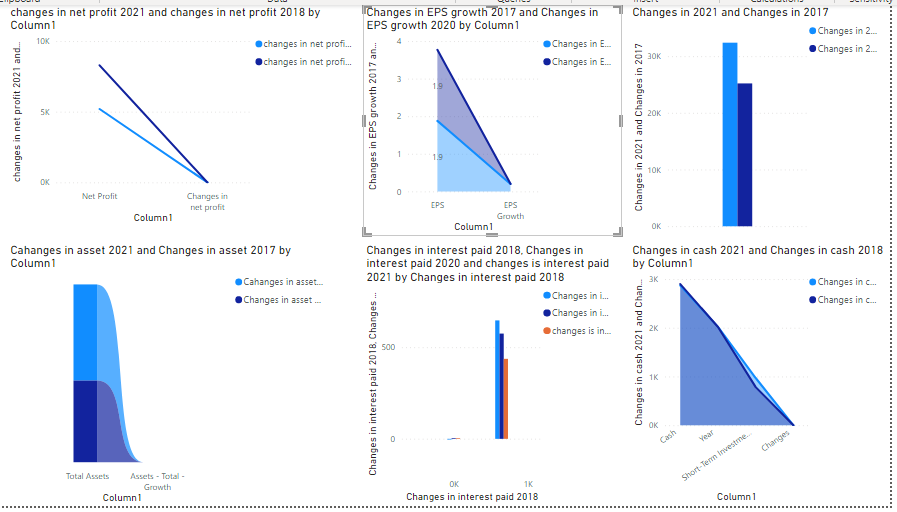 Figure 2: Dashboard 2 (Source: Power BI)
The second dashboard is showing the changes in net profit, EPS growth, intangible asset, total asset, interest paid and cash. They are also very important for understanding the reason behind such decrease in the revenue of the Company for the last five years.
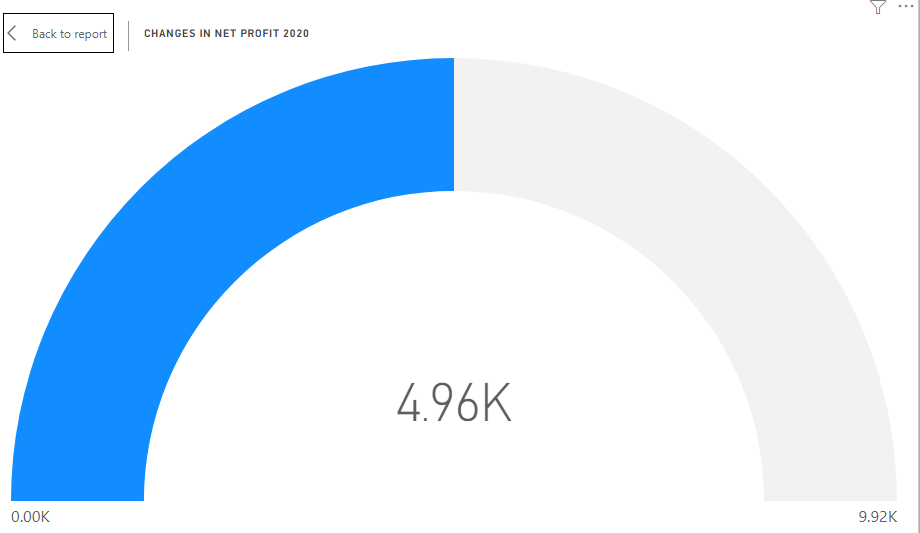 Figure 3: Changes in net profit (Source: Power BI)
The growth in net profit for the year 2018 was 8,289 which was 36.05% more than the previous year. While the net profit of the organization decreased by 67.96% and it came to just 4,935 (Jefferies, et al. 2021). The figure 3 is showing the changes in net profit in 2020 in comparison to 2018 (Rabu and R.J 2019.). The net profit of the organization for the year 2018 was 8, 289 while the net profit of the organization decreased to 4,961 in the year 2020. That can be a great concern for the organization. The net profit is totally connected with the revenue of an organization when the revenue of an organization decreases the net profit also decreases.
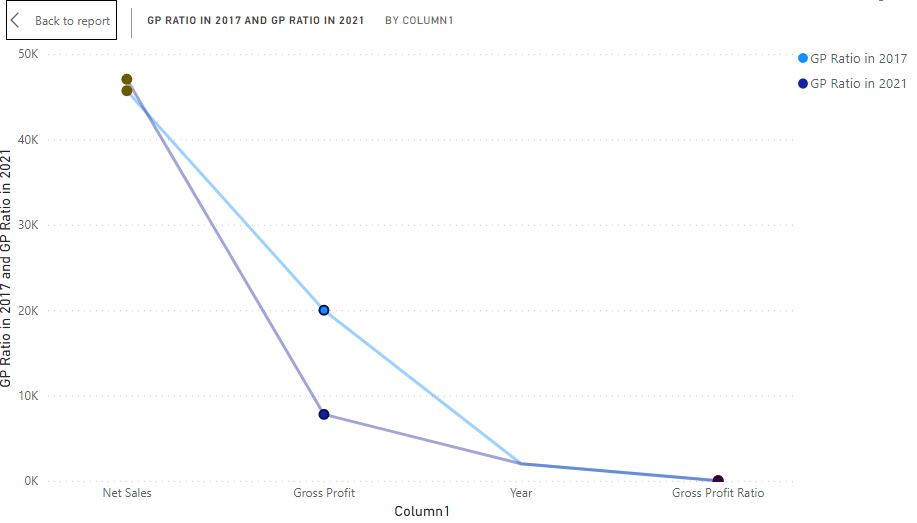 Figure 4: Comparison of Gross profit Margin of 2017 and 2021 (Source: Power BI)
The gross profit margin is the key indicator of the financial condition of an organization. It is quite effective for reflecting the success of an organization. The gross profit margin of Unilever plc for the year 2017 was 43.7618% which reduced to 16.5795 % in the year 2021 (UNUIGBOKHAI, et al. 2021).
The gross decrease in the gross profit margin is due to the decrease in the revenue of the organization. When an organization creates their “Treading and Profit and Loss Account” it reflects the gross profit of the organization by deducting all the fixed expenses from the revenue of the organization (Tien, et al. 2019). The fixed expenses cannot be changeable therefore they remain the same every year. The decrease in the revenue or sales of the Company has been decreasing the gross profit margin continuously.
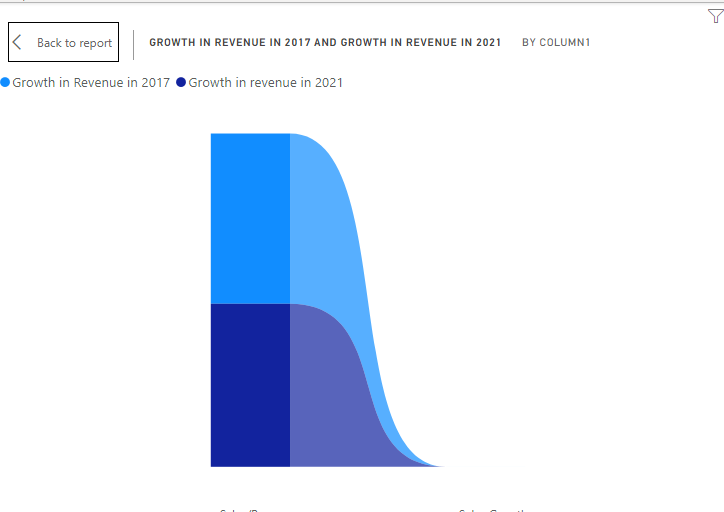 Figure 5: Changes in Revenue (Sources: Power BI)
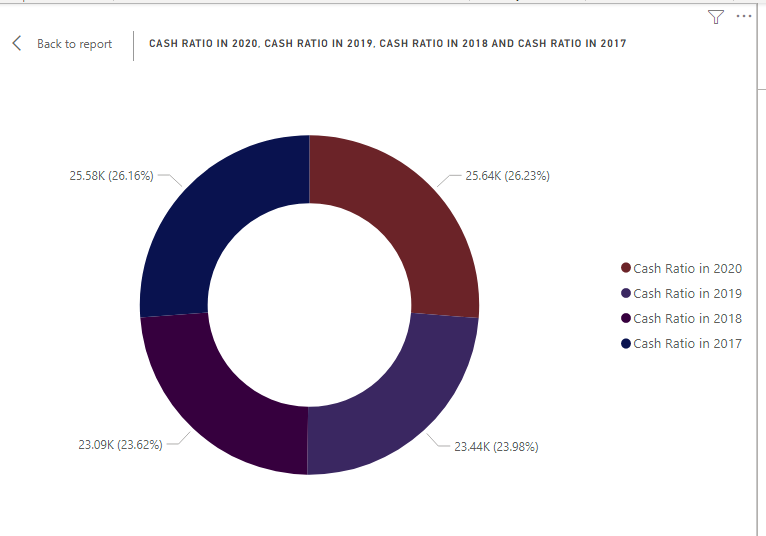 Figure 6: Changes in Cash Ratio (Source: Power BI)
Justification of Dashboard
These dashboards are very effective and beneficial for understanding the current financial position of Unilever Plc. The dashboard data will be very effective for reflecting various problems of the Company and where the focus needs to be given (Ullah and N 2021). To understand the reason behind such decrease in the revenue generation of the organization, that is Unilever PLC, various calculations have been made which are very beneficial for understanding the whole thing effectively.
The calculation of ratios are very beneficial for understanding the position of current asset, fixed asset, and liquidity of the Company. The comparison of such growth and changes are very beneficial for understanding the change in their financial situation. An organization can face various hindrances and obstacles several times in their business operation.
The perfect analysis of data and the dashboard generation can be very effective and beneficial for understanding the appropriate thing related to their financial condition and it also indicates where the focus needs to be given. In the context of this particular dashboard, it can be said that this dashboard will be very effective and beneficial for Unilever Plc in understanding the reason for the decrease in their revenue for the last couple of years (IBOJO and B.O 2020).
It will also help the Company to understand where the focus needs to be given and what should be their appropriate strategy for coping with such adverse conditions.
Recommendation
The Dashboard is clearly indicating some areas where the management and the policy makers of the Company needs to focus.
- i) The first thing in this context is, they need to focus on necessity and the demands of the people and should evaluate their strategy (Nie, et al. 2018). They can take various strategies which can be very beneficial and effective for identifying the needs of the people. In this context it is very crucial to mention that the demands and the necessity of the people has been changing rapidly and it is very important to focus on this thing effectively (Wilson, et al. 2018). Understanding the appropriate market trends can be very helpful for an organization in gaining a competitive advantage.
- ii) The second thing where the Company should focus is on increasing the productivity of the organization. The Calculation of ratios will help the Company to understand their shortcoming and where the focus needs to be given.
iii) The Company can evaluate the analysis of the dashboard. Such an evaluation can be very beneficial for the Company to understand various internal and external issues of the Company and what should be the appropriate strategy for increasing their revenue.
Conclusion
The whole paper discusses various financial aspects related to Unilever Plc and the problem that the Company has been facing. The Calculation of various ratios, growth and dashboard creation can be very helpful and beneficial for the Company to understand the proper strategy for them. It will also help the organization to identify various hindrances and where the focus needs to be given.
The Company needs to evaluate this data and they should take an appropriate step which can be very effective for increasing their revenue growth and effectiveness.
Reference List
Journals
Chebiego, C. and Kariuki, P., 2018. Strategic firm level factors and performance of manufacturing firms in Kenya: A case of Unilever Kenya Ltd. International Academic Journal of Human Resource and Business Administration, 3(3), pp.243-262.
Cheng, Y., 2021, February. Analysis on the Opportunities and Challenges of Unilever’s Differentiated Competition by Using SWOT and PEST. In 6th International Conference on Economics, Management, Law and Education (EMLE 2020) (pp. 280-284). Atlantis Press.
Comm, C.L. and Mathaisel, D.F., 2018. The use of analytics to market the sustainability of “Unique” products. Journal of Marketing Analytics, 6(4), pp.150-156.
Contreras Caro, S., Inclusión de business intelligence en la toma de decisiones de beauty e-commerce: de los datos a la acción.
Corga, G.M.D.C.F., 2021. Equity Research Sonae SGPS SA: Replicating Soane’s Portfolio (Doctoral dissertation, Instituto Superior de Economia e Gestão).
Dogru, A.K. and Keskin, B.B., 2020. AI in operations management: applications, challenges and opportunities. Journal of Data, Information and Management, 2(2), pp.67-74.
Eluyela, F.D., Okere, W., Otekunrin, A.O., Okoye, J.N., Asamu, F. and Ajetunmobi, O., 2020. Institutional investors ownership and financial performance: Examining the nexus in Nigerian deposit money banks. Research in World Economy, 11(6), p.177.
Gaur, M., 2018. To analyse the impact of business intelligence on business/corporate travel domain (Doctoral dissertation, Dublin Business School).
Higazi, S.F., 2021 Business Intelligence and the Transition from Information to Optimization.
Hillewaert, J., WOMEN ON THE BOARD AND THE IMPACT ON FIRM REPUTATION.
Hussein, S. and Abdelhamid, A., 2021. Technology Acceptance Model for Pervasive Computing: Mobile Business Intelligence Applications in Egypt. مجلة جامعة الإسکندرية للعلوم الإدارية, 58(2), pp.291-326.
IBOJO, B.O., 2020 Impact Of Strategic Placement On Product Accessibility In The Nigerian Food And Beverage Industry. A Case Study Of Unilever Nigerian Plc.
Ikechukwu Nwanji, T., Howell, K.E., Faye, S., Egbide, B.C., Otekunrin, A.O., Lawal, A.I., Obadiaru, D. and Eluyela, D.F., 2020. The Role of Accounting Information for Effective Corporate Financial Reporting: A Case Study of Flour Mill of Nigeria. Journal of Critical Reviews, 7(19), p.671.
Inyiama, O.I., Inyiama, E.C., Okwo, M.I. and Nwoha, E.C., 2021. Customers’ Patronage, Earnings of Deposit Money Banks and Nigeria’s Shrinking Economy. Journal of Legal Studies, 28(42), pp.163-185.
Jefferies, P., Höltge, J. and Ungar, M., 2021. Social anxiety and resilience: Associations vary by country and sex. Adversity and Resilience Science, 2(1), pp.51-62.
Kamal, S. and Sharma, S., 2021. A Comprehensive Review on Summarizing Financial News Using Deep Learning. arXiv preprint arXiv:2109.10118.
Kostiuchenko, N.M. and Zakorko, A.A., 2019. Transnational companies’ strategic planning in the context of the Global Sustainable Development Goals.
Kpoku, O.K., 2021. Positive and negative influence of globalization on international business actors’ activity (on materials of Unilever Group) (Doctoral dissertation).
Lehtimaki, M.J., 2020. Intercreditor agreement as a contractual solution to restructuring leveraged buyouts (Doctoral dissertation, University of Oxford).
Lim, E., 2021. Directors’ Liability and Climate Risk: White Paper on Hong Kong. Available at SSRN.
Loureiro, S.M.C., Guerreiro, J. and Tussyadiah, I., 2021. Artificial intelligence in business: State of the art and future research agenda. Journal of Business Research, 129, pp.911-926.
Manyala, S., 2021. Deal rationales for technology M&A: an analysis of the two year value generated (Doctoral dissertation, Massachusetts Institute of Technology).
Matevosyan, E., 2020. Valuation of Netflix, Inc. using Selected Valuation Methods
Maulana, A. and Wulandari, D.A.N., 2019. Business Intelligence Implementation To Analyze Perfect Store Data Using the OLAP Method. Sinkron: jurnal dan penelitian teknik informatika, 3(2), pp.103-111.
Mees-Buss, J., Welch, C. and Westney, D.E., 2019. What happened to the transnational? The emergence of the neo-global corporation. Journal of International Business Studies, 50(9), pp.1513-1543.
Nie, Y., Talburt, J., Dagtas, S. and Feng, T., 2018. The influence of chief data officer presence on firm performance: does firm size matter?. Industrial Management & Data Systems.
Nocker, M. and Sena, V., 2019. Big data and human resources management: The rise of talent analytics. Social Sciences, 8(10), p.273.
Nwanji, T.I., Howell, K.E., Faye, S., Ben-Caleb, E., Otekunrin, A.O., Lawal, A.I., Obadiaru, E.D., Eluyela, F.D. and Ifeyinwa, S.D., 2020. THE ROLE OF ACCOUNTING INFORMATION FOR EFFECTIVE CORPORATE FINANCIAL REPORTING: A CASE STUDY OF FLOUR MILL OF NIGERIA. Journal of critical Reviews, 7(19), pp.5832-5847.
Officer, V.S.C., Finance, M.C. and Finance, M.E.C., 2021. Financial covenant waivers give companies leeway to rebuild battered earnings.
Osemwota, O., 2021. Evaluating the use of data analytics in talent acquisition of senior managers in Nigerian banks (Doctoral dissertation, Dublin, National College of Ireland).
Otekunrin, A.O., Eluyela, D.F., Nwanji, T.I., Faye, S., Howell, K.E. and Tolu-Bolaji, J., 2021. Enterprise Risk Management (ERM) and Firm’s Performance: A Study of Listed Manufacturing Firms in Nigeria. Research in World Economy, 12(1), p.31.
Panova, G., 2021. EVOLUTION OF TRADITIONAL BANKS’BUSINESS MODELS. International Review, (1-2), pp.146-152.
Parker, J., 2020. Ethnic diversity enriching business leadership. The Parker Review.
Power, D.J., Heavin, C., McDermott, J. and Daly, M., 2018. Defining business analytics: An empirical approach. Journal of Business Analytics, 1(1), pp.40-53.
Rabu, R.J., 2019. The study of the shopper marketing activation process of Unilever Bangladesh Limited.
Rahman, S., 2019. Discretionary tone, annual earnings and market returns: Evidence from UK Interim Management Statements. International Review of Financial Analysis, 65, p.101384.
Rodríguez-Fernández, M., Sánchez-Teba, E.M., López-Toro, A.A. and Borrego-Domínguez, S., 2019. Influence of ESGC indicators on financial performance of listed travel and leisure companies. Sustainability, 11(19), p.5529.
Schellmann, H., 2020. How job interviews will transform in the next decade. The Wall Street Journal.
Sharma, A., 2020. Prediction of market share of fast moving consumer goods via market share attraction model using parametric method.
Team, B.I., 2019. Annual Report 2017–18. Behavioural Insights Team.
Tien, N.H. and Do Thi, Y., 2019. Comparative analysis of knowledge management software applications at E&Y and Unilever Vietnam. International Journal of Multidisciplinary Research and Development, 6(10), pp.22-27.
Ullah, N., 2021. A Comparative Analysis between Unilever and Johnson & Johnsons.
Umukoro, O., Eluyela, D.F., Ozordi, E., Inua, O.I. and Balogu, S.B., 2020. Nollywood accounting and financial performance: Evidence from Nigerian cinemas. International Journal of Financial Research, 11(2), pp.271-280.
UNUIGBOKHAI, O.A. and NMOR, I.C., 2021 Working Capital Management and Organizational Performance.
Wilson, H.J. and Daugherty, P.R., 2018. Collaborative intelligence: Humans and AI are joining forces. Harvard Business Review, 96(4), pp.114-123.
Zhang, Z. and Ibikunle, G., 2020. Frequent batch auctions under liquidity constraints. Available at SSRN 3752032.
Know more about UniqueSubmission’s other writing services:

https://twrd.in/7q7zl5X
https://ad.wpcookie.pro
https://twrd.in/DEgV4sv