CAPM Model Assignment Sample
COMPREHENSIVE UNDERSTANDING OF ECONOMIC PERSPECTIVE MODELS
Introduction
Asset pricing is referred to as the process of determining the expected or required rate of return on an asset (Penuchi, 2008). In the wake of Innovation and economic liberalization asset pricing is a significant aspect that drives the economic fluctuations and enables the investors and company to allocate resources across different sectors at different times. It also influences the strength of the financial system at the National or international level (Cochrane, 2009). This study will defeat three significant models which associate with the pricing Asset Management and also identify the transition from each model to the other.

Initially, the discussion is based on a comprehensive understanding of the CAPM model where each factor is identified in terms of expected return risk-free rate market to return expected return premium and market risk premium (Stulz, 1981). The ways in which beta can be calculated considering the variance and covariance method and their significance in the calculation have been determined. Lastly, the security market line and result for the empirical test for the model have also been determined. Later the discussion was confined to the Fame French three-factor and Five-Factor Model that explains the different factors associated with the model and ways of calculating book to market ratio and market cap (Duffie, 2010).
In the discussion, the prime focus has been made on the process of sorting the stock in the small and big portfolio and conservative and aggressive portfolio for which the interpretation of excess return associated with the investment has been interpreted with access return.
Discussion
Understanding of CAPM model
Historical background
The Capital Asset pricing model is a coherent framework that was developed in 1960 by William Sharpe, Jack trailer, John Lintner, and Jan Mohsin (Džaja and Aljinović, 2013). The idea of this model is based on the fact that not all risk affects Asset prices. In the application of the model, it idolizes the ways in which financial markets price the security and determine the expected return for the capital investment.
CAPM Model
The model is widely used by investors to generate the expected return for assets given the risk for each asset. Currently, investors also use the expected return deduced from the model to discount the future cash flow and calculate the present value and the fair prices for the investment (Bao et al., 2018).
Components of CAPM model
Expected return: the expected return is loss or profit which an investor anticipates of foreign investment. By multiplying the potential outcome by the chances of them authoring and totaling the result the expected return is calculated (Odobašić et al., 2014).
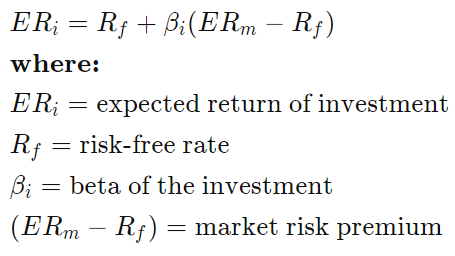
Risk-free rate: it is the theoretical rate of return for an investment having minimal or zero risk. It represents the expectation of the investor from risk-free investment in a specific tenure or period.
Beta: it is the standard measure for the systematic risk in the CAPM model. The security moves parallel to the return of the stock market as a whole and this tendency is gauged with the concept of Beta.
Market return: the expected return of the model is used for identifying discounts to which is expected as per the capital appreciation and dividend of the stock for a particular holding or expected period of time.
Market risk premium: In the CAPM Model the market risk premium is considered as the difference between the risk-free rate and the expected return on the market portfolio.
Expected risk premium: the expected risk premium is the investment return that an asset is expected to provide within the access to the risk-free rate of the return (Dionne and Okou, 2012).
Calculating beta
The beta in security is calculated by dividing the product in the covariance for return in the security and market return by the variance of the return from the market for a specific period of time. Calculating the beta helps the investors in understanding if a stock will move in the same direction as that of the entire market. The two variances are used for measuring correlation in the price movement for two different stocks. On the other hand, the variance is used to measure the volatility of the price for the individual stock over a particular period of time.
Stock beta and Portfolio beta
A Portfolio beta is a weighted sum for individual asset beta. The value of beta is when it is greater than one it suggests that the stock can be more volatile than the broader market and if it is less it indicates that the stock can lower than the volatility.
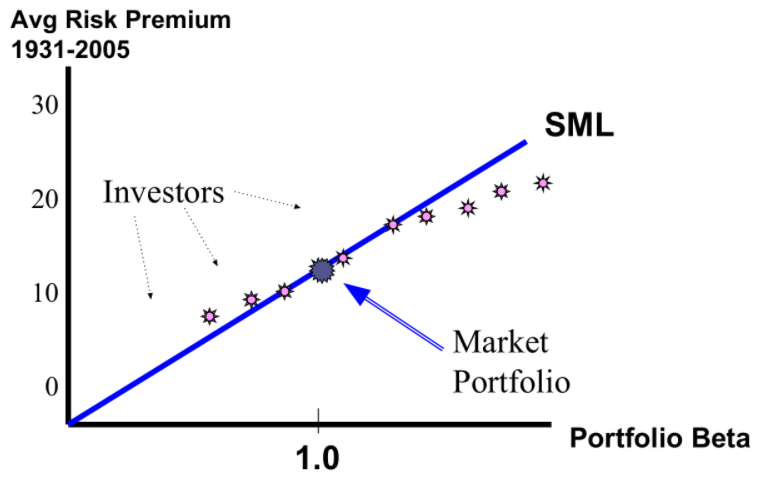
Security market line
The security market line is a line drawn on the chart which solves the graphical representation for identifying a Capital Asset pricing model that shows different levels of market risk and the systematic risk for various marketable securities that are plotted against the expected return for the entire market within a given period of time.
Results of an empirical test of the model
As per the model, the expected return for a risky asset is linearly and positively related to the beta. The model can be tested empirically however the book to the market ratio factor and the size factor are an important aspect that helps in identifying and explaining the risk-return relationship.
Understanding Fame French Three-Factor Model
The transition from the CAPM model
The CAPM model is used for calculating the required rate of return whereas the Fama French model credits the variation in the axis return over the required rate of the return compared to different components of the CAPM model (Womack and Zhang, 2003)
Historical background
The Fama and French Three-Factor Model is an asset pricing model that was developed in the year 1992 which expands on the Capital Asset pricing model and its concept by the addition of value risk factor and size risk to the market risk factor in the CAPM model. This model identifies the fact that the small-cap and value stock outperform the market on a regular basis.
The three Factor Model
The Fama and French model have three factors which include the size of the firm, access return on the market, and book-to-market values. The three Factor Model is used in terms of small minus big portfolio return and the high minus low risk-free rate of return (Basiewicz and Auret, 2010).
Small minus big Calculation and market cap
In the model of a Fama and French three factors, the small minus big is one of the prominent three factors in the model that is associated with the stock pricing model. This is used in the identification and explanation of the portfolio return and it is also referred to as the side effect where the size is based on the market capitalization of the company. The capitalization of the market is the total dollar value of the market for the outstanding share and stock of a company which is also referred to as market cap and calculated by multiplying the share prices and the total number of shares outstanding of the company (Nartea et al., 2009).
Calculating SMB:
High minus low calculation and book to market ratio
The high minus low is referred to as the value premium which is yet another one of the three factors of the Fama French three Factor Model. The book to market ratio is the indicator for the value of a company that compares the book value of an organization to the market value. It is calculated by looking at the historical cost of the company and its accounting value.
HML= Historic excess returns of value stocks (high book-to-price ratio) over growth stocks (low book-to-price ratio)
Result of empirical test for the Three-Factor Model
The model is essentially the result of the economic reservation in the historical stock prices and the size and value are considered to be essential to the risk factor that helps in identifying and explaining the excess return of the stock (Sehgal and Balakrishnan, 2013).
Understanding Fame French Five-Factor Model
The transition of three Factor Model to 5 Factor
The Fama French Five-Factor Model uses 6 value weight portfolios on a book to market and size that are formed on investment and size.
The Five-Factor Model
The Fama French Five-Factor Model extends to the Three-Factor Model by adding another two factors with the robust minus weak portfolio and the low minus high investment. The factors discussed above remain the same in the Five-Factor Model but the other two factors assess legal asset pricing management (Mosoeu and Kodongo, 2020). Collaboratively it calculates the likely return for stock market investment that helps in measuring the returns based on the comparison of the investment to the overall risk and the size in the market of the company which involves the book to market value.
Calculating robust minus weak
The return for robust minus weak within the small stock and big stock is calculated by subtracting the big stock from the small stock (Chiah et al., 2016). The outcome is obtained by averaging the big talk with the small stock and the size factor is based on the average of the three stock portfolios minus the three big stock portfolios.
Operating profit is identified as the total income which a company generates from the sale after paying all the expenses such as employee payroll rent inventory and equipment cost.
The book value on the other hand is considered as the cost of carrying the Asset of the balance sheet of any organization which is calculated by netting the asset with the accumulated depreciation (Roy and Shijin, 2018).
The market value is determined by share price in stock market and the number of shares in outstanding.
When the RMW value is positive it reflects the fact that the organization has higher profitability to earn better results in the future and the counter-intuitive is comparatively lower.
Calculating CMA
By dividing net income by total asset or equity and calculating the over percentage equity ratio portion is identified. The total asset for an organization refers to the number of assets that the organization owns.
The stocks are stored into aggressive and conservative portfolios and the interpretation of the return associated with the CMA is calculated by allocating the investment across different asset classes such as fixed income equity real estate and commodity. Portfolios having more than 50% of the exposure to the equity are classified in the aggressive growth portfolio while the portfolios that have higher exposure to the fixed income are conservative.
The Fama French Five-Factor Model also proposes equilibrium to the six-factor asset pricing model that can employ an aggregate of the 4 sets for portfolio mimicking the size and the industry having varying dimensions. In order to estimate the parameter for the sets factor as surprising from the force that of the varying to the portfolio of the investors can use the generalized method of momentum-based robust instrumental variable technique. The human capital components in this aspect of share predictive power along with the factor is explained in the framework of the model in the return on the portfolio (Fama and French, 2004).
Conclusion
From the above discussion and the eventual transition of the CAPM model to the three-factor Model and then further to the Five-Factor Model can be identified. The different components and their use in the identification of the stock market and investment of an organization are determined. The result is the differences of the empirical test for all the models to illustrate the excess return which are associated with the stock management. The historical compliance of each model illustrated the addition of other factors which help more critically to the investor in identifying the significance and more appropriateness for investment. Apart from the factors that have been identified in the Asset pricing, other factors can affect the Asset pricing which includes the bearing dimension of the industry and mimicking the size of the portfolio. The size of the profitability and Momentum can be constituted to estimate other parameters for the pricing model apart from the inclusion of the five factors identified.
References
Bao, T., Diks, C. and Li, H., 2018. A generalized CAPM model with asymmetric power distributed errors with an application to portfolio construction. Economic Modelling, 68, pp.611-621. Available at: https://www.sciencedirect.com/science/article/pii/S0264999317304893 [Accessed on 22 February 2022].
Basiewicz, P.G. and Auret, C.J., 2010. Feasibility of the Fama and French three-factor model in explaining returns on the JSE. Investment Analysts Journal, 39(71), pp.13-25. Available at: https://www.tandfonline.com/doi/abs/10.1080/10293523.2010.11082516 [Accessed on 22 February 2022].
Chiah, M., Chai, D., Zhong, A. and Li, S., 2016. A Better Model? An empirical investigation of the Fama–French five‐factor model in Australia. International Review of Finance, 16(4), pp.595-638. Available at: https://onlinelibrary.wiley.com/doi/abs/10.1111/irfi.12099 [Accessed on 22 February 2022].
Cochrane, J.H., 2009. Asset pricing: Revised edition. Princeton university press.
Dionne, G., Li, J. and Okou, C., 2012. An extension of the consumption-based CAPM model. Available at SSRN 2018476. Available at: https://papers.ssrn.com/sol3/papers.cfm?abstract_id=2018476 [Accessed on 22 February 2022].
Duffie, D., 2010. Dynamic asset pricing theory. Princeton University Press.
Džaja, J. and Aljinović, Z., 2013. Testing CAPM model on the emerging markets of the Central and Southeastern Europe. Croatian Operational Research Review, 4(1), pp.164-175. Available at: https://hrcak.srce.hr/97395 [Accessed on 22 February 2022].
Fama, E.F. and French, K.R., 2004. The capital asset pricing model: Theory and evidence. Journal of economic perspectives, 18(3), pp.25-46. Available at: https://www.aeaweb.org/articles?id=10.1257/0895330042162430 [Accessed on 22 February 2022].
Mosoeu, S. and Kodongo, O., 2020. The Fama-French five-factor model and emerging market equity returns. The Quarterly Review of Economics and Finance. Available at: https://www.sciencedirect.com/science/article/pii/S1062976920301460 [Accessed on 22 February 2022].
Nartea, G.V., Ward, B.D. and Djajadikerta, H.G., 2009. Size, BM, and momentum effects and the robustness of the Fama‐French three‐factor model: Evidence from New Zealand. International Journal of Managerial Finance. Available at: https://www.emerald.com/insight/content/doi/10.1108/17439130910947895/full/html [Accessed on 22 February 2022].
Odobašić, S., Tolušić, M. and Tolušić, Z., 2014. The application of the CAPM model on selected shares on the Croatian capital market. Ekonomski vjesnik: Review of Contemporary Entrepreneurship, Business, and Economic Issues, 27(2), pp.297-311. Available at: https://hrcak.srce.hr/file/196130 [Accessed on 22 February 2022].
Pennacchi, G.G., 2008. Theory of asset pricing. Boston: Pearson/Addison-Wesley.
Roy, R. and Shijin, S., 2018. A six-factor asset pricing model. Borsa Istanbul Review, 18(3), pp.205-217. Available at: https://www.sciencedirect.com/science/article/pii/S2214845017301916 [Accessed on 22 February 2022].
Sehgal, S. and Balakrishnan, A., 2013. Robustness of Fama-French three factor model: Further evidence for Indian stock market. Vision, 17(2), pp.119-127. Available at: https://journals.sagepub.com/doi/abs/10.1177/0972262912483526 [Accessed on 22 February 2022].
Stulz, R., 1981. A model of international asset pricing. Journal of financial economics, 9(4), pp.383-406.
Womack, K.L. and Zhang, Y., 2003. Understanding risk and return, the CAPM, and the Fama-French three-factor model. Available at SSRN 481881. Available at: https://papers.ssrn.com/sol3/papers.cfm?abstract_id=481881 [Accessed on 22 February 2022].
………………………………………………………………………………………………………………………..
Know more about Unique Submission’s other writing services:
