CEN4017 Risk Management Assignment Sample
Module code and Title: CEN4017 Risk Management Assignment Sample
Question 1
As the PDC wants to diversify the use of the dependence of the government of Oman on the Oil as in that the PCD is setting the business complex near the international airport. As it is being analyzed through the decision tree, As through all the different aspects of calculating the Expected Monetary value (Babenko et al. 2019). As the below is the decision tree that is being made using the various inputs like complexes must be small but the total demands is of 8 for the strong and 7 for the weak demands and similarly the demand is medium complex if strong is 14 and for the weak demands is 5. And the weak demand for the large complex is the -9 and for the strong demands is 20.
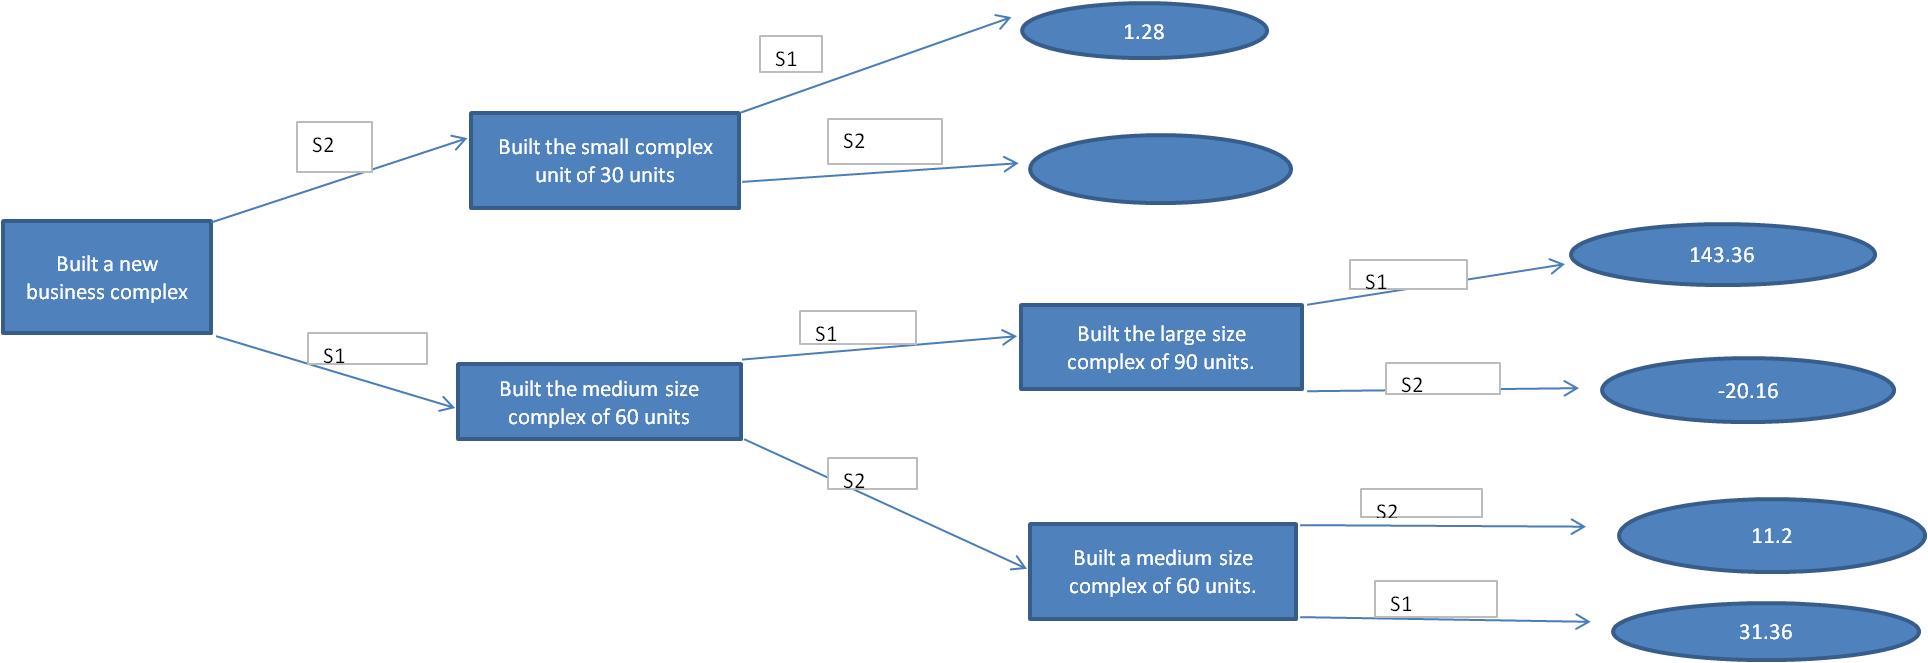 Figure 1: Decision tree with EMV (Source: Self Created in MS – Excel)

As in the in the figure above is the decision tree the S1 represents the strong demand for the units and the S2 represents the demand for the units.As from the above decision tree is is being recommended that the PCD must be able to established the large business complex near the international airport for the purpose of the diversification of the economy as the it is being found that there is the maximum value of the EMV is being generated form the building a large complex of having the 90 units capacity which will be beneficial (Nawaz et al. 2019). As in order to establish the large complex of the capacity of the 90 units, then there is the market research study that needs to be conducted for the acceptance of the results of the establishment of the large complex of the capacity of the 90 units. As this is being again shown with the help of the decision tree that the market report that is being generated will be a favorable one or the unfavorable one. As this is being again analyzed through the decision tree as in that an analysis is being made that the results that are being generated are of the favorable or unfavorable one.
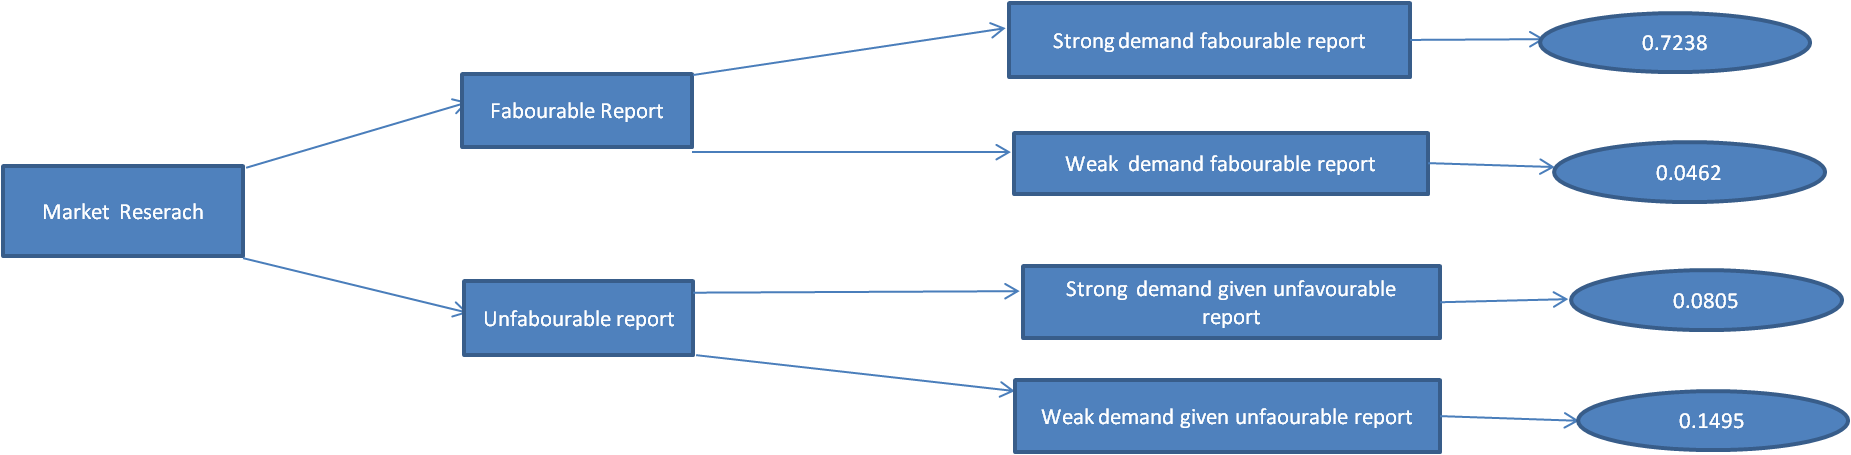 Figure 2: Decision Tree for Market Research (Source: Self Created in MS – Excel)
As it is being seen from the decision tree that there is the report that is being generated is of the favorable one and being advocating the strong demands and it is being calculated after the certain factor are being undertaken as probability for the favorable report is 0.77 and the probability for the unfavorable report is 0.23 and if the market demands is being favorable then the market research for the favorability of the report for the strong demands in the favorable of the report is 0.94 and for the weak demands for the favorability of the report is 0.06 (Akomea-Frimpong et al. 2020). If the market research for the unfavorable report then the strong demand for the unfavorable report is 0.35 and for the unfavorable one is 0.65.
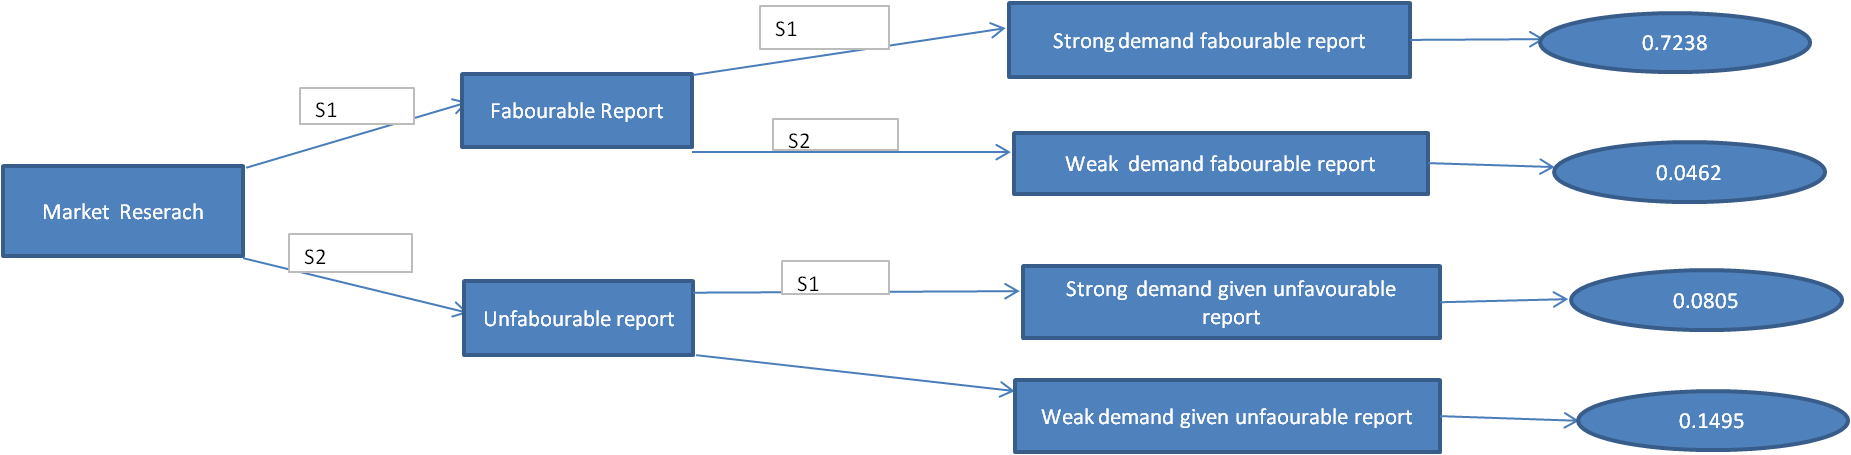 Figure 3: Decision tree with EMV (Source: Self Created in MS – Excel)
As if the prior probability is being applied, the recommended decision would be the establishment of the large complex that is having the capacity of 90 units.
Bayes Rule
Probability that there is a failure in the printer hardware is 0.1
Probability that there is a failure in the printer software is 0.6
Probability that there is a failure in the printer others is 0.3
Probability that there is a failure in the printer hardware problem is 0.9
Probability that there is a failure in the printer software problem is 0.2
Probability that there is a failure in the printer others problem is 0.5
The failure occurs due to the problem in the hardware is the 0.1 X 0.9 = 0.09.
The failure occurs due to the problem in the software is 0.6 X 0.2= 0.12.
The failure occurs due to the problem in the connector is the 0.3 X 0.5 = 0.15.
Question 2
- As the Quality Sweater company is being mailing the catalog of the company as to campaign the products of the company. As it is being depends on a lots of the factors on which it is being depends as being seen and among that it is being found that the response rate is being directly affects the profitability of the as more the response rate more is the profit (Abazid et al. 2018).As it is being found that that the response rate is being found around the 45546 is this is being found for the break even point as in that point the net profit is net losses. If the response rate is being found around 3%, the company is not being continued mailing with the as if response rate is being low then it should not be continued with mailing.
- As from the goal seek it is being found that the goal seek value of the number mailed for 80000 and for the 90000 it is being fronted is being found that it is around 45746 and 54654 as it is the response rate of each value mailed.
3.As the E9 to E11 is being completely modified as it is not be mentioned for the excel as this is being renamed as the range cost and this is being put in the formula as that is being provided so that an updated version of the formula is being seen.
- As the inputs is being put into the model is remain constants but the mail is being increased followed by the increase in mailing and the profit but it is umfraseasble as the mailing consume resources along with too much mailing the customer gets irritated that results in the loss of the customer of the company (Vujović et al. 2020).
Question 3
1
- The simple linear programming model for this program.
- The Fuel Additive X1 contains the mixture 1 is 0.4, the mixture 2 is 0.0, the mixture 3 is 0.6 for each unit of the Fuel Additive X1.
Similarly the Solver Base X2 contains the mixture 1 is 0.5, the mixture 2 is 0.2, the mixture 3 is 0.3 for each unit of the Solver Base X2.
As it is being seen that the total value of the mixture 1 is 20, total value of the mixture 2 is 5, total value of the mixture 3 is 21.
As this the objective function is
Max (X1) 40 + (X2) 30
The constraints is
0.4 X1 + 0.5X2 <= 20
0 X1 + 0.2X2 <= 5
0.6 X1 + 0.3X2 <= 21
X1,X2 >0
On Solving it is found that X2 = 25 and the value of the X1 is around 18.75.
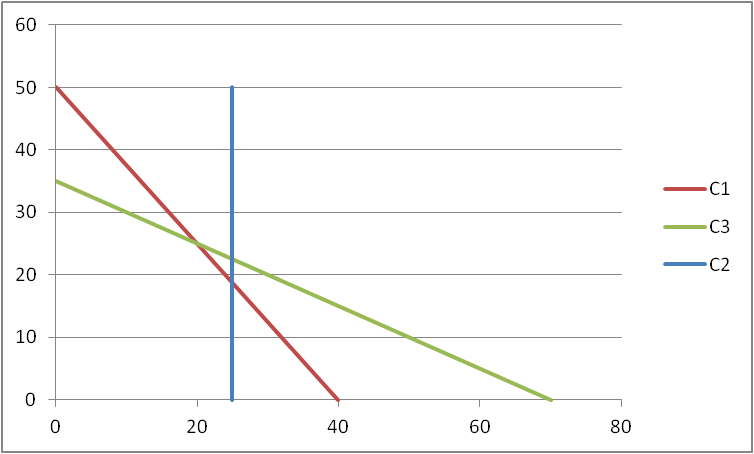 Figure 4: Graphical Solution of the Linear Programming (Source: Self Created in MS – Excel)
As it is being found that the total profit is being found around 1500
(C ) As it is being found that there is some unused material being found in the material as this is being around 2.25 Kilos of the material 3 (Chatterjee et al. 2018).
(d) As it is being observed from the graph that the 0.6 X1 + 0.3X2 <= 21 is being a redundant equation and without that the solution can be obtained.
| Microsoft Excel 12.0 Answer Report | ||||||
| Worksheet: [Decision tree.xlsx]Solver | ||||||
| Report Created: 22-04-2022 14:37:24 | ||||||
| Target Cell (Max) | ||||||
| Cell | Name | Original Value | Final Value | |||
| $E$21 | Unit profit Total Profit | 0 | 1600 | |||
| Adjustable Cells | ||||||
| Cell | Name | Original Value | Final Value | |||
| $C$3 | Number to make Fuel Addditives | 0 | 25 | |||
| $E$3 | Number to make Solver Base | 0 | 20 | |||
| Constraints | ||||||
| Cell | Name | Cell Value | Formula | Status | Slack | |
| $F$11 | Mixture 1 Used | 20 | $F$11<=$H$11 | Binding | 0 | |
| $F$12 | Mixture 2 Used | 4 | $F$12<=$H$12 | Not Binding | 1 | |
| $F$13 | Mixture 3 Used | 21 | $F$13<=$H$13 | Binding | 0 | |
| Microsoft Excel 12.0 Sensitivity Report | ||||
| Worksheet: [Decision tree.xlsx]Solver | ||||
| Report Created: 22-04-2022 14:37:24 | ||||
| Adjustable Cells | ||||
| Final | Reduced | |||
| Cell | Name | Value | Gradient | |
| $C$3 | Number to make Fuel Addditives | 25 | 0 | |
| $E$3 | Number to make Solver Base | 20 | 0 | |
| Constraints | ||||
| Final | Lagrange | |||
| Cell | Name | Value | Multiplier | |
| $F$11 | Mixture 1 Used | 20 | 33.33333366 | |
| $F$12 | Mixture 2 Used | 4 | 0 | |
| $F$13 | Mixture 3 Used | 21 | 44.44444213 | |
As the value of the X1 is around 20 and the value of X2 around 25 and the total profitability is around 1600.
Question 4
| Task Name | Optimistic Time | Most Likely Time | Passimistic Time | Expected Time | Mean Time | Standard Deviation | Variation | |
| 1 | Team meeting | 0.5 | 1 | 1.5 | 1 | 1 | 0.166666667 | 0.027778 |
| 2 | Hire Contractors | 6 | 7 | 8 | 7 | 7 | 0.333333333 | 0.111111 |
| 3 | Network Design | 12 | 14 | 16 | 14 | 14 | 0.666666667 | 0.444444 |
| 4 | Order Ventilation system | 18 | 21 | 30 | 22 | 22 | 2 | 4 |
| 5 | Install Ventilation system | 5 | 7 | 9 | 7 | 7 | 0.666666667 | 0.444444 |
| 6 | Order new racks | 13 | 14 | 21 | 15 | 15 | 1.333333333 | 1.777778 |
| 7 | Install racks | 17 | 21 | 25 | 21 | 21 | 1.333333333 | 1.777778 |
| 8 | Order power supplies and cables | 6 | 7 | 8 | 7 | 7 | 0.333333333 | 0.111111 |
| 9 | Install power supplies | 5 | 5 | 11 | 6 | 6 | 1 | 1 |
| 10 | Install cables | 6 | 8 | 10 | 8 | 8 | 0.666666667 | 0.444444 |
| 11 | Renovation of data centre | 19 | 20 | 27 | 21 | 21 | 1.333333333 | 1.777778 |
| 12 | City inspection | 1 | 2 | 3 | 2 | 2 | 0.333333333 | 0.111111 |
| 13 | Facilities | 7 | 8 | 9 | 8 | 8 | 0.333333333 | 0.111111 |
| 14 | Operations/System | 5 | 7 | 9 | 7 | 7 | 0.666666667 | 0.444444 |
| 15 | Operations/Telecommunications | 6 | 7 | 8 | 7 | 7 | 0.333333333 | 0.111111 |
| 16 | System & applications | 7 | 7 | 13 | 8 | 8 | 1 | 1 |
| 17 | Customer service | 5 | 6 | 13 | 7 | 7 | 1.333333333 | 1.777778 |
| 18 | Power check | 0.5 | 1 | 1.5 | 1 | 1 | 0.166666667 | 0.027778 |
| 19 | Install test servers | 5 | 7 | 9 | 7 | 7 | 0.666666667 | 0.444444 |
| 20 | Management safety check | 1 | 2 | 3 | 2 | 2 | 0.333333333 | 0.111111 |
| 21 | Primary systems check | 1.5 | 2 | 2.5 | 2 | 2 | 0.166666667 | 0.027778 |
| 22 | Set date for move | 1 | 1 | 1 | 1 | 1 | 0 | 0 |
| 23 | Complete move | 1 | 2 | 3 | 2 | 2 | 0.333333333 | 0.111111 |
As the above table shows the Expected time or the expected mean time for above activity for the optimistic time , most likely time , pessimistic duration. As the expected time is the = (optimistic time + 4*most likely time + pessimistic duration)/6
And the standard deviation is = ((pessimistic duration – optimistic time ) /6 )^2 (Doskočil et al. 2018).
3.As it is being found that from the critical activities that the critical path is 69 days and in order to complete the projects in 68 days the probability is 95.8%.
- As the risk is being reduced after considering all the activity that is occurring in the projects (Mahmoudi et al. 2020).
Question 5
| Activity | Activity No. | Preceded by | Followed by | Minimum | Maximum | |
| Start | 1 | — | Pile&Cap E,Pile&Cap C,Pile&Cap W | 0 | 0 | |
| Pile&Cap E | 2 | Start | SubStr E | 18 | 29 | |
| Pile&Cap C | 3 | Start | SubStr C | 13 | 22 | |
| Pile&Cap W | 4 | Start | Substr W | 4 | 12 | |
| SubStr E | 5 | Pile&Cap E | Insitu Span | 18 | 29 | |
| SubStr C | 6 | Pile&Cap C | Insitu Span | 13 | 22 | |
| Substr W | 7 | Pile&Cap W | PC Span | 15 | 25 | |
| Insitu Span | 8 | SubStr E | Surface | 25 | 35 | |
| SubStr C | ||||||
| PC Span | 9 | SubStr C | Surface | 2 | 8 | |
| Substr W | ||||||
| Surface | 10 | Insitu Span | Finished | 2 | 7 | |
| PC Span | ||||||
| Finished | 11 | Surface | End | 10 | 18 | |
| End | 12 | Finished | — | 0 | 0 | |
Reference list
Journal
Akomea-Frimpong, I., Jin, X. and Osei-Kyei, R., 2020. A holistic review of research studies on financial risk management in public–private partnership projects. Engineering, Construction and Architectural Management.
Abazid, M. and Harb, H., 2018. An overview of risk management in the construction projects. Academic Research International, 9(2), pp.73-79.
Vujović, V., Denić, N., Stevanović, V., Stevanović, M., Stojanović, J., Cao, Y., Alhammadi, Y., Jermsittiparsert, K., Van Le, H., Wakil, K. and Radojkovic, I., 2020. Project planning and risk management as a success factor for IT projects in agricultural schools in Serbia. Technology in Society, 63, p.101371.
Chatterjee, K., Zavadskas, E.K., Tamošaitienė, J., Adhikary, K. and Kar, S., 2018. A hybrid MCDM technique for risk management in construction projects. Symmetry, 10(2), p.46.
Doskočil, R. and Lacko, B., 2018. Risk management and knowledge management as critical success factors of sustainability projects. Sustainability, 10(5), p.1438.
Mahmoudi, A., Abbasi, M., Deng, X., Ikram, M. and Yeganeh, S., 2020. A novel model for risk management of outsourced construction projects using decision-making methods: a case study. Grey Systems: Theory and Application.
Know more about UniqueSubmission’s other writing services:
