CIS010-6 ASSIGNMENT SAMPLE – DATA MODELLING AND MANAGEMENT 2022
Question 1:
- There are various advantages of the “Use case diagram” and thus the incorporation of this diagram is necessary. The main aim of the diagram is to identify the main procedures of interaction by the user with the whole system. The main requirements are defined and thus the users will be able to identify the main mediums of interaction with the system.
In the development stage of a database system it is necessary to identify the main parameters that will make the system smooth and user friendly. So the requirement of a “use case diagram” is very necessary. This will help the developers to identify the main parameters and thus the incorporation of necessary elements will be done in the database.
The diagrams are drawn and thus a planning is set at the initial stage of the development. By following the structure of the diagram the database development is done and thus all the necessary functions and parameters are incorporated and are not overlooked. Without a proper diagram it may be possible that necessary functionaries overlooked. But the use of a proper “use cae diagram” will help to overcome this problem. Thus the importance of a “use case diagram” in the development stage of a database is justified.
- A “use case scenario” can be defined as an objective that is needed to be accomplished by the system. This will be achieved by a diagrammatic representation that will consist of various actors and entities. The discussion of the various external factors is also done in a “use case scenario”. Thus the main relationship to achieve the objective is done efficiently.
One of the examples of the “use case scenario” is a “business use case”. These use scenarios are also called the “abstract-level application case”. They pertain to the description of high-level company operations and the several external consultants that are involved in the system. This helps the users to understand the overall scenario and thus the identification of the main parameters are done. This helps to meet the objectives and thus the main goal is achieved.

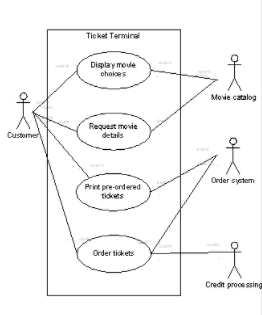
Figure 1: Example of an “Use case Diagram”
(Source:/www.inflectra.com/ideas/topic/use-cases.aspx)
The above figure is used to identify one of the examples of a “Use case Diagram” and thus the concept will be clear about the reason for using this diagram. It is clearly visible that relations are established among various parameters in a particular method or process.
©
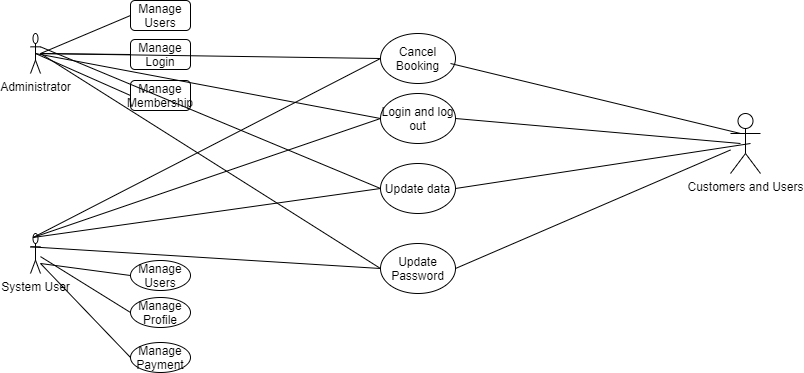
Figure 2: Use case Diagram for membership booking
(Source: draw.io)
The above figure is used to represent the diagram that will be used for the booking of various members and thus the members will be able to book for membership of the club in advance and will be valid for three to four months. The diagram will help the readers to understand the overall process of booking. Three actors are involved in the whole process and the whole process will be supervised by the administrator.
All the activities will be supervised by the person and will be reported to the organizer. Thus the whole process will be complete and the final approval will come from the organizer. After the approval a notification will be sent to the user about the confirmation. Thus the process will be smooth and efficient and the whole process of booking will be completed in a systematic manner.
The detailed description about the main actors in the diagram will enable the viewers to understand their role and the arrows will help them to understand the whole process of booking. Thus the representation is justified and its efficiency is proved.
Question 2
- A “entity relation model” shows data connections in application development in a practical and methodological approach. “ERM” is an idealized drawing or interactive storytelling method for modeling the data in bases that might aid in the construction of a “database engine”. The approach of data modeling can also be used to show the philosophy of a particular topic of interest.
Just like the “relational model”, whenever a central database is incorporated into a management system, conceptual information is transformed to a data structure. Conversely, when practically developed, it is turned into a physical version. While an “ERD” is beneficial for managing data described by a relationship structure, or unorganized data cannot properly be expressed. It is indeed improbable to assist integrate data into an existing organization by itself.
The “ER diagram” shows the structure of the system by specifying the elements, their characteristics and their interrelationship. An “entity” can be an animated or inert major item that can simply be detected. “Students”, “instructors”, “classes” and “courses” might, for example, be viewed as organizations in a “school database”. These items have some useful traits or characteristics. So for this paragraph the main advantages of the model can be understood and the readers will be able to develop a clear idea about the topic.
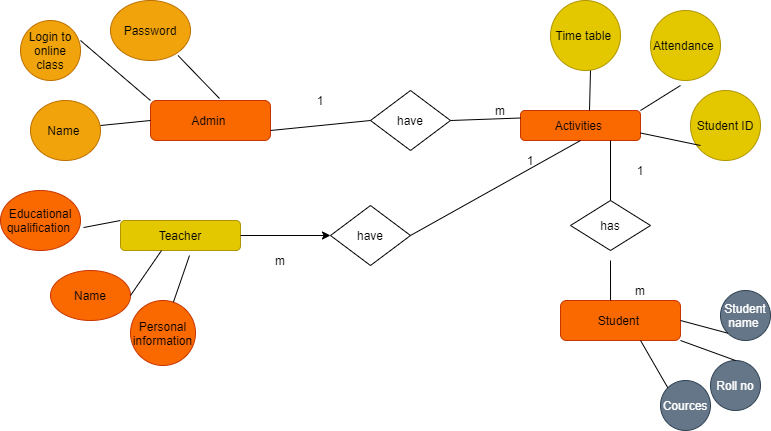
Figure: ER Model Diagram
(Source: draw.io)
Question 3
A.
“SELECT * FROM MEMBER”;
B.
“CREATE TABLE MEMBER ( MemberID int, FirstName varchar(255), Surname varchar(255), ContactEmail varchar(255), ContactNumber varchar(255), Current BOOLEAN NOT NULL)”;
C.
“WHERE” is the “SQL” term, commonly used for specifying the specific status, allowing users to retrieve data out from the appropriate column. In the different other phrases, this term may be utilized that make this word powerful and versatile and assist users to fulfill this criteria. This term is aimed mainly at filtering the information and giving consumers the facts they want and helping them to obtain relevant details from the repository.
D.
“SELECT * FROM MEMBER WHERE MemberID = 1;
SELECT DISTINCT MemberID FROM MEMBER ORDER BY MemberName”;
Question 4
- The process of organization of database files is called “normalization.” This involves building sections and links between databases in accordance with rules meant to safeguard the data as well as to simplify the collection through the use of the elimination of redundancies and inconsistency. Multiple data consumes “disc space” and poses issues with management.
Data in more than just areas can be altered; the data should be altered at all places in pretty much the same way. Changes in customer location may be made simpler if data are saved just in the “customer table” and in the system. Thus the process is very efficient and effective. The effectiveness of the topic can be understood from the above discussion. Some guidelines for the normalization of databases exist.
The “normal form” is referred to in every regulation. The first regulation seems to have been in the “first normal form” when the information is examined. The information is regarded to be in “third normal” form, if the first preconditions are followed. Although further normalization levels are conceivable, throughout most of the purposes, the “third normal form” is regarded as the greatest level. So the concept is understood in detail and thus the readers will be able to understated the concept in detail.
| Name | Authors | Nationality | Format | Price | Subject | Pages | Thickness | Publisher | Publishing Country | Publication Type | Genre name |
| Basic maths | Anderson | England | hardcover | 12 pounds | Maths | 200 | 2 cm | BCD | england | Normal | science |
| basicchemistry | Pattinson | Australian | hardcover | 14 pounds | Chemistry | 300 | 2 cm | PQR | australia | Normal | science |
| Basic Electronics | Broad | England | hardcover | 15 pounds | Electronics | 750 | 2.5 cm | ACE | england | Normal | engineering |
Table 1: Table for normalization
(Source: self created)
| Book ID | Name | Authors | Nationality | Format | Price | Subject | Pages | Thickness | Publisher | Publishing Country | Publication Type | Genre name |
| A1 | Basic maths | Anderson | England | hardcover | 12 pounds | Maths | 200 | 2 cm | BCD | england | Normal | science |
| A2 | basicchemistry | Pattinson | Australian | hardcover | 14 pounds | Chemistry | 300 | 2 cm | PQR | australia | Normal | science |
| A3 | Basic Electronics | Broad | England | hardcover | 15 pounds | Electronics | 750 | 2.5 cm | ACE | england | Normal | engineering |
Table 2: Table after 1NF
(Source: self created)
The above table is used to represent the “1NF” and all the parameters are used to identify various parameters and thus the rule of “1NF” is followed. The table will help the readers to understand the concept of the topic. In this table the primary key is “Book ID”. Thus the readers will be able to understand the topic in detail.
| ID of publisher | Publisher | Publishing Country | Publication Type | Genre name |
| Q1 | BCD | england | Normal | science |
| Q2 | PQR | australia | Normal | science |
| Q3 | ACE | england | Normal | engineering |
Table 3: Table after 2NF
(Source: self-created)
| Book ID | ID of publisher |
| A1 | Q1 |
| A2 | Q2 |
| A3 | Q3 |
Table 5: Table after 2NF
(Sourve: self-created)
The above tables are used to identify the various entities and attributes and the readers will be able to identify the process of “normalization” and the two steps are used to represent the main method.
Reference List
Journals
Bogdanova, D. and Snoeck, M., 2019. CaMeLOT: An educational framework for conceptual data modelling. Information and Software Technology, 110, pp.92-107.
Lemenkova, P., 2019. Numerical Data Modelling and Classification in Marine Geology by the SPSS Statistics. International Journal of Engineering Technologies IJET, 5(2), pp.90-99.
Lv, T., Yan, P. and He, W., 2018, August. Survey on JSON data modelling. In Journal of Physics: Conference Series (Vol. 1069, No. 1, p. 012101). IOP Publishing.
Petrova, E., Pauwels, P., Svidt, K. and Jensen, R.L., 2019. In search of sustainable design patterns: Combining data mining and semantic data modelling on disparate building data. In Advances in informatics and computing in civil and construction engineering (pp. 19-26). Springer, Cham.
Tavast, A., Langemets, M., Kallas, J. and Koppel, K., 2018, July. Unified data modelling for presenting lexical data: The case of ekilex. In Ed. J. Čibej, V. Gorjanc, I. Kosem & Simon Krek, Proceedings of the XVIII EURALEX International Congress: EURALEX: Lexicography in Global Contexts, Ljubljana (pp. 749-761).
Thaller, M., 2017. The Need for Standards: Data Modelling and Exchange [1991]. Historical Social Research/Historische Sozialforschung. Supplement, pp.203-220.
Know more about UniqueSubmission’s other writing services:
