
Corporate Reporting
Introduction
The purpose of the report is to analyse and compare the financial performance of two listed companies that are competing with each other operating in the same sector. The report includes evaluation of financial performance of the companies and their financial statements in relation to the International Financial and Reporting Standards (IFRS) accounting standard to identify and report the relevant issues. The report also discusses the implication of the IFRS implementation on each company.
Selected listed companies from London stock exchange

The chosen companies are Wm Morrison Supermarkets Plc.and Sainsbury Plc.operating in the food and drug retail sector in the United Kingdom. Morrisons is one of the leading supermarket chainsdealing in different food, grocery and medicine product categories. It was founded by William Morrison in 1899 as an egg and butter stall (Morrisons, 2018).The company is operating around 500 stores in North and South England, Scotland and Wales. The company headquarter is located in Bradford in West Yorkshire. The mission of the retailer is to provide access to fresh food to consumers through its products and vision is to continue its expansion to reach top retailer position in the United Kingdom. In 2015, the company market share was 11%which is below in comparison with its competitor like Sainsbury, Tesco, Asda but more than its competitors like Aldi (Business Reporter, 2015). In 2017, the market share fell down reaching at 10.41 % due to in fall of prices and products become cheaper due to high competitive pressure. On the other hand, Sainsbury Plc. is another giant UK based leading retailer that deals in various product categories including both food, drugs, grocery, general Merchandise, clothes and financial services. It was founded by John James Sainsbury in year 1869 and has become second largest supermarket since 2014 chain after Tesco. The company is operating over 600 supermarket stores and few hundreds of convenience stores across UK (Sainsbury’s, 2018). The company headquarter is located in Holborn in London. The company vision is to become more trusted retailer among consumer while focusing on its strategic values related to employees, customer health, sourcing, community, and environment for future business success and growth. In 2015, company market share was 16.9 % (CITY A.M, 2015).
Financial performance of Wm Morrison Supermarkets Plc.
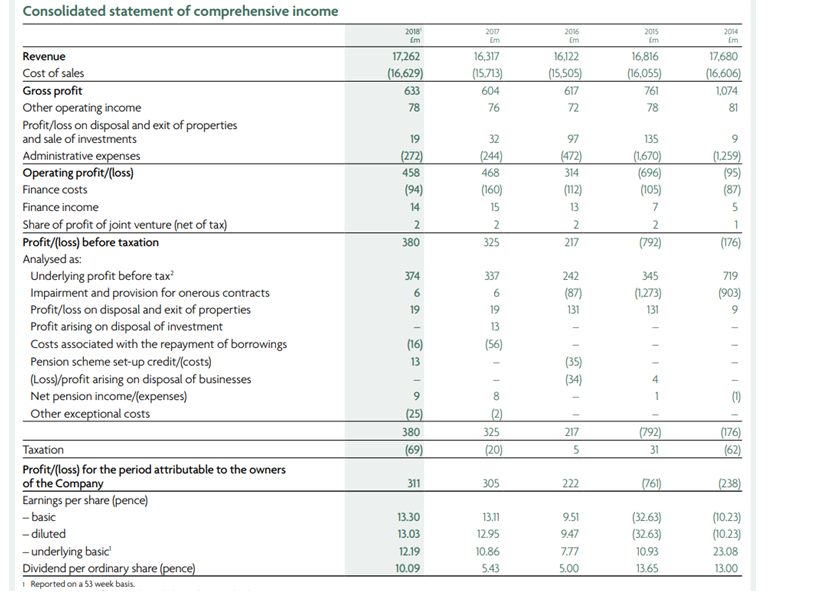
From the analysis of the statement of comprehensive income, it was observed that the revenue of the company has increased by £945m from 2017 to 2018. The revenue of the company for 2017 and 2018 is shown in below figure:
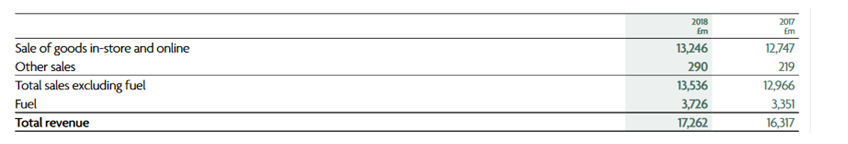
Figure 1: Morrisons Revenue
The gross profit has increased by £29m in 2018. The total comprehensive income for the financial period (ending 4th of Feb. 2018) for the company owners has been increased from £ 410m to £ 556m from 2017 to 2018. From these, it can be said that company has performed well in the market.
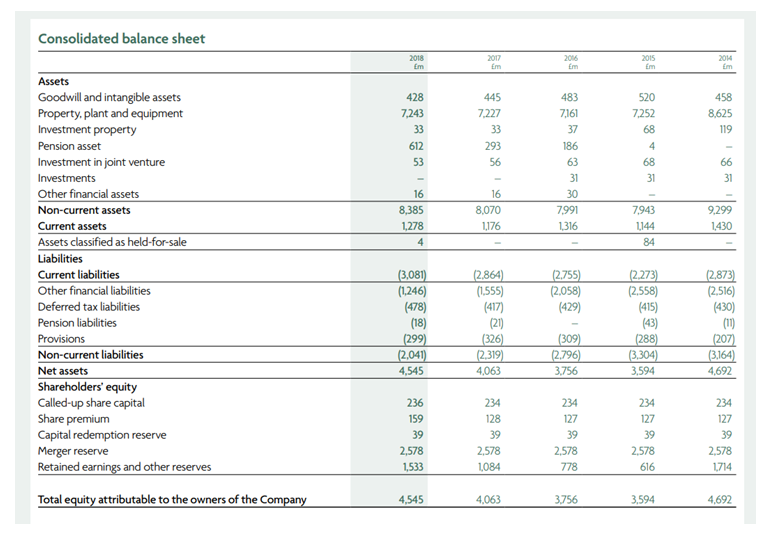
There has been change in equity from £ 4063m (Jan. 2017) to £ 4545m (Feb. 2018). The company financial position is highlighted from the dimensions of asset, liabilities and equity. The current assets have increased from £ 8070m in 2017 to £8385 in 2018 while there has also been a rise in current liabilities from £ 2864m in 2017 to £ 3081m in 2018. The shareholder equity has slightly increased by £2m which accounted for £ 236 m in 2018 as compared to £ 234m in 2017. The profit was accounted at £311m in 2018.
Figure 2: Morrisons Revenue and Profits
In addition, the net cash inflow from the operating activities was lower in 2018 than previous year this is due to low cash generated from retail operations activities and lower interest paid by the company. The net cash outflow from the investing activities was high in 2018 than 2017 due to proceeds from property sale, purchase of new property and assets and also from the purchase of intangible assets by the company owners. Also, the net cash outflow from financing activities was lower in 2018 from 2017 due to less repayment of borrowings and less proceeds on derivative financial instruments settlements and less proceeds from employee share options exercise. The closing net debt was lower in 2018 from previous year by £ 221m.
Ratio analysis of WM Morrison Supermarkets PLC
In order to analyse the ratio, the horizontal ratio analysis is used that compares the ratios on yearly basis.
| Financial Strength | 2018 | 2017 | 2016 | 2015 | 2014 | |
| Working capital | Current Assets – Current Liabilities | -1803 | -1688 | -1439 | -1129 | -1443 |
| Current ratio | Current Assets/Current Liabilities | 41.48% | 41.06% | 47.77% | 50.33% | 49.77% |
| Quick ratio (Acid test) | Liquid assets/current liabilities | 41.48% | 41.06% | 47.77% | 50.33% | 49.77% |
| Debt ratio | Total Assets/ Total Liabilities | 188.66% | 178.39% | 167.66% | 162.94% | 177.72% |
| Times interest earned | EBIT / annual interest expense | 550.72% | 1625.00% | 4340.00% | -2554.84% | -283.87% |
| Efficiency ratio | 2018 | 2017 | 2016 | 2015 | 2014 | |
| Inventory turnover | Cost of sales /Inventory | 503.91 | 476.15 | 419.05 | 236.10 | 139.55 |
| Days inventory outstanding | Inventory turnover/365 | 1.3806 | 1.3045 | 1.1481 | 0.6469 | 0.3823 |
| Account receivable turnover | SALES/Avg. account receivable | 28.21 | 55.69 | 86.68 | 4204.00 | 0.00 |
| Days receivable outstanding | Account receivable turnover/365 | 0.0773 | 0.1526 | 0.2375 | 11.5178 | 0.0000 |
| Accounts payables turnover | Purchases/Avg. account payable | 13.85 | 10.49 | 7.83 | 6.57 | 7.03 |
| Pay outstanding period | Accounts payables turnover/365 | 0.0380 | 0.0287 | 0.0215 | 0.0180 | 0.0193 |
| Cash consumption cycle | (Days inventory outstanding + days sales outstanding) – days payables outstanding | 141.99% | 142.83% | 136.41% | 1214.67% | 36.31% |
| Assets turnover | Net sales /Average total assets | 58.11% | 58.84% | 60.03% | 56.60% | 64.61% |
| Profitability ratio | 2018 | 2017 | 2016 | 2015 | 2014 | |
| Gross profit margin | Gross profit / Net sales | 3.81% | 3.84% | 3.98% | 4.74% | 6.47% |
| Operating profit margin | Operating profit / Net sales | 2.75% | 2.98% | 2.03% | -4.34% | -0.57% |
| ROA | Net income / Total assets | 3.22% | 3.30% | 2.39% | -8.37% | -2.22% |
| ROE | Net income / Average shareholder equity | 6.84% | 7.51% | 5.91% | -21.17% | -5.07% |
| Investment analysis | 2018 | 2017 | 2016 | 2015 | 2014 | |
| EPS | Price per share/Preferred stock dividends | 13.00% | 13.00% | 9.00% | -33.00% | -10.00% |
| P/E ratio | Price of share/EPS | 17.87 | 15.25 | 20.52 | -6.46 | -20.58 |
| Dividend yield Ratio | dividend per share/share price | 4.24% | 2.72% | 2.56% | 6.48% | 6.18% |
| Book value at par | Price/Book Value | 198.08% | 166.58% | 162.58% | 175.67% | 175.42% |
| Gearing ratio | Total debt/equity | 112.70% | 127.57% | 147.79% | 155.18% | 128.67% |
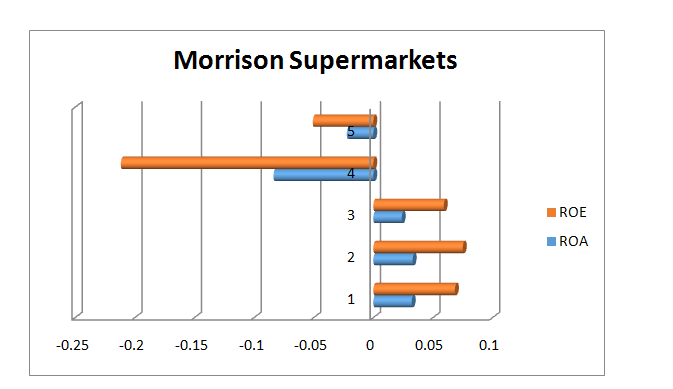
Figure: ROI and ROE
The above ratio analysis is based on previous five years balance sheet and income statements that are as given below:
Source: Annual report (Morrison Supermarkets), 2018
Financial performance of Sainsbury Plc.
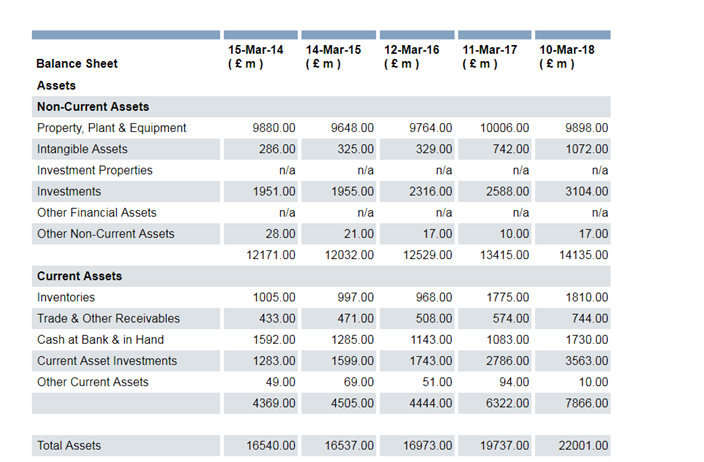
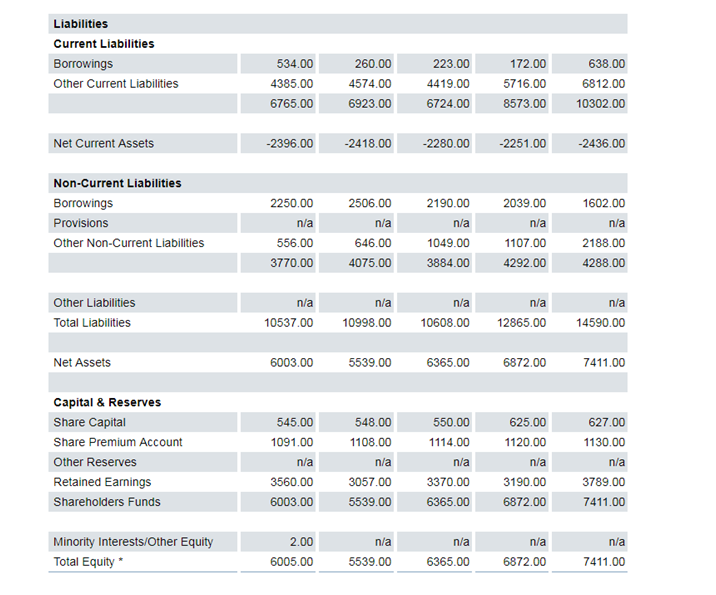
The financial statements analysed from the annual report of the company highlight the increase in revenue of the company from 2017 to 2018 by £2232m. The value ofgross profit is accounted to be £1882m in 2018 which has increased by £248m from previous year (2017).The change in total equity from £ 6872m (March 2017) to £ 7411m (March 2018) highlights changes in capital balance due to change in owner equity, replacement of current assets and events involving equity changes. The net cash generated in 2018 from the operating activities was higher in 2018 (£1365m) than previous year (£1153m in 2017) this is due to high increase in trade, receivables, payables, increase in amount due to customer deposits in financial services and decrease in liabilities. The net cash used in 2018 for the investing activities was low in 2018 (£470m) from 2017 (£750m). This is due to low investment in purchases of assets, low joint venture investments and low amount of dividends and distributions received. Also, the net cash used in 2018 for the financing activities was lower (£244m) in 2018 than 2017 (£466m) due to low repayment of borrowings and of capital borrowing and low amount of dividend paid on the ordinary shares. Thus, the closing cash and cash equivalents was high in 2018 (£1728m) than in previous year (£1077m). There has been an increase in the value of current assets from £ 6322m in 2017 to £7857 in 2018 thus, the total assets including non-current assets is higher in 2018 (£ 22001m) than 2017 (£ 19798m). Also, the current liabilities are high in 2018 at £ 10302m than 2017 which was reported at £ 8586m. The total equity has increased from 2017 to 2018 i.e. £ 6872m to £ 7411m. The profit for the financial year was £ 309m in 2018 which is lower than 2017 (£377m). The revenue and profits of the company for 2017 and 2018 is shown in below figure:
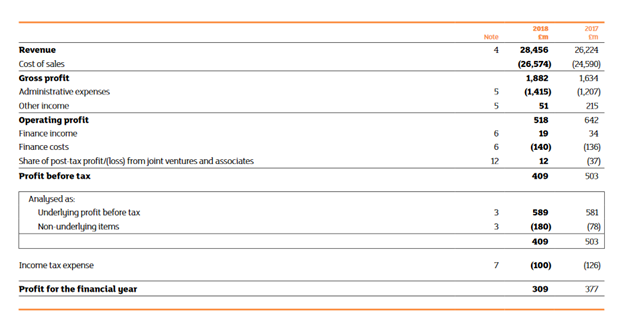
Figure 3: Sainsbury’s Revenue and Profits
Ratio analysis of Sainsbury
In order to analyse the ratio, the horizontal ratio analysis is used that is comparing the ratios on basis of years.
| SAINSBURY PLC | 2018 | 2017 | 2016 | 2015 | 2014 |
| Financial Strength | |||||
| Working capital | -2436.00 | -2251.00 | -2280.00 | -2418.00 | -2396.00 |
| Current ratio | 76.35% | 73.74% | 66.09% | 65.07% | 64.58% |
| Quick ratio (Acid test) | 16.79% | 12.63% | 17.00% | 18.56% | 23.53% |
| Debt ratio | 150.80% | 153.42% | 160.00% | 150.36% | 156.97% |
| Times interest earned | 409.00% | 399.21% | 711.69% | -76.60% | 493.41% |
| Efficiency ratio | |||||
| Inventory turnover | 17.5365 | 16.4011 | 26.6829 | 26.2006 | 26.2219 |
| Days inventory outstanding | 0.0480 | 0.0449 | 0.0731 | 0.0718 | 0.0718 |
| Account receivable turnover | 42.6626 | 50.7178 | 50.8445 | 55.4607 | 60.8614 |
| Days receivable outstanding | 0.1169 | 0.1390 | 0.1393 | 0.1519 | 0.1667 |
| Accounts payables turnover | 49.7508 | 169.2558 | 115.8251 | 100.4692 | 49.3502 |
| Pay outstanding period | 0.1363 | 0.4637 | 0.3173 | 0.2753 | 0.1352 |
| Cash consumption cycle | 2.86% | -27.98% | -10.49% | -5.15% | 10.34% |
| Assets turnover | 144.27% | 147.50% | 152.18% | 157.96% | 159.33% |
| Profitability ratio | |||||
| Gross profit margin | 0.0593 | 0.0561 | 0.0564 | 0.0462 | 0.0526 |
| Operating profit margin | 1.82% | 2.45% | 3.01% | 0.34% | 4.21% |
| ROA | 1.40% | 7.21% | 8.30% | 0.95% | 11.70% |
| ROE | 4.17% | 5.49% | 7.40% | -3.00% | 11.92% |
| Investment analysis | |||||
| EPS | 20.4 | 21.8 | 24.2 | 26.4 | 32.8 |
| P/E ratio | 1827.00% | 1522.00% | 1144.00% | N/a | 832.00% |
| Dividend yield Ratio | 420.00% | 383.00% | 443.00% | 587.00% | 552.00% |
| Book value at par | 288.91p | 280.15p | 313.71p | 271.64p | 299.76p |
| Gearing ratio (debt to equity ratio) | 688.00% | 1641.00% | 1995.00% | 2674.00% | 1986.00% |
Source: www.londonstockexchange.com
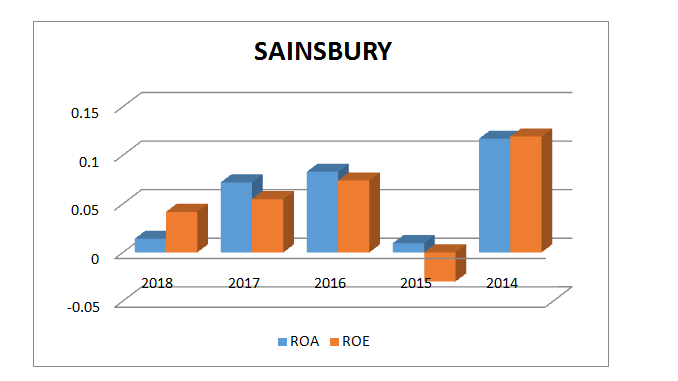
Figure: ROI and ROE
Comparison of the financial performance of both companies:
Sainsbury has shown a positive growth in the revenue, growth in basic earnings per share from the previous year but profits remained lower than the previous year performance and as analysed from the financial statements. On the other hand, Morrisons has a much better financial performance in terms of profits than its previous year and as compared to Sainsbury.
Analysis of financial statements preparation
Wm Morrison Supermarkets Plc has prepared the financial statements for 53 weeks that ended in February 2018 on the basis of IFRS and IFRS Interpretation committee (IFRS IC) standard. Thus, IFRS accounting standard been adopted by the company to prepare for financial reporting. The company has reported the financial data in pound sterling and the financial data has also been rounded to nearest million. The financial data has also been disclosed to two decimals where relevant. The company has prepared ratios that are based IFRS accounting standard like PE ratio, EPS growth, revenue per share, operating margin, return on capital employed, dividend per share growth and others. The basis of preparation of the financial statements in J Sainsbury Plc for 52 weeks ending in March 2018 is IFRS accounting standards. The statements are in sterling pound and also rounded off to nearest million. The financial statements in both the selected public listed companies’ are prepared on the basis of ongoing concern and the preparation of these statements are also based on the use of historical cost of accounting rule. The IFRS standards used by Morrisons are IFRS 9 (Financial Instruments) for financial liabilities and assets, IFRS 15 (Revenue from Contracts with Customers), and IFRS 16 (Leases) for lessee accounting. The IFRS standards used by Sainsbury are IFRS 9 (Financial Instruments), IFRS 3 (Business communications), IFRS 15 (Revenue from Contracts with Customers), IFRS 11 (Joint Arrangements) and IFRS 12 (Disclosure of Interests in Other Entities).
Discussion on reporting issues for the selected companies’ financial performance
It can be discussed that there is potential reporting issue related to the revenue recognition practices in Morrisons as though under the IFRS rules company to recognize revenue it allows the estimation of delivering cost for upgrades spread out for five years but it present issue to managers in exercising their judgments and require introduction of new opportunities to develop or intentional shift the estimates that the follow-on revenue are close enough to achieve the financial goals. Similarly, this reporting issue of revenue recognition can be related to Sainsbury as this will demand the investors to have a closer look on the assumptions made and the procedure and methods adopted by the company in the estimation of costs and also review the method used for reporting of revenues.
The reporting issue indentified for both companies is the use of alternative performance measures in their corporate reporting to measure group performance which is not recognized by the IFRS (De George and Shivakumar, 2016). The measures such are these measure are Like-for-like (LFL) sales considered to be relevant in the evaluation of group financial position and results. In particularly, Morrison alternative performance measures apart from LFL sales also includes free cash flow, underlying earnings per share (EPS), underlying profit before tax (UPBT), and underlying operating profit.
Discussion on the implication of the implementation of IFRS accounting standards
The implication of IFRS accounting standard implementation is on the overall accounting profession (Christensen et al., 2015). The implication for both companies will be in terms of the change in accounting practices and polices followed by them. The implication for IFRS implementation has been increased cost in preparation of the financial statements as per the international standards and not the local accounting (UK) standards. In Morrison, the implications are on preparation of statements which recognises the balance sheet derivative with fair value measurements and limits the use of hedge accounting (Morales-Díaz and Zamora-Ramírez, 2018). For Sainsbury, the implication is seen on foreign direct investments, full recognition given to the pension deficit and impact on accounting practices in terms of revised accounting for the cash flow for investment activities like merger and acquisitions. The application of IFRS accounting standard in the reporting has similar elements like segment reporting, non-segregation of extraordinary item in income statement and computation of earnings per share and related calculation of other financial indicators and ratios.
References
Business Reporter. 2015. Morrisons tops supermarket sales growth figures [Online] Available at: https://www.business-reporter.co.uk/2015/06/30/morrisons-tops-supermarket-sales-growth-figures/#gsc.tab=0 (Accessed: 5 November 2018).
Christensen, H.B., Lee, E., Walker, M. and Zeng, C., 2015. Incentives or standards: What determines accounting quality changes around IFRS adoption?.European Accounting Review, 24(1), pp.31-61.
CITY A.M., 2015.Asda overtaken by Sainsbury’s as UK’s second largest supermarket but big four continue to slide [Online] Available at: http://www.cityam.com/207026/sainsburys-overtakes-asda-become-uks-second-largest-supermarket-big-four-continue-slide (Accessed: 5 November 2018).
De George, E.T., Li, X. and Shivakumar, L., 2016.A review of the IFRS adoption literature.Review of Accounting Studies, 21(3), pp.898-1004.
Morales-Díaz, J. and Zamora-Ramírez, C., 2018. The Impact of IFRS 16 on Key Financial Ratios: A New Methodological Approach. Accounting in Europe, 15(1), pp.105-133.
Morrisons. 2018. Company History [Online] Available at: https://www.morrisons-corporate.com/about-us/company-history/ (Accessed: 5 November 2018).
Sainsbury’s. 2018. About us [Online] Available at: http://www.about.sainsburys.co.uk/about-us/our-vision (Accessed: 5 November 2018).
