
Corporate Social Responsibility Disclosure and firm’s financial performance: a study of listed oil and gas firms in Nigeria
CHAPTER THREE: METHODOLOGY AND DATA
This chapter emphasizes on the overview of methodology such as research methods and data collection method for the study. It reflects on identifying the detailed aspects of the research methods to operationalize the study such as selection of data, data collection, sample size, sampling method, and data analysis for CSR disclosure for accurate interpretation of the study findings.

This chapter covers the philosophy, approach, design, methodology, selection of suitable methods for collection, presenting, analyzing and representation of data and findings to conduct the research in an effective manner.
To gain an understanding of the background and nature of research issue, the research philosophy serves as a valuable guidance to the researcher on the way the research is carried out.
The research philosophy provides a fundamental base to establish contextual knowledge and develop rational to underline the opinion, assumption and beliefs of the researcher (Moon and Blackman, 2014).
In this study, the research philosophy assists the researcher to comprehend the research objectives to provide a suitable research framework and approaches for collection of research primary and secondary data, method of data analysis to form valid outcome.
Within the scope of the research, the core types of research philosophies are interpretivism, positivism. In this, Interpretivism can be used to develop theoretical understanding of the research problems and issue.
At the same time Positivism philosophy is effective to collect the numerical data. This philosophy enables the researcher collects the information and data based on the facts of the research.
The researcher makes use of positivism philosophy which is built on a structured method to assist the researcher in generalisation and attain measurable observation to determine the results statistically. This philosophy stresses on the observation for factual understanding which is quantifiable by means of statistical methods (Collis and Hussey, 2013).
Here, the researcher collects the required facts and figures from general sources to fulfil research aim and objectives. The research role is vital for the study to evaluate collected data to reach conclusive results and to conduct the research effectively.
The positivism philosophical approach was used to determine the relationship between Corporate Social Responsibility Disclosure (CSRD) and firm’s financial performance.
Under positivism philosophy, to attain research aim and objectives the researcher use quantitative method to fulfil the data requirement employ a highly structured method and focus on quantifiable data for its statistical analysis to reach conclusive outcomes (Moon and Blackman, 2014)
.Thus, this research philosophy offers fundamental principle for approaching data requirements through data collection, analysis and its interpretation to yield a consistent and reliable finding from the study.
Research approach offers justification to the research from wide assumptions to comprehensive interpretation in view of nature of research issue (Crowther and Lancaster, 2012).
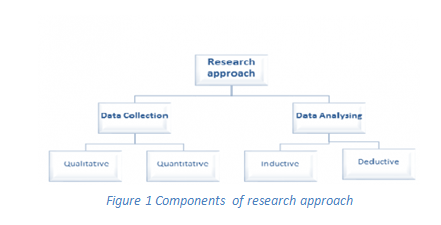
It is a method that explains the approach for collection of data, analysis and its interpretation. The two core components of research approach are data collection and data analysis. Data collection comprises of qualitative and quantitative technique whereas data analysis includes deductive or inductive reasoning techniques.
The quantitative data collection is adopted for this research. Additionally, the researcher preferred deductive research approach over inductive research as it avoid risk and there is availability of short time to complete the research. Deductive research approach explores a known phenomenon and test the validity of the theory is valid in a logical way (Crowther and Lancaster, 2012).
Thus, in this approach the reasoning initiates with a theory towards a new proposition. The theory was assessed by with study observations to either reject or confirm the hypothesis.
The deductive reasoning initiates form general to the specific as it encompassed hypotheses formulation and testing whereas inductive does not involve in development and testing of hypotheses. The data collection and analysis are done methodically that offer flexibility to arrive at valid outcome in an effective manner.
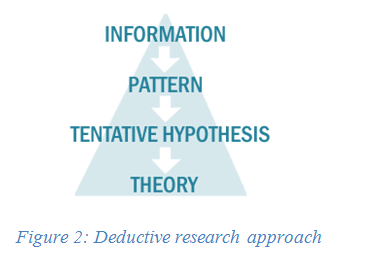
Figure 2: Deductive research approach
3.4 Research Design and Methodology
The research methodology takes account of the theoretical assumptions to recognize the research design for this study along with methodology for data collection and analysis (Creswell, 2013). This enables the researcher to consider the research objectives in a systematic order to reach conclusive findings.
For this study, methodology serve as a methodical investigation to determine the relationship among CSRD and firm financial performance and the application of CSRD by oil and gas firms and its related impact.
Accordingly, to address these research objectives, the nature of research is quantifiable thus; quantitative research design was adopted to determine the CSDR and its impact on firm financial performance. The study is of quantitative nature as it tests objective theory by exploring the relationship among the variables (Choy, 2014).
The quantitative research design makes use of statistical tools to examine the research data numerically to provide apt outcomes (Cortina et al., 2017).Thus, under this research design the underlying theory and variables relationship was evaluated to outline the facts.
The research was conducted for Nigerian oil and gas companies. In this research, the researcher makes use of secondary research to collect research data which was shown in tabular form, charts and graphical representation using data management and statistical tools.
Moreover, the quantitative data was used by the researcher to obtain an in-depth knowledge of CSRD by oil and gas firms in Nigeria. The consequent step was the collection of research data using appropriate method.
In research, the data can be obtained as primary and secondary methods. The data collections methods provide assistance to the researcher to specify the nature of the research (O’Leary, 2013).
Under the primary research method of data collection, new data is obtained by the researcher through method such as survey, questionnaire, interview, opinion poll, experimentation etc.
This research method is a repetitious process which is costly and time consuming. In the secondary research, the data is to obtain as a comparable data and data from other sources such as academic books, articles, journals, eBooks, business magazines, newspaper, and online available published data.
In this research, the researcher has adopted secondary method of data collection to collect the research data. The secondary data was collected through review of literature to address the research objectives and the research data was primarily obtained from annual reports of the listed oil and gas companies on the stock exchange in Nigeria.
The data obtained through secondary method fulfil the quantitative data requirement for this research.
The secondary research provides justification from the literature study to the research observation to comprehend the research questions (Goodwin, 2012). This secondary method has helped the researcher to complete the research in a short period.
Moreover, as the research approach is deductive in nature it was employed as the secondary data findings which helped the researcher to develop precision about the underlying theory for the research and in comparing the finding of the research.
In this research, in order to collect the data, annul report of the companies are concerned it is because annual report is one of the trusted sources in the data collection method. Data in the annual report is fully authorized by the company and its financial team.
3.6 Sampling procedure and sample size
The identification of an appropriate sampling procedure is a central aspect to obtain a sample is representative of the population for an extensive generalisation. The method of probability sampling was adopted in this quantitative research.
The method of probability sampling was preferred over non- probability sampling as it offers equal chances of the population participant of being chosen in the research and permit the researcher to choose participating members to obtain valid outcome (Yeager et al., 2011). Under this probability sampling, random sampling method was adopted to avoid the researcher bias.
Population Sample: The population sample for this study include participation from all the 13 oil and gas companies that were listed on the Nigerian Stock Exchange (NSE).
The population sample includes only oil and gas companies under non-financial sector as these firms have a direct and negative impact on the environment due to its peculiar business nature and activities. At the same time, these firms also play a major contribution for the economic development of the nation.
Sample Size: The sample size for this study includes the number of participant companies selected by the researcher to gather data to address the research questions.
The sample size decided for the study that 8 companies are drawn from 13 oil and gas companies listed on the Nigerian Stock Exchange. The chosen sample size is enough in order to achieve the aim and objective of the research study. On the other hand, the selection of the 13 as the sample size can make the research study more complicated.
The data for a period of three years from 2014 to 2016 was used. Thus, a sample size of 8 listed oil and gas companies was randomly selected to understand the relationship between CSRD and financial performance of the oil and gas companies.
To realize the aim of this research to determine out whether there is a significant relationship between and corporate social responsibility disclosure and financial performance of listed Nigerian oil and gas firms. This research has adopted content analysis method for the analysis of data from corporate annual reports of listed Nigerian firms.
Content analysis provides a systematic and replicable analysis of text data through classification of data and systematic coding to help the researcher to draw conclusive information and valid outcomes for this research (Wu et al., 2010). The analysis covers the visible components of message and latent text contents. The various steps in the content analysis for a quantitative research design are exhibited in below figure.
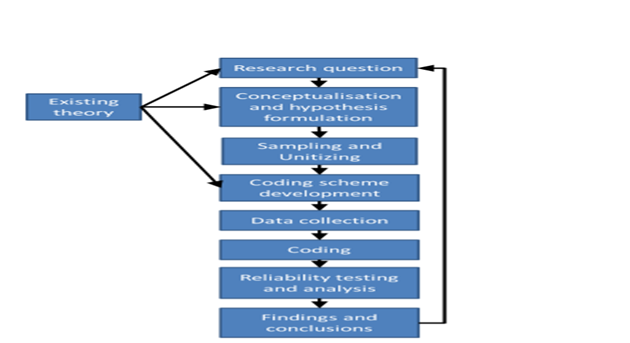
Figure 3: Content analysis in a quantitative research
According to Kothari et al. (2009), the annual reports serve useful to identify the components of environmental disclosure in corporate social responsibility. The annual reports for the period of three years from 2014-2016was used for obtaining data for statistically analysis and interpretation.
In addition to this, the research data was analysed using data management tool such as MS Excel for distribution of data in tables and to represent the data in charts to interpret the research findings. The study employs multiple regression analysis for the statistical analysis of the data collected to present data that focus on relevant information to address each research question.
This multiple regression method predicts the value of dependent variable from exploratory variables (Davis, 2010). Thus, this method of analysis was used by the researcher to predict the unidentified value of a dependent variable from the recognized value of other two or more independents variables. In the research as Corporate Social Responsibility Disclosure and firm’s financial performance, the independent variable is CSRD and financial performance of the company is depended variable
Few limitations for the research are required to be considered. The first limitation was that the research only examined a period of three years from annual reports of sampled oil and gas companies.
This was due to lack of availability of data to consider more than three-year period at the time of data collection. It was also not possible to consider the annual reports of all the companies which were due to limitation of time factor which poses significant limitation for this research.
According to O’Leary (2013), the time constraint can produce a negative impact on the overall study findings. Another limitation of this research was that it focuses on the secondary research and did not employ primary method as a result, the study underlines on the company annual reports.
As companies also disclose its CSR initiatives in sustainability reports, company brochure, interim reports, CSR reports, company website, newspaper, etc. this can provide a partial view of the CSR disclosure, its impact and relationship with firm financial performance in Nigeria.
3.9 Reliability, validity and generalisability
In order to improve the reliability, validity and generalisability of the research, the researcher focused on the each step in the research. For this, it generated all the data and information from the authorized. It improved the reliability and validity of the research. At the same time, references are given for generalisability of the research.
3.10 Ethical Consideration
In the research study, ethical consideration is associated with the some kind of issue such as copyright violation, plagiarism etc. In order to mitigate these issues, in this research, the researcher was taken the help of the information source in bibliography. The researcher was also written all the information in their words and provided the citation of the source that helped the company to find out. It helps the researcher to effectively eliminate the issues related to privacy and confidentiality in the research.
3.11 Conclusion
From the above discussion, it can be concluded that the use of positivism philosophical, deductive research approach, literature review, secondary are quite appropriate for this research study as this methodology enabled the researcher to collect data and information in appropriate ways to accomplish research successfully. Moreover, the probability sampling is used in this research by selective 8 companies of the Nigeria oil and gas industry.
Chapter 4: Findings & Discussion
4.1 Introduction
This chapter provides the key findings and their discussion in relation to the findings of literature review. It is helpful to develop conclusion to present the main outcomes of the study in next chapter.
4.2 Findings
The annual reports of the selected oil and gas companies in Nigeria have supported to identify that these firms are concerned towards CSR and gives focus towards social responsibility performance indicators. In this context, these firms have shown major disclosure towards human resources, community, environment, consumers and products and financial performance.
Above discussion has supported to analyze the research outcome on the basis of annual report data analysis from the year 2012 to 2016 and the literature review findings. Initially, researcher has discussed the facts and figures of annual report of the selected eight Nigerian organizations and further researcher has correlated the findings of annual report from the literature review outcome.
It has supported to develop effective research outcome while giving concern towards reliability and validity.
From the data analysis, following findings are obtained:
JAPAUL OIL:
| JAPAUL OIL | |||||
| 2012 | 2013 | 2014 | 2015 | 2016 | |
| Revenue | 12281 | 13029.92 | 10572.22 | 8148.58 | 3078.8 |
| Cost of sales | 7282.5 | 7123.16 | 6373.89 | 5918 | 3873.35 |
| Gross profits | 7999.1 | 5906.77 | 4198.33 | 2230.58 | -794.55 |
| Net profit | 271.7 | 239.75 | -2699.92 | -7653.96 | -22010.18 |
| CSRD | 2.25 | 2 | 1.58 | 1.42 | 1.167 |
| ROA | 0.009 | 0.007 | -0.070 | -0.211 | -0.690 |
| ROE | 0.02 | -0.01 | -0.61 | -0.59 | -1.39 |
From the above graph, it can be determined that the flow of the CSRD of the company is similar as the ROA and ROE. In this, it can be seen that as decreasing the ROA and ROE, the spending on the CSR. Japaul Oil has been successful to maintain the level of the spending. CSRD decreased according to the level of the ROE and ROA. Hence, it can be said that there is a significant relationship between the CSRD and profitability ratios such ROE and ROA.
| SUMMARY OUTPUT | ||||||||
| Regression Statistics | ||||||||
| Multiple R | 0.42677617 | |||||||
| R Square | 0.1821379 | |||||||
| Adjusted R Square | -1.666666667 | |||||||
| Standard Error | 9733.705809 | |||||||
| Observations | 1 | |||||||
In the context of JAPAUL Oil, it can be discussed that this firm has shown that this firm is showing the attitude of fluctuation in the context of CSR spending. In the year, 2012, its spending was 7.6 Millions of NGN which were decreased by 4.1 Millions of NGN in the year 2016.
Due to this reason, it is also analyzed that decrease in CSR investment, firm profit is also decreasing and firm is showing loss tendency. Although to recover from this situation, from the year 2014 and 2015, firm has increased its CSR investment from 3.6 Millions of NGN to 4.1 Millions of NGN but still firm not become able to manage the loss status and the firm loss has shown increase tendency.
It reflects that although CSR impacts the financial performance of the firm however, there are other factors also which are impacting the net profit of the organization. Due to this reason, however firm has increased the CSR investment but still firm not become able to improve the net profit.
At the same time, from the regression statistics, it is analyzed that the value of R square is only 0.18, which reflects that there is not a strong relationship between CSR and net profit.
| JAPAUL OIL | ||
| Independent variable CSRD | Dependent Variable ROA | Dependent variable ROE |
| Significance/ Prob | 0 | 0 |
| R-Square % | 16% | 36% |
| Observation | 1 | 1 |
On the basis of the above table, it can be determined that the independent variable is CSRD and dependent variables are ROA and ROE. In the context significance, the value is identified 0 for both. In the same concern of this, value of the R-Squar2e found 16% and 36%. In the regression analysis, the observation value is also found 12 for both dependent variables.
T-TEST
| Paired Samples Statistics | |||||
| Mean | N | Std. Deviation | Std. Error Mean | ||
| Pair 1 | CSRD | 1.6833 | 5 | .43859 | .19614 |
| ROE | -.5168 | 5 | .57261 | .25608 | |
| Paired Samples Correlations | ||||
| N | Correlation | Sig. | ||
| Pair 1 | CSRD & ROE | 5 | .936 | .019 |
| Paired Samples Test | |||||||||
| Paired Differences | t | df | Sig. (2-tailed) | ||||||
| Mean | Std. Deviation | Std. Error Mean | 95% Confidence Interval of the Difference | ||||||
| Lower | Upper | ||||||||
| Pair 1 | CSRD – ROE | 2.20013 | .22392 | .10014 | 1.92210 | 2.47817 | 21.970 | 4 | .000 |
| Paired Samples Statistics | |||||
| Mean | N | Std. Deviation | Std. Error Mean | ||
| Pair 1 | CSRD | 1.6833 | 5 | .43859 | .19614 |
| ROA | -.1909 | 5 | .29274 | .13092 | |
| Paired Samples Correlations | ||||
| N | Correlation | Sig. | ||
| Pair 1 | CSRD & ROA | 5 | .831 | .081 |
| Paired Samples Test | |||||||||
| Paired Differences | t | df | Sig. (2-tailed) | ||||||
| Mean | Std. Deviation | Std. Error Mean | 95% Confidence Interval of the Difference | ||||||
| Lower | Upper | ||||||||
| Pair 1 | CSRD – ROA | 1.87422 | .25433 | .11374 | 1.55843 | 2.19000 | 16.478 | 4 | .000 |
On the basis of the above T-test analysis, it is found that the significance value between the CSRD and ROE is 0 indicating significant relationship between variables as it is less than the significance value of 0.05 rejecting null hypothesis. In the same concern of this, significance value between the CSRD and ROA is 0 that is also less than 0.05 implies that there is a significant relationship between CSR and ROA for JAPAUL OIL.
At the same time, the correlations found 0.936 and 0.831 that shows there is positive relationship in the CSRD with ROA and ROEA.
UNIVARIATE ANALYSIS
| Between-Subjects Factors | ||
| N | ||
| ROA | -0.689565959217254 | 1 |
| -0.210922502798444 | 1 | |
| -0.0697086170923881 | 1 | |
| 0.00671214838946094 | 1 | |
| 0.00906640806881621 | 1 | |
| ROE | -1.38859181160225 | 1 |
| -0.610388670850591 | 1 | |
| -0.587995879244344 | 1 | |
| -0.0129224662803132 | 1 | |
| 0.0159042313567521 | 1 | |
| Tests of Between-Subjects Effects | |||||
| Dependent Variable:CSRD | |||||
| Source | Type III Sum of Squares | df | Mean Square | F | Sig. |
| Corrected Model | .769a | 4 | .192 | . | . |
| Intercept | 14.168 | 1 | 14.168 | . | . |
| ROA | .000 | 0 | . | . | . |
| ROE | .000 | 0 | . | . | . |
| ROA * ROE | .000 | 0 | . | . | . |
| Error | .000 | 0 | . | ||
| Total | 14.938 | 5 | |||
| Corrected Total | .769 | 4 | |||
| a. R Squared = 1.000 (Adjusted R Squared = .) | |||||
MRS (CHEVRON):
| MRS (CHEVRON) | |||||
| Millions of NGN | 2012 | 2013 | 2014 | 2015 | 2016 |
| Revenue | 79,727 | 87786.32 | 92325.4 | 87099.22 | 109635.05 |
| Cost of sales | 74,015 | 83010.06 | 85366.81 | 80676.76 | 100879.94 |
| Gross profits | 5,711 | 4776.26 | 6958.6 | 6422.46 | 8755.11 |
| Net profit | 205.1 | 634.42 | 746.4 | 935.62 | 1465.9 |
| CSRD | 1.1 | 1.4 | 1.6 | 1.8 | 2.1 |
| ROA | 0.003 | 0.010 | 0.012 | 0.015 | 0.020 |
| ROE | 0.011 | 0.032 | 0.037 | 0.045 | 0.066 |
The above graph show that CSRD is increasing continues for MRS (Chevron). At the same time, it can be seen that ROE and ROA are also growing that depicts company is generating the good profit. In the context of corporate social responsibility, it is found that company is increasing their spending that is reason that CSRD is increasing.
From the data analysis of MRS (CHEVRON), it is analyzed that this leading oil and gas producer firm of Nigeria is showing good financial performance as its net profit is increasing on a continuous basis. Although in the year 2012-13, firm has shown slight decrease in net profit. However, after 2013, firm has shown continuous growth.
At the same time, it is analyzed that firm also shown continuous growth in CSR disclosure. In the year 2012, the total spending of the firm towards CSR was 4 Millions of NGN, which was increased by 16.3 Millions of NGN in 2016. Moreover, this firm has shown increase in revenue, cost of sales, gross profits and net profit from the year 2012 to 2016.
| SUMMARY OUTPUT | |
| Regression Statistics | |
| Multiple R | 0.944777718 |
| R Square | 0.892604936 |
| Adjusted R Square | -1.666666667 |
| Standard Error | 174.0249497 |
| Observations | 1 |
In like manner, the value of R square is 0.89 which reflects that there is a strong correlation between CSR and net profit. From the above finding, it can be discussed that the CSR disclosure of MRS (CHEVRON) is highly effective for the firm performance. It is assisting the firm towards the increase of the growth chances. So, increase in CSR also enabling the firm towards the increase in net profit.
| MRS (CHEVRON) | ||
| Independent variable CSRD | Dependent Variable ROA | Dependent variable ROE |
| Significance/ Prob | 0 | 0 |
| R-Square % | 85% | 87% |
| Observation | 1 | 1 |
The above table shows that the value of the significant for ROA and ROE are 0.0 and 0.0 respectively. At the same time, the value of R-Square for ROA and ROE are 85% and 87%. In the same concern of this, the observation value for the both dependent variable are for 1 in the regression analysis.
| Paired Samples Statistics | |||||
| Mean | N | Std. Deviation | Std. Error Mean | ||
| Pair 1 | CSRD | 1.6000 | 5 | .38079 | .17029 |
| ROA | .0121 | 5 | .00611 | .00273 | |
| Paired Samples Correlations | ||||
| N | Correlation | Sig. | ||
| Pair 1 | CSRD & ROA | 5 | .988 | .001 |
| Paired Samples Test | |||||||||
| Paired Differences | t | df | Sig. (2-tailed) | ||||||
| Mean | Std. Deviation | Std. Error Mean | 95% Confidence Interval of the Difference | ||||||
| Lower | Upper | ||||||||
| Pair 1 | CSRD – ROA | 1.58790 | .37475 | .16759 | 1.12258 | 2.05321 | 9.475 | 4 | .001 |
| Paired Samples Statistics | |||||
| Mean | N | Std. Deviation | Std. Error Mean | ||
| Pair 1 | CSRD | 1.6000 | 5 | .38079 | .17029 |
| ROE | .0381 | 5 | .02007 | .00897 | |
| Paired Samples Correlations | ||||
| N | Correlation | Sig. | ||
| Pair 1 | CSRD & ROE | 5 | .986 | .002 |
| Paired Samples Test | |||||||||
| Paired Differences | t | df | Sig. (2-tailed) | ||||||
| Mean | Std. Deviation | Std. Error Mean | 95% Confidence Interval of the Difference | ||||||
| Lower | Upper | ||||||||
| Pair 1 | CSRD – ROE | 1.56185 | .36101 | .16145 | 1.11359 | 2.01011 | 9.674 | 4 | .001 |
The above table shows that the significant value between CSRD – ROA and CSRD – ROE are 0.001 that is low in the both. It implies that the values are less than the significance value (0.05) that indicates null hypothesis can be rejected showing strong relationship between CSRD and business performance in terms of ROA and ROE.
At the same time, the correlation values are 0.988 and 0.986 in the given order showing stronger relationship between variables.
UNIVARIATE ANALYSIS
| Between-Subjects Factors | ||
| N | ||
| ROA | 0.00319729560235607 | 1 |
| 0.0104611812461404 | 1 | |
| 0.0120834124566967 | 1 | |
| 0.0150010778387141 | 1 | |
| 0.0197749121534703 | 1 | |
| ROE | 0.0107641383624759 | 1 |
| 0.032320299146932 | 1 | |
| 0.0369173790639288 | 1 | |
| 0.0446015029565264 | 1 | |
| 0.0661392610666744 | 1 | |
| Tests of Between-Subjects Effects | |||||
| Dependent Variable:CSRD | |||||
| Source | Type III Sum of Squares | df | Mean Square | F | Sig. |
| Corrected Model | .580a | 4 | .145 | . | . |
| Intercept | 12.800 | 1 | 12.800 | . | . |
| ROA | .000 | 0 | . | . | . |
| ROE | .000 | 0 | . | . | . |
| ROA * ROE | .000 | 0 | . | . | . |
| Error | .000 | 0 | . | ||
| Total | 13.380 | 5 | |||
| Corrected Total | .580 | 4 | |||
| a. R Squared = 1.000 (Adjusted R Squared = .) | |||||
FORTE OIL PLC:
| FORTE OIL PLC | |||||
| Millions of NGN | 2012 | 2013 | 2014 | 2015 | 2016 |
| Revenue | 90,284 | 128027.74 | 170127.98 | 124617.24 | 148605.26 |
| Cost of sales | 80839 | 115400.14 | 151663.05 | 106255.81 | 128021.35 |
| Gross profits | 10145 | 12627.61 | 18464.93 | 18361.43 | 20583.91 |
| Net profit | 1007 | 5004.4 | 4456.62 | 5794.06 | 2890.43 |
| CSRD | 1.17 | 1.50 | 1.42 | 1.5 | 1.08 |
| ROA | 0.02 | 0.07 | 0.04 | 0.04 | 0.02 |
| ROE | 0.13 | 0.38 | 0.36 | 0.44 | 0.26 |
On the basis of the above graph, it can be said that there is a significant relationship between the profitability and CSR spending of the company because CSRD trend and ROA and ROE trends are following in the similar manner. However, CSRS trend decreased at the some extent in the financial year 2014 due to decline in the profitability. But in 2015, it was increased with the ROA and ROE that shows it is flowing with profitability ratio of the company.
From the data findings of FORTE OIL PLC, it is analyzed that the year 2012 to 2014, firm has shown increased trend in CSR spending. In this context, firm has spent 32.2 Millions of NGN to 44.16 Millions of NGN and this amount remained stable in 2015. However, in the year 2016, the CSR spending has hugely decreased from 44.16 to 10 Millions of NGN.
This was a big decrement which has taken place in the firm. At the same time, from the tabular data of the firm from 2012 to 2016, it can be discussed that the net profit, gross profits, cost of sales and revenue of the firm is showing fluctuation trend in this time span.
Especially, in the context of net profit, it is evaluated that the net profit of the firm has shown huge decrease from the year 2015 to 2016. In like manner, it has also supported to identify that the CSR spending of the firm is highest in the year 2014 and 2015 and in the year 2015, the net profit of the firm was also highest.
It also reflects that as the company’ financial performance was well due to which firm also become able to increase its CSR spending on a continuous basis. However, in the year 2016, firm has decreased the investment in CSR and this decrease has also shown negative impact towards the organizational performance.
| SUMMARY OUTPUT | |
| Regression Statistics | |
| Multiple R | 0.562697631 |
| R Square | 0.316628624 |
| Adjusted R Square | -1.666666667 |
| Standard Error | 1816.246651 |
| Observations | 1 |
From the regression statistics, it is analyzed that the value of R Square is 0.31, which reflects that there is average relationship between CSR and net profit.
| FORTE OIL PLC | ||
| Independent variable CSRD | Dependent Variable ROA | Dependent variable ROE |
| Significance/ Prob | 0 | 0 |
| R-Square % | 35% | 32% |
| Observation | 1 | 1 |
On the basis of the above table, it can be determined that the independent variable is CSRD and dependent variables are ROA and ROE. In the context significance, the value is identified 0 for both. In the same concern of this, value of the R-Square found 35% and 32%. In the regression analysis, the observation value is also found 12 for both dependent variables.
| Paired Samples Statistics | |||||
| Mean | N | Std. Deviation | Std. Error Mean | ||
| Pair 1 | CSRD | 1.3333 | 5 | .19543 | .08740 |
| ROA | .0390 | 5 | .01866 | .00835 | |
| Paired Samples Correlations | ||||
| N | Correlation | Sig. | ||
| Pair 1 | CSRD & ROA | 5 | .838 | .076 |
| Paired Samples Test | |||||||||
| Paired Differences | t | df | Sig. (2-tailed) | ||||||
| Mean | Std. Deviation | Std. Error Mean | 95% Confidence Interval of the Difference | ||||||
| Lower | Upper | ||||||||
| Pair 1 | CSRD – ROA | 1.29437 | .18008 | .08053 | 1.07078 | 1.51797 | 16.072 | 4 | .000 |
| Paired Samples Statistics | |||||
| Mean | N | Std. Deviation | Std. Error Mean | ||
| Pair 1 | CSRD | 1.3333 | 5 | .19543 | .08740 |
| ROE | .3146 | 5 | .12216 | .05463 | |
| Paired Samples Correlations | ||||
| N | Correlation | Sig. | ||
| Pair 1 | CSRD & ROE | 5 | .855 | .065 |
| Paired Samples Test | |||||||||
| Paired Differences | t | df | Sig. (2-tailed) | ||||||
| Mean | Std. Deviation | Std. Error Mean | 95% Confidence Interval of the Difference | ||||||
| Lower | Upper | ||||||||
| Pair 1 | CSRD – ROE | 1.01872 | .11091 | .04960 | .88100 | 1.15644 | 20.538 | 4 | .000 |
In this, it is found that the significance values are zero for both ROA and ROE with CSRD in t test indicating rejection of null hypothesis means there is a significant relationship between both variables. At the same time, the correlation value is found 0.838 and 0.855. It shows that there is positive relation of ROA and ROE with the CSRD.
UNIVARIATE ANALYSIS
| Between-Subjects Factors | ||
| N | ||
| ROA | 0.0228984598838262 | 1 |
| 0.0229546241674376 | 1 | |
| 0.0365422073063588 | 1 | |
| 0.0443995634266943 | 1 | |
| 0.0679987513905238 | 1 | |
| ROE | 0.132799813051624 | 1 |
| 0.255416859599948 | 1 | |
| 0.358303344878486 | 1 | |
| 0.383675321927239 | 1 | |
| 0.442884605829903 | 1 | |
| Tests of Between-Subjects Effects | |||||
| Dependent Variable:CSRD | |||||
| Source | Type III Sum of Squares | df | Mean Square | F | Sig. |
| Corrected Model | .153a | 4 | .038 | . | . |
| Intercept | 8.889 | 1 | 8.889 | . | . |
| ROA | .000 | 0 | . | . | . |
| ROE | .000 | 0 | . | . | . |
| ROA * ROE | .000 | 0 | . | . | . |
| Error | .000 | 0 | . | ||
| Total | 9.042 | 5 | |||
| Corrected Total | .153 | 4 | |||
| a. R Squared = 1.000 (Adjusted R Squared = .) | |||||
Mobil Oil Nig Plc:
| MOBIL OIL NIG PLC | |||||
| Millions of NGN | 2012 | 2013 | 2014 | 2015 | 2016 |
| Revenue | 80,802 | 78744.1 | 79583.74 | 64220.9 | 94107.68 |
| Cost of sales | 72590 | 68803.95 | 68846.44 | 53229.85 | 78403.39 |
| Gross profits | 8,212 | 9940.16 | 10737.3 | 10991.05 | 15704.3 |
| Net profit | 2,878 | 3480.78 | 6392.79 | 4872.93 | 8154.29 |
| CSRD | 1.36 | 1.55 | 2.00 | 1.73 | 2.18 |
| ROA | 0.02 | 0.09 | 0.14 | 0.09 | 0.14 |
| ROE | 0.02 | 0.36 | 0.47 | 0.32 | 0.38 |
The above graph shows that net profit margin of the company is increasing continuously. In this, it is also seen that Mobile Oil Nig Plc is also able to generate the sufficient return on the assets and equity. The company spent high on the CSR during the financial year 2014 but after this performance declined at the some extent.
| SUMMARY OUTPUT
|
|
| Regression Statistics | |
| Multiple R | 0.964755522 |
| R Square | 0.930753216 |
| Adjusted R Square | -1.666666667 |
| Standard Error | 655.1316418 |
| Observations | 1 |
In the context of Mobil Oil Nig Plc, it is analyzed that CSR spending of the firm is increasing from 2012 (25.4 Millions of NGN) to 2014 (70.3 Millions of NGN) and in the year 2015 it remained stable. In like manner, in the year 2016 (110 Millions of NGN), its CSR spending has also increased.
Additionally, in the context of net profit, it is analyzed that the net profit of the firm was 2,878 Millions of NGN in 2012 which was increased by 6392.79 Millions of NGN in 2014.
However, in 2015, firm has not increased the spending on CSR, due to which it is analyzed that the net profit of the firm has shown decreased trend. Furthermore, in 2016, firm has invested 110 Millions of NGN on CSR.
This is the huge amount in the context of CSR investment but this investment remained fruitful for the firm as its net profit was increased from 4872.93 Millions of NGN (in 2015) to 8154.29 Millions of NGN (in 2016). In like manner, the R square value of Mobile Oil Nig Plc, in the context of CSR and net profit is .96, which directly indicates towards the strong relationship between both the factors.
| ANOVA | ||||||||
| df | SS | MS | F | Significance F | ||||
| Regression | 5 | 17306663.33 | 3461332.667 | 40.32331181 | #NUM! | |||
| Residual | 3 | 1287592.404 | 429197.4681 | |||||
| Total | 8 | 18594255.74 | ||||||
| Coefficients | Standard Error | t Stat | P-value | Lower 95% | Upper 95% | Lower 95.0% | Upper 95.0% | |
| Intercept | 655.1316418 | 3 | 218.3772139 | 2.11746E-07 | 645.5843029 | 664.6789807 | 645.5843029 | 664.6789807 |
| Net profit | 1560.653875 | 637.4756475 | 2.44817803 | 0.091828328 | -468.0781439 | 3589.385894 | -468.0781439 | 3589.385894 |
| CSR spending | 59.16958731 | 9.317951448 | 6.350063921 | 0.007900619 | 29.51570716 | 88.82346747 | 29.51570716 | 88.82346747 |
On the other hand, above data analysis has supported to evaluate that the P-value of net profit is higher than .091 which is higher than .05 so this value is significant. However, the CSR spending is less than .05 as it is .007 which reflects that it is not a significant value.
From the overall evaluation, it can be interpreted that increase in CSR spending directly impacts the organizational financial performance as increase in the CSR practices has shown the tendency of increase in net profit in the context of Mobile Oil Nig Plc.
| MOBIL OIL NIG PLC | ||
| Independent variable CSRD | Dependent Variable ROA | Dependent variable ROE |
| Significance/ Prob | 0 | 0 |
| R-Square % | 59% | 31% |
| Observation | 1 | 1 |
The above table shows that the value of the significant for ROA and ROE are 0.0 and 0.0 respectively. At the same time, the value of R-Square for ROA and ROE are 59% and 31%. In the same concern of this, the observation value for the both dependent variable are for 1 in the regression analysis.
| Paired Samples Statistics | |||||
| Mean | N | Std. Deviation | Std. Error Mean | ||
| Pair 1 | CSRD | 1.7636 | 5 | .33154 | .14827 |
| ROA | .0974 | 5 | .05141 | .02299 | |
| Paired Samples Correlations | ||||
| N | Correlation | Sig. | ||
| Pair 1 | CSRD & ROA | 5 | .913 | .030 |
| Paired Samples Test | |||||||||
| Paired Differences | t | df | Sig. (2-tailed) | ||||||
| Mean | Std. Deviation | Std. Error Mean | 95% Confidence Interval of the Difference | ||||||
| Lower | Upper | ||||||||
| Pair 1 | CSRD – ROA | 1.66622 | .28536 | .12762 | 1.31190 | 2.02054 | 13.056 | 4 | .000 |
| Paired Samples Statistics | |||||
| Mean | N | Std. Deviation | Std. Error Mean | ||
| Pair 1 | CSRD | 1.7636 | 5 | .33154 | .14827 |
| ROE | .3101 | 5 | .17331 | .07751 | |
| Paired Samples Correlations | ||||
| N | Correlation | Sig. | ||
| Pair 1 | CSRD & ROE | 5 | .751 | .144 |
| Paired Samples Test | |||||||||
| Paired Differences | t | df | Sig. (2-tailed) | ||||||
| Mean | Std. Deviation | Std. Error Mean | 95% Confidence Interval of the Difference | ||||||
| Lower | Upper | ||||||||
| Pair 1 | CSRD – ROE | 1.45349 | .23166 | .10360 | 1.16584 | 1.74114 | 14.029 | 4 | .000 |
The above conducted T test determines that the value of the T test is identified zero for both ROA and ROE with CSRD. It means these values are less than significance value of 0.05 indicating there is a significant relationship between both variables.
In this, the correlation value is identified 0.913 and 0.144 that mean that there is strong relationship between the CSRD and ROA. On the other hand, there is week relationship between ROE and CSRD as per correlation analysis.
UNIVARIATE ANALYSIS
| Between-Subjects Factors | ||
| N | ||
| ROA | 0.0157955610313598 | 1 |
| 0.0939380110276864 | 1 | |
| 0.0943464319866298 | 1 | |
| 0.140866357752928 | 1 | |
| 0.14213292432924 | 1 | |
| ROE | 0.016766864732611 | 1 |
| 0.317177838238932 | 1 | |
| 0.364952299470623 | 1 | |
| 0.380020505650705 | 1 | |
| 0.471811770957493 | 1 | |
| Tests of Between-Subjects Effects | |||||
| Dependent Variable:CSRD | |||||
| Source | Type III Sum of Squares | df | Mean Square | F | Sig. |
| Corrected Model | .440a | 4 | .110 | . | . |
| Intercept | 15.552 | 1 | 15.552 | . | . |
| ROA | .000 | 0 | . | . | . |
| ROE | .000 | 0 | . | . | . |
| ROA * ROE | .000 | 0 | . | . | . |
| Error | .000 | 0 | . | ||
| Total | 15.992 | 5 | |||
| Corrected Total | .440 | 4 | |||
| a. R Squared = 1.000 (Adjusted R Squared = .) | |||||
ETERNA PLC:
| ETERNA PLC | |||||
| Millions of NGN | 2012 | 2013 | 2014 | 2015 | 2016 |
| Revenue | 89637.47 | 98296.9 | 81942.5 | 92065.35 | 106887.57 |
| Cost of sales | 88223.67 | 95412.46 | 78925.8 | 88985.05 | 98319.2 |
| Gross profits | 1413.8 | 2884.45 | 3016.69 | 3080.3 | 8568.37 |
| Net profit | 946.35 | 703.17 | 1289.56 | 1278.08 | 1477.57 |
| CSRD | 1.25 | 1.04 | 1.46 | 1.42 | 1.58 |
| ROA | 0.039 | 0.027 | 0.070 | 0.054 | 0.049 |
| ROE | 0.15 | 0.10 | 0.15 | 0.13 | 0.14 |
On the basis of the above graph, it can be determined that the trends of ROA, ROE and CSRD are growing well in the market. CSRD trend is increasing as the profitability ratios such as ROA and ROE. It means that company is expending in the social activities according to profitability.
From the discussion of ETERNA PLC, it is analyzed that CSR spending of the firm has increased by double (approx.) from the year 2012 (6.5 Millions of NGN) to 2015 (12.7 Millions of NGN). At the same time, it has increased by 15.6 Millions of NGN in 2016.
Similarly this firm has shown the growth trend in the context of net profit. The net profit of the firm was 946.35 Millions of NGN in 2012 which was increased by 1477.57 Millions of NGN in 2016. At the same time, firm’s revenue, cost of sales and gross profits of the firm has also increased from the year 2012 to 2016.
In like manner, R square value of CSR and net profit is 0.98, which represents that there is a strong correlation between both these parameters. From this, it can be interpreted that due to increase in CSR spending, net profit is also increasing.
| ANOVA | |||||
| df | SS | F | Significance F | ||
| Regression | 5 | 376725.7448 | MS | 161.9801658 | #NUM! |
| Residual | 3 | 6977.25693 | 75345.14896 | ||
| Total | 8 | 383703.0017 | 2325.75231 | ||
| Coefficients | Standard Error | t Stat | P-value | Lower 95% | Upper 95% | Lower 95.0% | Upper 95.0% | |
| Intercept | 0 | 0 | ||||||
| X Variable 1 | 9.298E-253 | 9.298E-253 | ||||||
| X Variable 2 | -5.571E-252 | 5.571E-252 | ||||||
| X Variable 3 | -7.2831E-253 | 1.9999E-252 | ||||||
| X Variable 4 | 452.943758 | 58.05547979 | 7.801912234 | 0.004382891 | 268.1853109 | 637.7022052 | 268.1853109 | 637.7022052 |
| X Variable 5 | 65.87307874 | 5.175794707 | 12.72714288 | 0.001046427 | 49.40139 | 82.34476748 | 49.40139 | 82.34476748 |
On the other hand, from the p-value evaluation it is analyzed that the value of net profit as well as CSR are not significant as their values are lesser than .05, i.e. .004 and .001.
| ETERNA PLC | ||
| Independent variable CSRD | Dependent Variable ROA | Dependent variable ROE |
| Significance/ Prob | 0 | 0 |
| R-Square % | 56% | 26% |
| Observation | 1 | 1 |
On the basis of the above table, it can be determined that the independent variable is CSRD and dependent variables are ROA and ROE. In the context significance, the value is identified 0 for both. In the same concern of this, value of the R-Square found 56% and 26%.
In the regression analysis, the observation value is also found 12 for both dependent variables.
| Paired Samples Statistics | |||||
| Mean | N | Std. Deviation | Std. Error Mean | ||
| Pair 1 | CSRD | 1.3500 | 5 | .20958 | .09373 |
| ROA | .0480 | 5 | .01602 | .00716 | |
| Paired Samples Correlations | ||||
| N | Correlation | Sig. | ||
| Pair 1 | CSRD & ROA | 5 | .765 | .132 |
| Paired Samples Test | |||||||||
| Paired Differences | t | df | Sig. (2-tailed) | ||||||
| Mean | Std. Deviation | Std. Error Mean | 95% Confidence Interval of the Difference | ||||||
| Lower | Upper | ||||||||
| Pair 1 | CSRD – ROA | 1.30198 | .19759 | .08836 | 1.05664 | 1.54732 | 14.734 | 4 | .000 |
| Paired Samples Statistics | |||||
| Mean | N | Std. Deviation | Std. Error Mean | ||
| Pair 1 | CSRD | 1.3500 | 5 | .20958 | .09373 |
| ROE | .1337 | 5 | .02123 | .00950 | |
| Paired Samples Correlations | ||||
| N | Correlation | Sig. | ||
| Pair 1 | CSRD & ROE | 5 | .671 | .215 |
| Paired Samples Test | |||||||||
| Paired Differences | t | df | Sig. (2-tailed) | ||||||
| Mean | Std. Deviation | Std. Error Mean | 95% Confidence Interval of the Difference | ||||||
| Lower | Upper | ||||||||
| Pair 1 | CSRD – ROE | 1.21632 | .19596 | .08764 | .97300 | 1.45964 | 13.879 | 4 | .000 |
On the basis of the above T-test analysis, it is found that the significance value between the CSRD and RAE is zero presenting a relationship between the variables. In the same concern of this, significance value between the CSRD and ROA is also zero presenting relationship between the variables.
At the same time, the correlations found 0.671 and 0.765 that shows, there is positive relationship in the CSRD with ROA and ROEA.
UNIVARIATE ANALYSIS
| Between-Subjects Factors | ||
| N | ||
| ROA | 0.0273260696463665 | 1 |
| 0.0394443981327109 | 1 | |
| 0.0490434979451665 | 1 | |
| 0.0542337208241482 | 1 | |
| 0.070046656670296 | 1 | |
| ROE | 0.0988905280715102 | 1 |
| 0.131976204465638 | 1 | |
| 0.136456870127843 | 1 | |
| 0.147934104567613 | 1 | |
| 0.153153666728424 | 1 | |
| Tests of Between-Subjects Effects | |||||
| Dependent Variable:CSRD | |||||
| Source | Type III Sum of Squares | df | Mean Square | F | Sig. |
| Corrected Model | .176a | 4 | .044 | . | . |
| Intercept | 9.113 | 1 | 9.113 | . | . |
| ROA | .000 | 0 | . | . | . |
| ROE | .000 | 0 | . | . | . |
| ROA * ROE | .000 | 0 | . | . | . |
| Error | .000 | 0 | . | ||
| Total | 9.288 | 5 | |||
| Corrected Total | .176 | 4 | |||
| a. R Squared = 1.000 (Adjusted R Squared = .) | |||||
Total Nigeria Plc:
| Total Negeria Plc | |||||
| Millions of NGN | 2012 | 2013 | 2014 | 2015 | 2016 |
| Revenue | 2,17,844 | 238163.16 | 240618.69 | 208027.69 | 290952.52 |
| Cost of sales | 1,91,632 | 209461.53 | 212714.4 | 183274.38 | 241850.72 |
| Gross profits | 26,211 | 28701.63 | 27904.29 | 24753.31 | 49101.8 |
| Net profit | 4,670 | 5334.09 | 4423.73 | 4047.05 | 14797.09 |
| CSRD | 2 | 2.1 | 2 | 1.9 | 2.5 |
| ROA | 0.07 | 0.07 | 0.05 | 0.05 | 0.13 |
| ROE | 0.41 | 0.40 | 0.32 | 0.25 | 0.63 |
On the behalf of the above graph, it can be determined that there is a significant relationship between the ROE and CSRD. It is because the trend of the CSRD has increased and decreased as similar to the ROE. Therefore, it can be said there is significant relationship between the profitability and CSRD.
From the data evaluation of Total Nigeria Plc, it is identified that the net profit of the firm has shown huge increase from the year 2012 to 2016. However, in the contrary, it is identified that the CSR spending of the firm has not increased according to it.
In the year 2012, the CSR spending of the firm was 46.52 Millions of NGN, which was increased by 65 Millions of NGN in 2016. At the same time, the net profit of the firm was 4,670 Millions of NGN in 2012 which was increased by 14797.09 Millions of NGN.
On the other hand, it is analyzed that in the year 2013, firm has increased its CSR spending by 46.52 to 50.67 Millions of NGN and during this time span firm’s net profit has also increased by 4,670 to 5,334.09 Millions of NGN.
In like manner, it is analyzed that in the year 2014, firm has decreased its CSR spending from 50.67 to 4423.73 Millions of NGN and the net profit of the firm has also decreased from 5334.09 to 4423.73 Millions of NGN.
This decrease remained continue in the year 2015 as well and in this year, firm’s CSR spending was 28.93 Millions of NGN and the net profit was 28.93 Millions of NGN.
However, in the year 2016, this firm has increased its CSR spending from 28.93 to 65 Millions of NGN and this increase has shown drastic increase in the net profit of the firm and it has increased by 4047.05 to 14797.09 Millions of NGN. From the above analysis,
it can be interpreted that in the year 2013, 2014 and 2015, the CSR spending of the firm has decreased due to which the net profit of the firm has also decreased. In addition, it is also analyzed that the value of R square is 0.71, which reflects that there is a strong relationship between CSR and net profit.
| ANOVA | |||||
| df | SS | MS | F | Significance F | |
| Regression | 5 | 59647286.94 | 11929457.39 | 7.421481987 | #NUM! |
| Residual | 3 | 24111338.02 | 8037112.674 | ||
| Total | 8 | 83758624.96 | |||
| Coefficients | Standard Error | t Stat | P-value | Lower 95% | Upper 95% | Lower 95.0% | Upper 95.0% | |
| Intercept | 0 | 0 | ||||||
| Net profit | -6291.733808 | 4918.414987 | -1.279219794 | 0.290790189 | -21944.32541 | 9360.857792 | -21944.32541 | 9360.857792 |
| CSR spending | 283.0125439 | 103.8867993 | 2.724239708 | 0.07229055 | -47.60161678 | 613.6267046 | -47.60161678 | 613.6267046 |
In like manner, from the data, it can be evaluated that the P-value of the firm in the context of net profit is .30 and the values of CSR is .47. Both the values are higher than .05 which reflects that the values of net profit and CSR are significant. From the overall evaluation,
it can be interpreted that increase in CSR spending has also supported the firm to increase the net profit of the firm. In the context of Total Nigeria Plc, it is analyzed that increase in CSR practices is assisting the firm to increase the net profit, which is supporting the firm to improve its financial performance.
| Total Nigeria Plc | ||
| Independent variable CSRD | Dependent Variable ROA | Dependent variable ROE |
| Significance/ Prob | 0 | 0 |
| R-Square % | 87% | 96% |
| Observation | 1 | 1 |
The above table shows that the value of the significant for ROA and ROE are 0.0 and 0.0 respectively. At the same time, the value of R-Square for ROA and ROE are 87% and 96%. In the same concern of this, the observation value for the both dependent variable are for 1 in the regression analysis.
| Paired Samples Statistics | |||||
| Mean | N | Std. Deviation | Std. Error Mean | ||
| Pair 1 | CSRD | 2.1000 | 5 | .23452 | .10488 |
| ROA | .0736 | 5 | .03553 | .01589 | |
| Paired Samples Correlations | ||||
| N | Correlation | Sig. | ||
| Pair 1 | CSRD & ROA | 5 | .979 | .004 |
| Paired Samples Test | |||||||||
| Paired Differences | t | df | Sig. (2-tailed) | ||||||
| Mean | Std. Deviation | Std. Error Mean | 95% Confidence Interval of the Difference | ||||||
| Lower | Upper | ||||||||
| Pair 1 | CSRD – ROA | 2.02643 | .19985 | .08938 | 1.77828 | 2.27458 | 22.673 | 4 | .000 |
| Paired Samples Statistics | |||||
| Mean | N | Std. Deviation | Std. Error Mean | ||
| Pair 1 | CSRD | 2.1000 | 5 | .23452 | .10488 |
| ROE | .4021 | 5 | .14282 | .06387 | |
| Paired Samples Correlations | ||||
| N | Correlation | Sig. | ||
| Pair 1 | CSRD & ROE | 5 | .957 | .011 |
| Paired Samples Test | |||||||||
| Paired Differences | t | df | Sig. (2-tailed) | ||||||
| Mean | Std. Deviation | Std. Error Mean | 95% Confidence Interval of the Difference | ||||||
| Lower | Upper | ||||||||
| Pair 1 | CSRD – ROE | 1.69788 | .10628 | .04753 | 1.56592 | 1.82985 | 35.722 | 4 | .000 |
In this, it is found that the significance values are zero in the t test for both ROE and ROA with CSRD indicating a significant relationship between CSRD & ROA and CSRD & ROE. At the same time, the correlation value is found 0.979 and 0.957. It shows that there is positive relation of ROA and ROE with the CSRD.
UNIVARIATE ANALYSIS
| Between-Subjects Factors | ||
| N | ||
| ROA | 0.0451765452347594 | 1 |
| 0.0505811874749951 | 1 | |
| 0.0686186084441466 | 1 | |
| 0.0692945807965353 | 1 | |
| 0.134164251424109 | 1 | |
| ROE | 0.249164536450099 | 1 |
| 0.317573572590522 | 1 | |
| 0.402853155176659 | 1 | |
| 0.413204347511404 | 1 | |
| 0.62779071790107 | 1 | |
| Tests of Between-Subjects Effects | |||||
| Dependent Variable:CSRD | |||||
| Source | Type III Sum of Squares | df | Mean Square | F | Sig. |
| Corrected Model | .220a | 4 | .055 | . | . |
| Intercept | 22.050 | 1 | 22.050 | . | . |
| ROA | .000 | 0 | . | . | . |
| ROE | .000 | 0 | . | . | . |
| ROA * ROE | .000 | 0 | . | . | . |
| Error | .000 | 0 | . | ||
| Total | 22.270 | 5 | |||
| Corrected Total | .220 | 4 | |||
| a. R Squared = 1.000 (Adjusted R Squared = .) | |||||
OANDO PLC:
| Oando Plc | |||||
| Millions of NGN | 2012 | 2013 | 2014 | 2015 | 2016 |
| Revenue | 65,05,656 | 449873.47 | 92912.34 | 203431.53 | 455746.73 |
| Cost of sales | 58,06,645 | 390584.43 | 49610.78 | 156772.43 | 426933.81 |
| Gross profits | 6,99,01,096 | 59289.03 | 43301.56 | 46659.1 | 28812.92 |
| Net profit | 1,079 | 1414.46 | -142300.45 | -50434.84 | 3124.8 |
| CSRD | 1.18 | 1.36 | 0.91 | 0.91 | 1.55 |
| ROA | 0.01 | 0.00 | -0.19 | -0.05 | 0.003 |
| ROE | 0.02 | 0.01 | -4.57 | -1.37 | 0.03 |
The above graph shows the performance of the company in the context of the CSRD and profitability. In this, it is found that that trend of the CSRD and ROA looks similar because there is not much difference in the both performance. On the other hand, ROE is performing in the different way because in the year 2014, a decline is observed in the ROE.
In the context of OANDO PLC, it is analyzed that the net profit of the firm is showing positive relation with CSR spending. From the figures, it is analyzed that in the year 2012, the CSR spending of the firm was 22.41 Millions of NGN and the net profit was 1,079 Millions of NGN.
This CSR spending has increased by 28.28 Millions of NGN which has increased the net profit of the firm was 1,414.46 Millions of NGN. However, in the contrary, the CSR spending of the firm was decreased and it was only 11.38 Millions of NGN which has negatively impacted the firm and has created the loss for the firm.
In this context, it is analyzed that the net loss of the firm was -142300.45 Millions of NGN. Due to this reason, firm has increased the CSR spending in 2016 by 66.3 Millions of NGN, which has increased the net profit of the firm by 66.3 Millions of NGN. However, in the contrary,
it can be evaluated that the gross profits, cost of sales and revenue of the firm has decreased from the year 2012 to 2016. It reflects that there is no relationship between CSR spending and gross profits, cost of sales and revenue parameters. At the same time, from the R square value analysis, it is identified that there is a strong relationship between CSR spending and net profit as the value of R square is 0.58.
| ANOVA | |||||
| df | SS | MS | F | Significance F | |
| Regression | 5 | 5336125031 | 1067225006 | 1.529368514 | #NUM! |
| Residual | 3 | 10467310494 | 3489103498 | ||
| Total | 8 | 15803435525 | |||
| Coefficients | Standard Error | t Stat | P-value | Lower 95% | Upper 95% | Lower 95.0% | Upper 95.0% | |
| Intercept | 0 | 0 | ||||||
| Net profit | -82510.21014 | 45022.27697 | -1.832652982 | 0.164235001 | -225791.1891 | 60770.76884 | -225791.1891 | 60770.76884 |
| CSR spending | 1613.120947 | 1304.400205 | 1.236676398 | 0.304195055 | -2538.062666 | 5764.30456 | -2538.062666 | 5764.30456 |
In like manner, the p-value of the CSR spending is 0.16 and the net profit is 0.30. Both these values are higher than .05 which reflects that both these values are significant.
| Oando Plc | ||
| Independent variable CSRD | Dependent Variable ROA | Dependent variable ROE |
| Significance/ Prob | 0 | 0 |
| R-Square % | 26% | 30% |
| Observation | 1 | 1 |
On the basis of the above table, it can be determined that the independent variable is CSRD and dependent variables are ROA and ROE. In the context significance, the value is identified 0 for both. In the same concern of this, value of the R-Square found 0% and 30%. In the regression analysis, the observation value is also found 12 for both dependent variables.
| Paired Samples Statistics | |||||
| Mean | N | Std. Deviation | Std. Error Mean | ||
| Pair 1 | CSRD | 1.1818 | 5 | .28020 | .12531 |
| ROA | -.0469 | 5 | .08492 | .03798 | |
| Paired Samples Correlations | ||||
| N | Correlation | Sig. | ||
| Pair 1 | CSRD & ROA | 5 | .726 | .165 |
| Paired Samples Test | |||||||||
| Paired Differences | t | df | Sig. (2-tailed) | ||||||
| Mean | Std. Deviation | Std. Error Mean | 95% Confidence Interval of the Difference | ||||||
| Lower | Upper | ||||||||
| Pair 1 | CSRD – ROA | 1.22868 | .22627 | .10119 | .94774 | 1.50963 | 12.142 | 4 | .000 |
| Paired Samples Statistics | |||||
| Mean | N | Std. Deviation | Std. Error Mean | ||
| Pair 1 | CSRD | 1.1818 | 5 | .28020 | .12531 |
| ROE | -1.1770 | 5 | 1.98937 | .88967 | |
| Paired Samples Correlations | ||||
| N | Correlation | Sig. | ||
| Pair 1 | CSRD & ROE | 5 | .731 | .160 |
| Paired Samples Test | |||||||||
| Paired Differences | t | df | Sig. (2-tailed) | ||||||
| Mean | Std. Deviation | Std. Error Mean | 95% Confidence Interval of the Difference | ||||||
| Lower | Upper | ||||||||
| Pair 1 | CSRD – ROE | 2.35886 | 1.79467 | .80260 | .13048 | 4.58724 | 2.939 | 4 | .042 |
The above tables show that the significant value between CSRD – ROA and CSRD – ROE are zero and 0.042 that is low in the both presenting significant relationship between variables. At the same time, the correlation values are 0.726 and 0.731 in the given order that also present that there is strong positive relationship between CSRD and business performance.
UNIVARIATE ANALYSIS
| Between-Subjects Factors | ||
| N | ||
| ROA | -0.191747200966284 | 1 |
| -0.0548599840087017 | 1 | |
| 0.0032249903228617 | 1 | |
| 0.00345320227700808 | 1 | |
| 0.0056067784697655 | 1 | |
| ROE | -4.56982888405324 | 1 |
| -1.36858886602548 | 1 | |
| 0.0088964330930002 | 1 | |
| 0.0187735515340949 | 1 | |
| 0.0255370478427373 | 1 | |
| Tests of Between-Subjects Effects | |||||
| Dependent Variable:CSRD | |||||
| Source | Type III Sum of Squares | df | Mean Square | F | Sig. |
| Corrected Model | .314a | 4 | .079 | . | . |
| Intercept | 6.983 | 1 | 6.983 | . | . |
| ROA | .000 | 0 | . | . | . |
| ROE | .000 | 0 | . | . | . |
| ROA * ROE | .000 | 0 | . | . | . |
| Error | .000 | 0 | . | ||
| Total | 7.298 | 5 | |||
| Corrected Total | .314 | 4 | |||
| a. R Squared = 1.000 (Adjusted R Squared = .) | |||||
CONOIL PLC:
| Conoil Plc | |||||
| Millions of NGN | 2012 | 2013 | 2014 | 2015 | 2016 |
| Revenue | 149332.61 | 159537.13 | 128352.67 | 82919.22 | 85023.55 |
| Cost of sales | 133829.54 | 142498.61 | 114563.2 | 71381.46 | 70883 |
| Gross profits | 16163.71 | 17038.52 | 13789.47 | 11537.76 | 14140.55 |
| Net profit | 7149.81 | 3070.09 | 834.42 | 2307.56 | 2837.88 |
| CSRD | 1.25 | 0.83 | 0.67 | 0.75 | 0.79 |
| ROA | 0.10 | 0.04 | 0.01 | 0.03 | 0.04 |
| ROE | 0.46 | 0.17 | 0.05 | 0.13 | 0.15 |
The above graph shows that Conoil is spending on the social responsibly according to profitability. It has been seen that CSRD has increased and decreased when the ROA and ROE have increased and decreased. Hence, it is clear that the ability of the company to spend on the CSR depends on the financial performance of the company.
In the context of CONOIL PLC, it is analyzed that CSR spending not remained much helpful for the firm to increase the net profit. From the data analysis, it is identified that the CSR spending of the firm was 42.2 Millions of NGN and the net profit was 7149.81 Millions of NGN.
However, in the year 2013, it is analyzed that firm has decreased its CSR by 18.4, which has adversely impacted the organizational performance. At the same time, in 2013, the CSR spending of the firm was 5.34 Millions of NGN and the net profit of the organization was 17038.52 Millions of NGN.
It reflects that decrease in CSR spending has adversely impacted the firm performance, due to which the net profit of the firm was decreased from the year 2012 to 2013 and it continues in the year 2014. However the net profit of the firm was increased by 2307.56 Millions of NGN.
In like manner, in the year 2016, the CSR spending was 7011 Millions of NGN, which is a huge amount and has shown high increment from 2015 however this spending has not shown huge growth in the net profit.
The net profit of the firm has just increased from 2307.56 to 2837.88 Millions of NGN but the CSR spending has increased from 5.34 to 7011 Millions of NGN. From this, it can be interpreted that in the context of CONOIL PLC, it is identified that CSR spending does not remain much helpful for the firm to increase the profit margin of the firm.
At the same time, in the context of gross profit it is analyzed that increase in CSR is not assisting towards the increase in gross profit. Moreover, cost of sales and revenue has also shown decreased trend.
In the year 2012, the CSR spending of the firm was 42.2 Millions of NGN which was increased by 7011 Millions of NGN in 2016. At the same time, a gross profit of the firm was 16163.71 Millions of NGN in 2012 which was decreased by 14140.55 Millions of NGN by 2016.
Not only this, but also the cost of sales of the firm was 133829.54 Millions of NGN in 2012 which was decreased by 70883 Millions of NGN by 2016. However, in the context of revenue, it was 149332.61 Millions of NGN in 2012 and it has increased by 85023.55 Millions of NGN. The value of R square is also 0.0082, which is very low and reflects very weak relationship between net profit and CSR.
| ANOVA | ||||||
| df | SS | MS | F | Significance F | ||
| Regression | 5 | 182877.1283 | 36575.42567 | 0.024993951 | #NUM! | |
| Residual | 3 | 21950566.49 | 7316855.496 | |||
| Total | 8 | 22133443.62 | ||||
| Coefficients | Standard Error | t Stat | P-value | Lower 95% | Upper 95% | Lower 95.0% | Upper 95.0% | |
| Intercept | 0 | 0 | ||||||
| Net profit | 3336.79273 | 1355.945045 | 2.460861332 | 0.090798023 | -978.4295686 | 7652.015029 | -978.4295686 | 7652.015029 |
| CSR spending | -0.068368329 | 0.432451601 | -0.158094753 | 0.884424413 | -1.444622328 | 1.307885669 | -1.444622328 | 1.307885669 |
At the same time, from the analysis of p-value, it is evaluated that its value is 0.09 for net profit and 0.88 for CSR spending. It reflects that both the values are significant as they are higher than 0.05.
Above analysis has supported to understand that in the context of CONOIL PLC, although CSR is impacting the net profit however in the year 2016 its impact was low which clearly shows that there are many other factors also involved which were directly or indirectly affecting the company performance.
| Conoil Plc | ||
| Independent variable CSRD | Dependent Variable ROA | Dependent variable ROE |
| Significance/ Prob | 0 | 0 |
| R-Square % | 35% | 4% |
| Observation | 1 | 1 |
The above table shows that the value of the significant for ROA and ROE are 0.0 and 0.0 respectively. At the same time, the value of R-Square for ROA and ROE are 35% and 4%. In the same concern of this, the observation value for the both dependent variable are for 1 in the regression analysis.
| Paired Samples Statistics | |||||
| Mean | N | Std. Deviation | Std. Error Mean | ||
| Pair 1 | CSRD | .8583 | 5 | .22746 | .10172 |
| ROA | .0432 | 5 | .03325 | .01487 | |
| Paired Samples Correlations | ||||
| N | Correlation | Sig. | ||
| Pair 1 | CSRD & ROA | 5 | .989 | .001 |
| Paired Samples Test | |||||||||
| Paired Differences | t | df | Sig. (2-tailed) | ||||||
| Mean | Std. Deviation | Std. Error Mean | 95% Confidence Interval of the Difference | ||||||
| Lower | Upper | ||||||||
| Pair 1 | CSRD – ROA | .81518 | .19463 | .08704 | .57352 | 1.05684 | 9.366 | 4 | .001 |
| Paired Samples Statistics | |||||
| Mean | N | Std. Deviation | Std. Error Mean | ||
| Pair 1 | CSRD | .8583 | 5 | .22746 | .10172 |
| ROE | .1925 | 5 | .15441 | .06905 | |
| Paired Samples Correlations | ||||
| N | Correlation | Sig. | ||
| Pair 1 | CSRD & ROE | 5 | .998 | .000 |
| Paired Samples Test | |||||||||
| Paired Differences | t | df | Sig. (2-tailed) | ||||||
| Mean | Std. Deviation | Std. Error Mean | 95% Confidence Interval of the Difference | ||||||
| Lower | Upper | ||||||||
| Pair 1 | CSRD – ROE | .66582 | .07383 | .03302 | .57415 | .75750 | 20.165 | 4 | .000 |
The above conducted T test determines that the value of the T test is identified that 0.001 and 0.000 means null hypothesis can be rejected as it is lower than the significance value (<0.05). It indicates a significant relationship between dependent and independent variables. In this, the correlation value is identified 0.989 and 0.998 that mean that there is strong relationship between the CSRD – ROA and CSRD- ROE.
Univariate Analysis
| Between-Subjects Factors | ||
| N | ||
| ROA | 0.00982255781562098 | 1 |
| 0.029411768454656 | 1 | |
| 0.0371079593302645 | 1 | |
| 0.0407680373691207 | 1 | |
| 0.0986512089681989 | 1 | |
| ROE | 0.0518400477135695 | 1 |
| 0.130299582431047 | 1 | |
| 0.153684023550717 | 1 | |
| 0.170206620344473 | 1 | |
| 0.456527381675653 | 1 | |
| Tests of Between-Subjects Effects | |||||
| Dependent Variable:CSRD | |||||
| Source | Type III Sum of Squares | df | Mean Square | F | Sig. |
| Corrected Model | .207a | 4 | .052 | . | . |
| Intercept | 3.684 | 1 | 3.684 | . | . |
| ROA | .000 | 0 | . | . | . |
| ROE | .000 | 0 | . | . | . |
| ROA * ROE | .000 | 0 | . | . | . |
| Error | .000 | 0 | . | ||
| Total | 3.891 | 5 | |||
| Corrected Total | .207 | 4 | |||
| a. R Squared = 1.000 (Adjusted R Squared = .) | |||||
4.3 Discussion
From the overall findings, it can be interpreted that as in most of the case, increase in CSR is assisting the firm towards the improvement of financial performance as well as decrease in CSR spending is decreasing financial performance.
From this, it can be interpreted that CSR spending plays vital role in the success of the organization. CSR disclosure remains supportive for the firm to create positive image of the firm while allowing creating the positive image in the market.
In support of this, literature review finding has shown similarity with this view that due to increase in the level of awareness and literacy level, consumers give huge focus towards CSR practices and prefer to purchase the products of the firm which are involved in CSR practices. In this concern, CSR disclosure remains highly assistive.
From the analysis, it can be identified that CSRD although plays vital role in the financial performance of the firm however there are various other factors also involved which need to be considered to improve the net profit of the firm. Views of Moon (2002) have shown similarity with this finding that the concept of CSRD is disputed one.
In this context, views of (Aguinis & Glavas, 2012) have shown similarity with the above discussion that for the purpose of maximizing the shareholders’ wealth, in various cases firm’s activities go beyond societal development.
In the current scenario, due to increase in the level of competition, CSRD practices remain supportive to attract the consumers on the basis of ethical practices. It allows the firm to create positive goodwill of the firm in the global market.
At the same time, from the annual report findings, it is analyzed that CSR spending remains supportive towards revenue, cost of sales and gross profits too. From this, it can be interpreted that CSR increases the company sales.
In support of this, views of (Russell & Russell, 2009) have shown consensus with this interpretation that giving concern towards CSR allows the firm to offer the potential benefits of creating positive company image while increasing the interest of the stakeholders.
Moreover, it allows increasing the level of customer satisfaction which remains supportive to increase the market share of the company. Disclosure of CSR helps the firms to fulfill social and environmental responsibilities along with the fulfillment of shareholders’ interests in terms of profitability.
They disclose their CSR activities to develop goodwill among people that helps them to draw the attention of the customers and make business growth effectively.
Above discussion has supported to analyze that in most of the cases, increase in CSR activities remains supportive to increase the net profit of the firm. In support of this, the findings of Luo & Bhattacharya (2006) have shown consensus that in the current scenario; customers prefer to buy the products from the companies which show more involvement in the CSR activities and gives concern towards fulfilling their social responsibility towards its stakeholders as well as society.
Consumers who give concern towards ethical practices are more likely to be patronized by the consumers. From the above findings it can be interpreted that nowadays due to increase in global warming and other climatic issues, consumers give huge consideration towards eco-friendly practices.
In like manner, increased level of literacy level and liberalization has increased the concern of the consumers towards ethical practices. Moreover, it is also analyzed that CSR practices decrease the chances of legal hindrance and supports to create positive image and word of mouth in the market.
Therefore, if the firms disclose their CSR efforts and spending or make CSR disclosure, it helps them to make the customers aware about their efforts towards the environment protection and community welfare. It is effective to develop strong brand image among the customers and pursued their buying behavior positively and improve the organizational performance.
On the other hand, above data has supported to discuss that there are various other factors also involved which directly impacts the financial performance of the firm.
In this context, from the literature review finding, it is identified that employee satisfaction is necessary for the firm to create long-term sustainability in the industry as human resource is the major resource of the firm and no firm can run without employee satisfaction.
At the same time, there is a need of giving concern towards effective management as it allows the firm to lead the overall organizational process in the right direction. Moreover, firm also needs to give concern towards market competition and to design the strategies which remain competitive to sustain in the industry.
4.4 Hypothesis Testing
H0: There is no relationship between CSRD and ROA & ROE
H1: There is relationship between CSRD and ROA & ROE
If significance value is less than 0.05 means null hypothesis is rejected.
If significance value is greater than 0.05 means null hypothesis is accepted.
The following table presents hypothesis testing for the relationship between the dependent and independent variables:
| Company | Null hypothesis (ROE &CSRD) (significance value=0.05) | Null hypothesis (ROA & CSRD) | Relationship between CSRD & performance in terms of ROA and ROE |
| JAPAUL OIL
|
Rejected | Rejected | There is a significant relationship between CSRD and performance. |
| Mrs (CHEVRON) | Rejected | Rejected | There is a significant relationship between CSRD and performance. |
| FORTE OIL PLC | Rejected | Rejected | There is a significant relationship between CSRD and performance. |
| MOBIL OIL NIG PLC | Rejected | Rejected | There is a significant relationship between CSRD and performance. |
| ETERNA PLC | Rejected | Rejected | There is a significant relationship between CSRD and performance. |
| Total Nigeria Plc | Rejected | Rejected | There is a significant relationship between CSRD and performance. |
| OANDO PLC | Rejected | Rejected | There is a significant relationship between CSRD and performance. |
| CONOIL PLC | Rejected | Rejected | There is a significant relationship between CSRD and performance. |
The above table indicates that there is a sportive relationship between CSRD and ROA and CSRD and ROE.
Conclusion
From the above analysis, it is found that there is a significant relationship between corporate Social Responsibility Disclosure and firm’s financial performance.
The findings of analysis of research shows that data findings have also supported to analyze that CSR practices allow the firm to give consideration towards planet, people and profit which allows the firm to fulfill their responsibility towards the society.
Findings of literature review have shown similarity with this finding that in the context of Nigeria, CSRD will remain assistive for the firm to stabilize the international oil market and will remain supportive towards the upliftment of the society.
Chapter 5: Conclusion
This chapter provides the conclusive statements of the key findings obtained during the research study. With the help of this chapter, researcher provides the main outcomes of the study that are based on data findings and analysis. Apart from this, it also provides research implications to provide better opportunities to conduct future researches.
5.1 Conclusion
With the help of this research, researcher became able to present the conceptual and theoretical aspects related to CSR and its impact on the business performance.
The views and opinions of various authors are reviewed in literature review to develop theoretical understanding of the topic. Apart from this, researcher has been successful to accomplish the objective related to the investigation of CSR disclosure made by the listed oil and gas companies in Nigeria.
It can be summarized from the study that these firms adopt CSR practices and disclose in their annual reports.
From the data analysis, it can be summarized that CSR has become mandatory for the firms to enhance their contribution to the society and environment welfare and get good financial results due to brand development.
It is evident from the statistical analysis and literature review that the firms which provide their CSRD report to the stakeholders with good quantitative measures, it positively affects their financial measures.
There is a positive relationship between the CSR disclosure and financial performance of the oil firms in Nigeria. From the analysis, it can also be concluded that if the firms spend more on CSR activities, it leads to better financial results due to positive influence on the customers.
From this, it is identified that the increasing awareness of the customers towards the CSR aspects has raised the need for the firms to disclose their CSR efforts while running their business operations.
But at the same time, the consideration of these aspects has influenced the business performance in positive way. The firms which are disclosing high figures for their CSR efforts are becoming more successful than the firms which do not follow this.
It is because social and environmental concerns have become the major considerations for the public nowadays. If the firms contribute more towards social welfare and environmental protection, it helps to develop positive image among the customers that lead to improved business performance.
However, data analysis also reflects the contradictory outcomes in relation to Eterna and Oando as there was no significant impact of CSR disclosures on the financial performance of the firms.
These findings are not consistent with the outcomes related to positive impact of CSR on financial performance. It is because there are other factors like employee satisfaction, market competition and strategy designing that can have a significant influence on the financial performance of the firms.
These other factors may play a considerable role in changing the financial performance. The consideration of these factors along with CSR can be effective for the firms to enhance the brand image and improve financial performance.
In relation to this, quantitative analysis of CSR efforts and financial performance of the firms indicates that the adoption of CSR disclosures is also significant for shareholder’s wealth maximization.
The firms disclose their CSR efforts and related expenses to develop strong brand image among the customers and attract more customers that positively influences the business performance in terms of sales and net profit.
From the study, it can be identified that the researcher has been successful to accomplish the objectives related to impact of CSRD on the financial performance of the firms in Nigerian oil and gas sector at moderate extent.
It is because it is found that most of the Nigerian oil and gas firms achieved better financial performance when they disclosed the higher CSR spending in their reports as it helped them to influence the consumer buying behavior positively due to concerns of the firms towards the environment and community.
At the same time, it can also be concluded from the research that the increasing concerns related to global warming and other climatic issues have raised the need for the firms to adopt eco-friendly practices in their operations and disclose these practices in their annual reports and websites.
The disclosure of this information has a positive impact on the mindset of the stakeholders including investors and customers that has a positive influence on the business performance.
From this study, it can also be summarized that different CSR theories such as 3Ps theory or triple bottom theory and ethical theories also support this aspect that it is crucial for the companies to perform their CSR framework effectively achieve the business objectives. Based on hypothesis testing, it is summarized that there is a positive relationship between CSRD and financial performance of oil and gas companies of Nigeria.
5.2 Future research implications
This study can be beneficial in managerial perspective to frame better CSRD policy to improve the financial performance of the firms. However, this study is based on secondary data as it does not consider primary research that reduces the validity and reliability of the research outcomes.
At the same time, this study focuses on only Nigeria country as there may be differences in the findings in different countries. Therefore, the future researchers can focus on primary study by conducting survey or interview to determine the applications of different CSR activities in improving financial performance.
Apart from this, the future studies can be focused on other countries and make a comparative study by making comparison in the findings between the countries. Overall, it can be suggested that the future studies can be improved by considering different countries to enhance validity and reliability of the research.
Apart from this, the study is bases on oil and gas industry as the focus on other industries can be helpful to make generalized findings for the research topic.
References
Choy, L. T. (2014) The strengths and weaknesses of research methodology: Comparison and complimentary between qualitative and quantitative approaches. IOSR Journal of Humanities and Social Science, 19(4), pp. 99-104.
Collis, J. and Hussey, R. (2013) Business research: A practical guide for undergraduate and postgraduate students. UK: Palgrave Macmillan.
Cortina, J. M., Aguinis, H. and DeShon, R. P. (2017) Twilight of dawn or of evening? A century of research methods in the Journal of Applied Psychology. Journal of Applied Psychology, 102(3), pp. 274.
Creswell, J. W. (2013) Research design: Qualitative, quantitative, and mixed methods approaches. London:Sage publications.
Crowther, D. and Lancaster, G. (2012) Research Methods. UK: Routledge.
Davis, M. J. (2010) Contrast coding in multiple regression analysis: Strengths, weaknesses, and utility of popular coding structures. Journal of Data Science, 8(1), pp. 61-73.
Goodwin, J. (2012) SAGE Secondary Data Analysis. UK: SAGE.
Kothari, S. P., Li, X. and Short, J. E. (2009) The effect of disclosures by management, analysts, and business press on cost of capital, return volatility, and analyst forecasts: A study using content analysis. The Accounting Review, 84(5), pp. 1639-1670.
Moon, K. and Blackman, D. (2014) A guide to understanding social science research for natural scientists. Conservation Biology, 28(5), pp. 1167-1177.
O’Leary, Z. (2013) The essential guide to doing your research project. USA: Sage.
Wu, Y. C. J., Huang, S., Kuo, L. and Wu, W. H. (2010) Management education for sustainability: A web-based content analysis. Academy of Management Learning & Education, 9(3), pp. 520-531.
