Customer satisfaction and sales drop in the Indian automobile industry
The introductory chapter of the study mainly focused towards evaluating the automobile industry within India which is expected to grow at the rate of 10.1% and is also expected to contribute towards 7.5% towards the GDP of India. During the introductory phase of the study the research aim along with the objectives of the study has been briefly examined in the study. The structured aim and objectives of the study helps the researcher in performing the study successfully. The literature review section examined about the conceptual framework along with identifying satisfaction among the customers within the automotive industry. Based on the aim of the research study, a pragmatic research method was used, whereby; both qualitative and quantitative method was used. A deductive approach was taken in the research due to the presence of hypothesis as it led validation through quantities data as consult in depth theoretical sources.Based on the quantitative method, a statistical survey was conducted with 256 automotive customers of India whereas the interview with 1 of the managers of Tata Motors, Maruti Suzuki, Hyundai Motors and Mahindra & Mahindra was done via telephone spanning 20 minutes each. It was found that there is customer satisfactionhas inflected the drop in vehicle sales and these factors in turn directly impact the performance of automobile industry of India. In addition, various economic factors were also found to impact the customer satisfaction in choice of purchase of vehicles and therefore low automobile sales in India. On the other hand, the qualitative interviews from the managers of the major automobile companies implicated various factors like cost and fuel economy, customer services and feedback are customer satisfaction factors that impact the choice of vehicle brand. On triangulation, the findings from the qualitative and quantitative were found to have similar implications. Finally, the conclusion section examined the objectives along with recommendations to grow in near future for the automobile industry in India.

Customer satisfaction remains the topmost priority of businesses operating across all the sectors of the world as it lays the foundation of meeting the expectations of the customers(Pirbazari & Jalilian, 2019). Customer satisfaction ensures that the satisfied customers continue to purchase and speak highly of the business and its products in addition to enabling the businesses to improve their product offerings. The automobile sector in India is considered as one of the most developed in the world which equally prioritizes customer satisfaction as a metric for performance and quality of vehicles. Evaluating the annual sales of automobiles in India it has been noticed that alone passengers and commercial vehicles have sold more than 30,915,420 vehicles during the year 2018(Siamindia, 2019). Furthermore, it has also been noticed that the Indian automotive industry is expected to grow by 10.1% and is estimated to contribute towards the development of the economy by contributing 7.5% of total income towards the GDP of the country(Moneycontrol, 2019).It has also been predicted that the Indian automotive industry is also expected to generate 2 million employment opportunities by the end of 2025(Ibef, 2019).However, the automobile industry in India had suffered its worst drop in sales in 21 years as passenger vehicles, two-wheelers as well as commercial vehicles performed poorly over the 10th straight month in 2019(Economictimes, 2019).
This dissertation is based on evaluating the present scenario of customer satisfaction in the Indian Automobile industry as well as the factors which have led to the drop in sales. Evaluating the import regulations of Indian automobile industry it has been identified that the country has put high taxation of 125% on import of foreign cars, whereas, the import tax on the components of automobile such as airbags, gears, and axles is around 10%, which encourages both local and international business ventures to assemble the cars in India rather than importing it from other nations(Ibef, 2019). This research study will also discuss the research aim along with the objectives because it will help the observer in laying down a structured process through which the overall study can be performed. Based on the objectives of the study the literature review section will be performed that will help in completing the study in a significant manner.
Growth of India automotive industry adds a contribution towards the growth of the nation, further it also provides employment opportunities that help in building the human resources of the nation. The changing business environment of the automobile industry has seen trends among the customers that includes inclination of the customers towards the price and comfort. The automobile sector of India provides employment to more than 37 million people indirectly and directly as well as contributes to 49% of the GDP in the manufacturing segment(Economictimes, 2019). The growth-related to Indian automobile sector by 18.3% has influenced the revenue of the industry to surge high up to the US $ 51.2 billion during the financial year of 2017-2018(Ibef, 2019).However, the Society of Indian Automobile Manufacturers abbreviated as (SIAM) had released reports having concerning statistics as the month of August in 2019 witnessed sequential drop in automobile sales in the country in 10 months. The overall sales were reduced to 1,821490 vehicles which are a drop by 23.55%(Economictimes, 2019). Some of the factors that have been identified which have influenced the growth in the automobile sectorin the first place include the growing purchasing capability of people along with changing lifestyle is also contributing towards the growth of automobile industry in India.
The inclination of the automobile industry in India is mainly due to the advance in purchasing power of people due to an increase in average income by ₹ 1, 13,500 annually(Livmint, 2019).Furthermore, the development of Indian infrastructure is also adding to the benefit of the automobile industry that has opened up the door of opportunities for both the foreign and local car manufacturers.

Figure 1: Decline in sales of Automobiles in India. Source: (Economictimes, 2019).
Sales across all segments of automobiles in the county have dropped with the passenger vehicle segment suffering worst as only 196,524 units were sold signifying a 31.57% drop. The sales of commercial vehicles and two-wheelers had dropped to 51,897 units and 1,514,196 units signifying a 39% and 22.24% drop. Even the affordable commercial 3 wheelers suffered 6.93% decline in sales as the figures hit 58,818(Businesstoday, 2019). The lack of satisfaction of the customers in terms of value has been identified as a crucial factor which has led to declining in sales in the segment in addition to the easy availability of public transport and cabs for hire like Ola and Uber. Reasons that contribute towards the satisfaction of customers in the Indian automotive industry is after-sales services and value provided to them via maintaining quality in the cars. The research will explore the reasons forthe decline of automotive sales despite the high promise of the Indian automotive sector and identify the present state and role of customer satisfaction in the scenario of the decline of sales.
In this dynamic business environment,a corporate business establishment is keen to promote their brands in term of creating the brand values in respect of sustaining the product in the business market(Fernández-Jalvo & Andrews, 2016). Therefore it becomes essential to understand the determinants along with the measurement of the brand equity with its implication on the firm. Customer satisfaction plays a major role in enhancing brand image and equity of businesses in the automobile industry without which the sales and revenue suffer decline. This research his based on the evaluation of the present state of customer satisfaction as well as the drop in sales in the Indian automotive industry. The research is rational as there has been a substantial gap in research regarding the evaluation of how customer satisfaction is associated with the drop in sales in the Indian automotive sector. This is because most of the research works are aimed towards assessing the factors of decline in sales in the segment but this research has associated the phenomenon with customer satisfaction to present a broader insight. Moreover, the rationale of the research will also identify and discuss the factors that determine the perception of the customers towards purchasing cars. It has also been noticed that people also take countable measures before making up their mind to buy a particular brand of automobile.
The research aim is to evaluate the present state of customer satisfaction as well as the drop in sales in the Indian automotive industry.
- To evaluate the importance of customer satisfaction in the automotive industry
- To critically analyse the factors that influence the purchase of automobiles in India
- To determine the factors highlighting the drop in vehicle sales in the automobile sector of India.
- What is the importance of customer satisfaction in the automotive industry?
- What are the factors that influence the purchase of automobiles in India?
- What are the factors due to which the automobile sector of India witnessed a decline in the sales of vehicles?
A definite structure would be followed for conducting this research in a structured manner for reaching substantial findings and conclusions comprehensively.
Chapter 1: In this portion, the context of the research is introduced and the aims and objectives are stated.
Chapter 2: In this segment, the literature review of the study topic is provided using peer-reviewed journals for assessing knowledge and information which is relevant to customer satisfaction and declining automotive sales along with identifying the research gap and conceptual framework.
Chapter 3: This part of the research presents the methodologies that have been collected for collecting data and presenting the findings.
Chapter 4: This chapter of the research delivers the results of the data collection and analysis to conduct a thorough discussion.
Chapter 5: This chapter of the study concludes the topic based on the findings and recommends the managers of the automotive industry for sales and customer satisfaction improvement.
Customer satisfaction is achieved by undertaking strategies which enable the firms to retain the customers and create a loyal customer base who keeps on purchasing from the company throughout their lifetime(Pirbazari & Jalilian, 2019). The automotive sector of India had achieved a growth in sales performance until the year 2018 and had been projected to gain further momentum till the year 2019 resulted in a slump in sales for 10 successive months. This portion of the study will present the literature review of the topic of customer satisfaction and the drop in sales in the Indian automotive industry based on the objectives. The sales of automobiles in India has suffered the most in the last 21 years in 2019 due to a lack of demand as a result of the number of factors such as the economic slowdown in addition to the lower rates of freights and poor availability of freights(Economictimes, 2019).
Additionally, the rising unemployment in the county and the lack of availability of finance have reduced the demand of the customers of the automobile sector. The increasing costs of fuel, as well as registration and insurance, has weakened the sentiment of the consumers as they find it easier and more convenient to hire cabs such as Ola and Uber. The literature reviews will assess the importance of customer satisfaction in the automotive industry as well as identify the factors that influence the purchase of automobiles in India. The chapter will also determine the factors highlighting the drop in vehicle sales in the automobile sector of India. A conceptual framework and research gap have also been presented in this segment of the study.
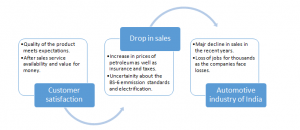
Figure 2: Conceptual framework. Source: Author.
Conceptual framework of the study has been provided to display the relationship amongst the variables being customer satisfaction, sales drop and the Indian automobile industry. Customer satisfaction is the independent variable of the research whereas sales drop and the Indian automotive industry are the dependent variables. Customer satisfaction affects the drop in sales of automobiles in the automotive industry of India as it impacts the purchasing decision of the customers.Satisfied customers become loyal to the brands and keep on purchasing from the same company in addition to having a good experience which compels them to purchase automobiles(Srinivas, 2013). However, factors like rising costs of maintenance and economic slowdown hamper satisfaction of the customers in addition to rising insurance and fuel costs which lessens demand and drops sales in the Indian automotive segment.
2.2 Importance of customer satisfaction in the automotive industry
Customer satisfaction is measured by conducting surveys which is essential for gaining vital feedback regarding the opinions of the customers about the product and service quality based on which the management formulates strategies to gain loyal customers. As stated by Hill &Brierley, (2017), customer satisfaction is known as the determinants that are used to measure how a product and services perform to surpass customer expectations. Srinivas (2013) argued that the satisfied customers enable the businesses to earn streamlined revenue as well as enables them to be profitable as such a scenario enables the firms to do repeat business with the same clients. He added that the businesses are able to reduce their expenses and improve profits by reducing the cost of acquiring new customers through marketing and campaigns by developing a loyal base of customers by providing satisfactory products, services and experience. The satisfaction of the consumer isused to measure how particular products or services are performing within the business environment.
Assessment of the feedback of the customers of the automobile industry by conducting surveys and undertaking market research to monitor trends enables the companies in the segment to assess if they are able to meet the requirements and demands of the clients. As per, Shahin&MohammadiShahiverdi (2015), customer satisfaction is highly regarded as essential in the automotive segment as the customers who have a good experience with the vehicles, the process of hand over of the vehicle and after-sales service quality is obvious to tell their friends and acquaintances about the experience. Satisfied customers in the automotive industry become net promoters of the vehicles that they own which increases the reach of the companies to a broader segment of customers without any marketing expenses and increase their sales and revenues. According to Goyal, et al. (2017), automotive sales are valuable as the purchase of vehicles are a major investment and hence the customer satisfaction surveys and feedback of the customers are essential for bolstering profitability and revenue generation of the companies. The automotive companies take extra care to ensure that the customers are satisfied as dissatisfied customers might end up posting negative reviews about their experiences online as well as discourage their friends from purchasing. This could in turn negatively affect the brand image and equity of the automotive seller.
According to Pirbazari&Jalilian (2019), the factors of customer satisfaction are driven by the preconceived ideas of customers when their experiences exceed their total satisfaction goals. Evaluating the customer satisfaction among Indian customers it has been noticed that there are two types of factors that includes psychological and physical variables which rightfully relates to the satisfaction behaviour among the customers that includes return and recommend rate.Nataraj&Nagaraja (2016) mentioned that the satisfaction of the customers in the Indian context also depends upon the product comparison factor where the people compares one product with another in terms of determining values out of it. Customer satisfaction rate plays an important part in the automotive industry as it helps them in maintaining quality in the vehicles that generate the loyalty and trust of the consumers towards the automotive brands(Júnior, et al., 2019). Furthermore, service quality also increases the satisfaction rate of the customers as because after-sales services that are offered by the car manufacturing company helps the customers in building their faith towards the firm(Hill & Alexander, 2017). Moreover, after-sales services also ensure that the company is customer-oriented and looks to add values through their quality of services. Better after-sales services not only increase the satisfaction rate of the customers but it also opens up the door of opportunities for the automobile industry to increase customer traffic.
The automotive industry is a red ocean to operate in for the companies and dealerships as there is high competition with the customers having multiple choices. According to Famiyeh, et al. (2018) the creation of a satisfactory journey of the customers during the process of buying the vehicles ensures their satisfaction in three phases including awareness, consideration and decision. In the first phase, the customers realise their problem regarding their need for requirement of the vehicle and what type of vehicle they want to purchase. Cicerone (2009)said that, in the stage of consideration, the customers assess their needs properly and decide what kind of vehicle they want or what type of dealer they want to visit. In the third stage of taking a decision, the customers identify the company or dealer from whom they would like to purchase based on the brand image and equity. As per, Trang&Tho (2019) creating the best experience for the customers in all the phases benefits the automotive companies to win the appreciation of the customers through guiding the customers to accomplish their experiences and using an Omnichannel marketing instead of pushing products. Regular follow up of the customers in addition to specifying the appropriate products as per their needs and requirements benefits the automobile companies to acquire satisfaction of the customers.
Based on these aspects, the following hypothesis was formed;
There is no relationship between customer’s perception to upgrade car or repurchase and customer’s satisfaction level from recent visit of the vehicle store
2.3 Factors that influence the purchase of automobiles in India
As opined by Xu, et al. (2017),factors that have pushed the capability of Indian customers towards purchasing automobiles include the brand status and fuel efficiency. Indian customers while purchasing cars consider the brand of the cars that indicate their supremacy and then they look for the features of fuel efficiency. The marketing theory that influences the purchase of automobile among the customers includes marketing mix that helps in determining the product categories along with determining the distribution system of the automobile industry within India. Furthermore, the marketing theory of marketing mix also helps in determining pricing strategy of the automobile industry in India along with identifying a promotional strategy to increase the reputation of the firm among the customers(Baker & Saren, 2016). The reason for opting for factors like fuel efficiency is mainly because it takes 2 hours of driving time, which consumes fuels, therefore this is a factor that Indian customers prefer a lot while purchasing an automotive. Besides other factors that have also been noticed for the growth of the automobile industry in India are mainly because of space and safety features(Kim, et al., 2015). The minimum family size in India is 4 people, therefore customers opt for vehicles that have more space and safety features so that it can be used during the time of any occasion and events. Safety features such as airbags and ABS technology are some of the special features that customers in India always wants when they make up their mind to purchase any vehicles. Therefore, based on all these features Indian customers decide to purchase automobiles.
The process of consumer decision making in the Indian automotive sector is reliant on the factors related to brand, price, style, performance and fuel economy, safety features, space and ground clearance(Economictimes, 2019). The charge of subsequent services and aftersales of the vehicle also play an important factor in addition to the resale value on the purchase decisions of the consumers. According to David &Banumathi (2014), the dealership experience is also a crucial factor which shapes the perceptions of the customers as there are many operators in the automotive market of India and the customers are provided with plenty of choices. Price of the vehicle is the main deciding factor for the Indian customers as automobiles for personal use are still considered a luxury and status symbol in the country. According to Ažman&Gomišček (2015), the customers opt for the dealers providing cash discounts and lower premium of insurance followed by assessing the market reputation and reliability of the brand. Maruti Suzuki being an Indian manufacturer of automobiles enjoy the highest market share in the country due to its reputation of being reliable and easy to service(Economictimes, 2012). Styling of the vehicles is also essential for moulting the perceptions of the customers to purchase products as entry-level hatchback vehicles are being provided with a facelift to imitate SUV’s and look stylish like the Renault Kwid. This results in high customer demand and a competitive edge for the vehicles. Good ground clearance also influenced the Indian consumers to purchase automobiles as there are a lot of potholes and speed breakers.
The customer decision-making model consisting of 5 stages can be used as a reference while deciphering the purchase decision of the consumers(David & Banumathi, 2014)(Fang, et al., 2014). In the initial phase, the customers analyse their requirement of purchasing a vehicle as they seek to be independent and have a comfortable and personalised experience in comparison to public transport and rental vehicles. In the second phase, the prospective customers of the automotive sector search for information based on their requirements. This is done by looking up in magazines, online searches on search engines like Google and Bing as well as asking friends and relatives and visiting a dealer. According to David &Banumathi (2014), in the third phase, the potential customers of the company embark on the journey of seeking and evaluating alternatives to their choice of vehicle by comparing with other cars in the similar price range by contrasting the specifications, space, fuel economy and performance. As per, Trang&Tho (2019), in the fourth phase, the customers make the decision to purchase an automobile in India by assessing the factors which influence their purchase behaviour as they opt for the vehicle which provides the best performance in the price range as well as the most value in terms of features and safety against the money paid by them. Lastly, the customers evaluate their purchase decision one or two weeks after the purchase to assess if they have received value worth their investment and whether their expectations have been met thereby shaping their satisfaction levels.
Based on these aspects, the following hypothesis was formed;
There is no impact of factors perceived during purchase of vehicles on recommendation of the vehicle brand to others
2.4 Factors highlighting the drop in vehicle sales in the India automobile sector
A LiveMint report detailed that the overall automobile sales in India had fallen by 23.55% wherein the passenger vehicle segment has been the hit hardest with 31.57% reduction in sales(Livemint, 2019). An article published in BBC states that the automobile industry of India is witnessing its worst sales performance in the last two decades wherein the sales of all vehicle segments have reduced dramatically thereby also inhibiting economic growth(BBC, 2019). The report elaborated that the Maruti Suzuki is the largest manufacturer of vehicles in the country has registered a decline of 36% in sales and has been forced to temporarily shut down production along with other firms. This is because all kinds of vehiclesincluding passenger vehicles, commercial automobiles and even two-wheelers are low in demand. The major factors which have been held responsible for the drop in sales of personal cars and other vehicles in the auto, motive segment are the banking crisis, reformation of tax to introduce GST and the banning of cash in the form of demonetisation.
An article published by Economic times depicts the decline in sales of the major market leaders in the automotive sector of India like Tata Motors and Hero MotoCorp in addition to Maruti Suzuki(Economictimes, 2019). The low economic growth in the country in addition to the structural changes in the industry itself like altering freight rates and the norms of axle loading have furtherer added to the misery of sales. The decline in sales in the Indian automotive sector has resulted in the job losses of more than 350,000 people employed across the sector and the numbers are expected to grow if there is no turnaround. NitinGadkari, being the minister of road transport of the country had said that he would request the finance minister of the country to rethink and reduce the rates of GST for vehicles to revise the sales(Economictimes, 2019). As per an article published in Telegraphindia (2019), Maruti Suzuki is the most successful automotive manufacturer in the country had taken the decision to shut down their manufacturing facilities based in Manesar and Gurgaon for two days in the month of September amid a steep decline in demand. Despite the initiative of “Make in India” by the government of the country to support the manufacturing industry, however, the crunch of liquidity in the country in addition to the lack of availability of finances for the manufacturers as well as the purchasers has stagnated the industry.
The perceptual map presented above represents the biggest automotive manufacturers of India wherein Maruti Suzuki is placed in the segment of offering high quality products at lower costs whereas Hyundai Motors is placed at the segment of high cost but comparatively poor quality. Tata Motors and Mahindra & Mahindra have is placed in the marketing perspective of being highly costly but provide high quality products as well.
The economic slowdown in India resulting in the growth rate being lesser than 5% has resulted in lesser consumption as the consumers have tightened their purses thereby leading to the loss of sales in the automotive sector.The increase of excise duty on petrol and diesel by the government of India during the Union Budget of 2019 has also resulted in lack of interest of the customers regarding purchasing vehicles thereby declining sales(Moneycontrol, 2019). The cost of acquiring and maintaining a vehicle in India has surged in the time of economic slowdown which can only be revitalised by government backing and policies to provide relaxations to the manufacturers as well as aiding the purchasers. The dimension of increasing cost of insurance of the vehicles in addition to the road tax and stringent traffic violation laws resulting in very high fines have discouraged the consumers to procure personal vehicles. The alteration of the tax structure by the government to introduce GST has affected the sales of commercial vehicles in the country. Due to the slowdown in the economy and increase in bad loans, the financial institutions of India have become more stick while providing finances for automobiles as the individuals with high CIBIL score are only offered credit. This has affected the potential consumers with low CIBIL scores form getting finances for purchasing cars. The same has also been made applicable for the dealers and manufacturers they are also unable to receive financial help thereby resulting in low stocks and further fall in demand. This also affects the producers as lesser units are in demand.
The initiative of the Indian government to enforce norms of fuel emissions at par with the European nations by vowing to implement BS-VI by 2020 has affected the mind-set of the customers as they refrain from buying the BS-IV vehicles available in the market. The announcement of rolling out BS-VI vehicles have largely affected the sales of BS-IV cars as the consumers have become uncertain due to the standard being made applicable to the engine of the vehicle and the fuel. Implementation of BS-VI is also expected to further increase the price of vehicles in addition to overhauling the technology of diesel engine. This particular aspect of the emission norm has widely affected the decision of the buyers to purchase diesel cars as even the largest automaker in the country have made the announcement to refrain from selling diesel-powered cars from the subsequent year.
The consumers of the auto industry of India have postponed their plans for purchasing vehicles as the implementation of BS-VI standard would also mean that the BS-IV engine vehicles would have to use the same fuel for running which might cause more damage in the long term(Moneycontrol, 2019). This would mean that the customers will have to bear the price for upgrading the engines of the vehicles in the near future and hence is deemed to be a major factor showcasing the steep decline in sales of vehicles in India. In this case, upgrading a petrol engine
per an article published in Telegraphindia (2019), Maruti Suzuki is the most successful automotive manufacturer in the country had taken the decision to shut down their manufacturing facilities based in Manesar and Gurgaon for two days in the month of September amid a steep decline in demand. Despite the initiative of “Make in India” by the government of the country to support the manufacturing industry, however, the crunch of liquidity in the country in addition to the lack of availability of finances for the manufacturers as well as the purchasers has stagnated the industry.
The perceptual map presented above represents the biggest automotive manufacturers of India wherein Maruti Suzuki is placed in the segment of offering high quality products at lower costs whereas Hyundai Motors is placed at the segment of high cost but comparatively poor quality. Tata Motors and Mahindra & Mahindra have is placed in the marketing perspective of being highly costly but provide high quality products as well.
The economic slowdown in India resulting in the growth rate being lesser than 5% has resulted in lesser consumption as the consumers have tightened their purses thereby leading to the loss of sales in the automotive sector.The increase of excise duty on petrol and diesel by the government of India during the Union Budget of 2019 has also resulted in lack of interest of the customers regarding purchasing vehicles thereby declining sales(Moneycontrol, 2019). The cost of acquiring and maintaining a vehicle in India has surged in the time of economic slowdown which can only be revitalised by government backing and policies to provide relaxations to the manufacturers as well as aiding the purchasers. The dimension of increasing cost of insurance of the vehicles in addition to the road tax and stringent traffic violation laws resulting in very high fines have discouraged the consumers to procure personal vehicles. The alteration of the tax structure by the government to introduce GST has affected the sales of commercial vehicles in the country. Due to the slowdown in the economy and increase in bad loans, the financial institutions of India have become more stick while providing finances for automobiles as the individuals with high CIBIL score are only offered credit. This has affected the potential consumers with low CIBIL scores form getting finances for purchasing cars. The same has also been made applicable for the dealers and manufacturers they are also unable to receive financial help thereby resulting in low stocks and further fall in demand. This also affects the producers as lesser units are in demand.
The initiative of the Indian government to enforce norms of fuel emissions at par with the European nations by vowing to implement BS-VI by 2020 has affected the mind-set of the customers as they refrain from buying the BS-IV vehicles available in the market. The announcement of rolling out BS-VI vehicles have largely affected the sales of BS-IV cars as the consumers have become uncertain due to the standard being made applicable to the engine of the vehicle and the fuel. Implementation of BS-VI is also expected to further increase the price of vehicles in addition to overhauling the technology of diesel engine. This particular aspect of the emission norm has widely affected the decision of the buyers to purchase diesel cars as even the largest automaker in the country have made the announcement to refrain from selling diesel-powered cars from the subsequent year.
The consumers of the auto industry of India have postponed their plans for purchasing vehicles as the implementation of BS-VI standard would also mean that the BS-IV engine vehicles would have to use the same fuel for running which might cause more damage in the long term(Moneycontrol, 2019). This would mean that the customers will have to bear the price for upgrading the engines of the vehicles in the near future and hence is deemed to be a major factor showcasing the steep decline in sales of vehicles in India. In this case, upgrading a petrol engine is comparatively cost-effective as the customers would be possible by investing an additional ₹30,000, whereas, in case of diesel cars, the price is set to increase by more than ₹ 1 lakh. In addition, the ban on diesel vehicles ageing more than 10 years adds to the woes of the decrease in sales. The lack of clarity of the manufacturers regarding the electric vehicle policy of the government has also restricted investment.According to Kozlovskiy & Aydarov (2017), the policy of electrification of the cars and two-wheelers have also restricted consumer spending as many expect to purchase an affordable electric vehicle for the long term to match with the environmental and sustainability standards.
The government policy of adding safety features to the vehicles on a mandatory basis like ABS and airbags have resulted in a hike in the prices by 15% thereby reducing customer demand. The increase in the availability of commercial vehicles for hire like Ola and Uber provides more convenience and gas gained appreciation of the customers in comparison to personal vehicles. This is because of the heavy traffic congestion and lack of adequate parking space in addition to the high rate of depreciation has made the potential customers of the segment rethink their decision(BBC, 2019). The sector contributes 7% to the national GDP and continual decline in the sales would mean that the economic slowdown in India would become more prominentacross other industries as well.
Based on these aspects, the following hypothesis was formed;
There is no impact of factors that enable increasing the sale of automobiles on the expectations of the customers
The research is related to the evaluation of customer satisfaction in the automobile industry of India in addition to its effect on declining sales. The research has been conducted in order to fill the existing gap in literature and knowledge regarding the interrelationship of the variables being customer satisfaction, the decline in sales and the Indian automobile industry. Independent research works have been carried out concerning the stated variables in a standalone manner or by coupling two of them in terms of customer satisfaction and the automotive industry or declining sales in the automotive industry. This research aims to bridge the gap in knowledge by enhancing the existing knowledge to establish how the decline in sales of automobiles in the Indian automobile industry is propelled by customer satisfaction.
From the chapter, it is summarised that the Indian automotive sector has been hit hard by the factors such as an economic slowdown in addition to financial restrictions and alterations in emission standards which have reduced sales by more than 30%. Customer satisfaction is essential for consideration by the dealers of automobiles as well as the manufacturers.They are required to provide the maximum value to the customers in return of their money by offering security features and optimum fuel efficiency in addition to the hassle-free purchase experience. The customers in India purchase vehicles by considering their ground clearance, resale value and depreciation. Satisfied customers return to purchase the cars from the same companies and also inform their friends about the same. The low demand from the customs have resulted in a decline in sales as the prices of acquisition including insurance and road tax has increased in addition to the base price due to GST.
Customer satisfaction is an important aspect of marketing and delivery of the product in the automobile industry as it has the ability to impact the decision of subsequent purchase of the consumers(Srinivas, 2013). The study is concerned with the evaluation of the present state of customer satisfaction as well as the drop in sales in the Indian automotive industry. In order to conduct this research in an organised manner and decipher the causes of declining sales of automobiles of all categories in the country, appropriate methodologies are required to be adopted to gather the data and analysis for making the findings more resourceful. This chapter of the study conveys the methods that have been used by the researcher to answer the research questions.
The methods used in this research are based on the research onion formulated by Saunders in order to refer to it for guidance and reference for the selection of the appropriate techniques(Saunders, 2011). The research puts special emphasis on accomplishing the main purpose along with the main philosophy based on which the decisions are made. This portion of the research details and justifies the components which make up the methodology of the study including the strategy design and approach. The methodologies for gathering data in addition to the techniques of analysis have also been elaborated.
The purpose of the cause of conducting research as the name suggests is of utmost importance during the commencement of research by understanding the reasons due to which the study is conducted in the first place and the question which has to be answered(Bell, et al., 2018). This research has the purpose analysing why customer satisfaction is essential in the automotive industry of India and what factors have resulted in the drop of sales of vehicles in the recent years.The motive of the research undertaken by researchers revolves around answering the research question as well as accomplishing the objectives of the study(Miller, et al., 2012). Similarly, this research has also identified the main problem of the research and supported it by apportioning it into some objectives which are as follows:
- To evaluate the importance of customer satisfaction in the automotive industry
- To critically analyse the factors that influence the purchase of automobiles in India
- To determine the factors highlighting the drop in vehicle sales in the automobile sector of India.
The research has been guided with the motive of accomplishing the objectives to achieve the overall cause of conducting the study.
The set of beliefs and conventions of the researcher conducting a research work provides a reflection of the philosophy(Flick, 2015). Ontology and epistemology are the two common kinds of philosophy undertaken by researchers in addition to axiology which is also present in the research onion(Saunders, 2011). Ontology presents a philosophical approach concerning the assessment of the reality of the circumstances revolving the research topic and how it influences the surroundings. Pragmatism is a crucial component of ontology in addition to objectivism and constructivism(Bryman & Bell, 2011). Another philosophy is an epistemology which presents a scientific perspective for gathering data and the subsequent techniques used for analysis for establishing the authenticity of the information(Quinlan, et al., 2019). This is done by undertaking methods and techniques which are not ambiguous and can be proven easily. Acceptable data is selected in this philosophy which consists of interpretivism in addition to realism and positivism. The third philosophy available for the researcher is axiology which signifies the understanding of opinions on part of the researcher for assessing the data collection and analysis techniques in addition to the variables(Hair Jr, et al., 2015).
This research concerning the evaluation of the present state of customer satisfaction as well as the drop in sales in the Indian automotive industry has proceeded with the research philosophy of ontology. This is due to the fact that the philosophy is beneficial for the researcher to churn knowledge which is acceptable and contributes to the enhancement of knowledge regarding identification of the causes of the slump in automobile sales in India.The philosophy of ontology is appropriate for this research as it would enable the researcher to assess the situation in reality regarding the factors which highlight the decline in sales of automobiles in India. The pragmatism branch of ontology has been used by the researcher in this study to consider all kinds of methods and perspectives which would enhance to the development and accomplishment of the research(Sekaran & Bougie, 2016). The choice of pragmatism philosophy is justified for this research as it had widened the scope of selection of the appropriate methods to the researcher by undertaking a solution-oriented approach for assessing the research problem.
The approach undertaken by the researcher for accomplishing the research problem is reflected in the choice of data gathering followed by analysis in order to establish some assumptions by considering the characteristics of the research question. The research approach is reflected in the second level of the research onion developed (Saunders, 2011). The inductive research approach along with the deductive method are the two available approaches to the researchers for conducting the study. The inductive approach is undertaken by the researchers in the absence of an already existing hypothesis among the variables of the research for establishing the same(Patten & Newhart, 2017). On the contrary, the deductive approach is concerned with the formulation of a hypothesis to test the already existing knowledge about the variables of the research to access the magnitude of acceptability(Baker & Saren, 2016).
The deductive approach has been considered for the research as there is a pre-existing hypothesis in the study. The deductive approach has benefitted the researcher to explain the casual interconnection amongst the variables of the research including customer satisfaction, drop in sales and the Indian automotive industry(Veal, 2017). This approach is justified for the research as it referred to the theory for deducing the hypothesis as well as testing it with the help of quantitative tools. The deductive method had facilitated the research as it allowed assessment abundant theoretical sources for understanding the patterns of vehicle purchase in India.
The design of the research is a reflection of the cumulative plan by which the researcher abides in order to achieve fruitful outcomes form the research by solving the research problem(Panneerselvam, 2014). The design chosen for the research is inclusive of the methods by which data is to be collected in addition to the processes which would be used by the researcher to analyse the data which has been gathered for the research. The right choice of research strategy has the ability to provide authentic results for the research as it would facilitate the choice of the perfect strategy(Sekaran & Bougie, 2016). The designs for research available to the researcher for use are of three types of which exploratory research type is the first and benefits the researcher to deliver through explanations of the findings by accumulating diverse information(Kothari, 2012). Explanatory is another design for research which can help the researcher to understand the problem of the research in-depth and deliver analysis based on the components of significance(Taylor, et al., 2015). Descriptive research design is used for mining in-depth knowledge about the topic of the research.
This research concerning the evaluation of the present state of customer satisfaction as well as the drop in sales in the Indian automotive industry has continued with the exploratory design as it would facilitate the assessment of numerous phenomenon to the researcher. This research design is appropriate to understand the factors of customer satisfaction in the Indian automotive industry as well as understand the causes of declining sales by altering and modifying the research plan as required.
The strategy used in research lays the foundation for recognition of the sequence of events and actions that would lead to the successful outcome of the research(Tight, 2016). Following an appropriate strategy enables the research to be approached by the researcher in a systematic manner following time schedules for undertaking the activities which preserve the quality of findings as well as reporting(Ritchie, et al., 2013). This research about customer satisfaction and the drop in sales in the Indian automotive sector has been conducted with the help of mixed methods research strategy which has considered both quantitative and qualitative data. Mixed methods strategy has been used for assessing multiple perspectives and opinions about the research topic and eliminates chances of bias(Neuman, 2013). This strategy has benefited the researcher to consider first-hand knowledge about the factors which highlight the decline of automotive sales in India as well as compare the qualitative and quantitative data.
The availability of adequate information is essential for conducting research and answers the questions which are made possible by the collection of relevant data(Sidel, 2014). This research regarding the examination of customer satisfaction and the state of decline of sales of automobiles in India has been commenced by collecting qualitative and quantitative data from primary sources. The research had been proceeded with collection of data from primary as well as the secondary sources such as journals, books and websites. Qualitative as well as quantitative data has been selected from the primary sources whereas qualitative data has also been gathered from the secondary sources such as scholarly journals for validating the findings of the primary research.
Qualitative data has been collected by conducting a telephonic interview spanning 20 minuteswith 1manager each from the top four leading automotive manufacturers of India namely Maruti Suzuki, Hyundai Motors, Tata Motors and Mahindra & Mahindra. The interview was aimed towards the assessment of the managerial perspectives regarding customer satisfaction and the reasons for declining sales of vehicles in India. In the interview, the managers were asked about their understanding of customer satisfaction as well as the measured taken by their companies to ensure the same. Additionally, they were also asked about the factors which contribute to purchase of vehicles in the country and the reasons for sales decline. Also, the managers were asked about why people purchase vehicles and what influences come to play in the process.The quantitative data for the research has been collected by conducting an online close-ended survey with a population of 256customerswho owned a car from the four automobile companies or any otherin India as mentioned above. The survey was done by using a structured questionnaire
Data analysis is a significant component of the research as it involves data processing stage which is beneficial for identifying useful knowledge from a large data set(Williams, 2011). The quantitative data collected for the research regarding the evaluation of customer satisfaction and the state of decline of sales of automobiles in India has been analysed with the help of statistical tool SPSS v23 as the responses were plotted into graphs and charts for ease of interpretation and inferential analyses. The data gathered from the managers from the interview was subjected to legal and analytical reasoning and presented in a descriptive manner to correlate with the findings of the survey. On the other hand, in case of qualitative analysis, the responses from the interviewees were transcribed and then synthesised into themes and therefore presented in a thematic way. The secondary data gathered from the scholarly journals were also used for analysis to compare the findings of the interview and survey to understand the acceptability of the information.
Statistical analysis has the possibility to become time-consuming and expensive and hence is required to be sampled for simplifying the research by a selection of a number of observations which act as a representative of the total population(Bellamy, 2012). This study about the assessment of customer satisfaction in the Indian automotive industry and the state of decline of sales of automobiles in India has been sampled using simple random sampling for the quantitative survey. Simple random sampling ensures that every participant has the same chance of being represented in the population and the selection is done in a manner to eliminate bias(Patten & Newhart, 2017). The sample size of 256customers had been included in the study that have either of the four chosen brands or vehicles or other.Similarly, a purposive sampling method was used for conveniently choosing 1 managereach from the chosen 4 automobile companies for exploring the reasons for decrease in auto sales.
3.9 Reliability, validity and generalizability
The research about the assessment of customer satisfaction in the Indian automotive industry and decline of sales is reliable as the research has been conducted in a systematic manner and hence similar results would be achieved if the processes are carried out in the future(Quinlan, et al., 2019). The research is also valid as it provides authentic results by considering real-life perspectives and field knowledge as well as established facts for answering the research questions(O’Reilly & Marx, 2012). Reliability of a research helps to present the trustworthiness of the study conducted and validity helps to present the originality of the research(Saunders, 2011). Reliability in case of quantitative assessment is based on Cronbach alpha test and validity of the questionnaires is based on the adoption of questions from past research papers. Similarly, in case of qualitative assessments the validity is based on final questionnaire formed on the guidance of experts and colleagues, whereas, reliability is based on the triangulation of the interview findings.
There were not much accessibility issues as all the interviewees were approached using the help of social network LinkedIN, whereby, the profiles with managerial role were requested for the interview and contacted using LinkedIN. However, multiple requests were made for the interview and the sharing of telephone number for the telephonic interview. In case of survey, the customer’s accessibility issues for the survey came from the information gathering and therefore the help of vehicle showrooms from the four different bands were utilised whereby the showroom managers provided the customers with the questionnaire links and the data was gathered.
Ethical considerations are based on maintaining the confidentiality of the respondents and maintaining ethical aspects of the data analysis procedures(Saunders, 2011). In this research study, for ethical considerations no personal information or name of the survey participants or the managers from the interviewees was mentioned in the data analysis chapter or anywhere in the study. In addition, all the customers and managers were provided with confidentiality agreement and no data or response were manipulated for the benefit of the study.
In the current chapter, the research framework has been presented whereby the methods for data collection and sampling plan as well as the data analysis methods were presented. Based on the research methodology, a mixed research is applied whereby both qualitative and quantitative method was used. In the following chapter, the data analysis findings and the interpretations have been presented both graphically and descriptively and thematically.
In the previous chapter, the research methodology was depicted and the techniques used in the conduction of the study were presented, whereby, the data analysis findings has been conducted and presented in the following chapter. The chapter have been divided into two main sections, the quantitative and the qualitative section. The quantitative section has been presented using descriptive and inferential analysis, whereas, the qualitative section has been presented with the help of themes and sub themes.
In this section, the findings from the pilot test to check the reliability of the questionnaire was performed and the findings from the factor analysis was presented. The main reason for conductingthis test was to find the factors that were most significant and the variables that most suited the test. Therefore a factor analysis was conducted based on principle component analysis for all the independent variables in the survey questionnaire. The KMO value is found to be between 0.8 and 1 with a value of .974 and the significance value at .000. This implicates that the sampling method is adequate and the variables included in the questionnaire are valid. In addition, the principle component analysis also helped in the reduction of variables that are irrelevant or show low values and therefore, only those value were used with coefficients below 0.4. However, on conduction of the assessment, it was found that all the values were above 0.6 and no secondary or tertiary components were indicated and all the independent variables were chosen. The factors analysis was conducted amongst first 25 participants of the study.
Table 1: KMO and Bartlett’s Test and Component matrix
| Kaiser-Meyer-Olkin Measure of Sampling Adequacy. | .974 | |
| Bartlett’s Test of Sphericity | Approx. Chi-Square | 4794.366 |
| df | 171 | |
| Sig. | .000 | |
| Safety features | .876 | |
| Design and structure of the vehicle | .816 | |
| After sale services | .837 | |
| Mileage | .817 | |
| Resale Value | .701 | |
| Comfort | .908 | |
| Customer Satisfaction | .925 | |
| Performance | .811 | |
| Explained the work to be performed before hand | .785 | |
| Explained the work performed and the breakdown of the charges | .800 | |
| You were informed when your car was ready | .804 | |
| The paperwork was completed and waiting for you when you arrived | .792 | |
| They contacted you to ensure the work was performed to your satisfaction | .760 | |
| Increasing benefits (free services, insurance deals, etc)for customers | .832 | |
| Customer Satisfaction | .911 | |
| Reduction in Costs | .791 | |
| Improving Vehicle Quality | .753 | |
| Assistance of brands in improving the infrastructure as a CSR | .645 | |
In the following figure 6, the frequency distribution of the respondents from the four vehicular industry have been presented based on age, gender, years of experience and the company they work for. On the other hand, the fig 5 presents the percentage distribution for ownership of any of Maruti or Hyundai or Tata Motors or Mahindra and Mahindra in the past or present. Based on the gender based frequency distribution for the participants of the study has been presented. It was found that out of 256 participants 94% of the customers as participants of the study have owned a vehicle from Maruti or Hyundai or Tata Motors or Mahindra and Mahindra; only 6% denied the same. However, they were considered for the study to ensure and explore their perspectives with the present state of customer satisfaction on drop in sales in the Indian automotive industry.
Figure 6: Ownership of any of the 4 brand
In the graph for fig 6, it implicates that there were a total of 52% male respondents and 42% female respondents own vehicles from at least one of the four automobile companies of India chosen. The remaining responses were considered as missing and invalid as they did not own any car from the four companies chosen. Similarly, for the age based distribution was found maximum for people between 41 to 60 years (37%), followed by 25% for people between ages of 26 and 40 years. On the other hand, it was found that majority of the participants have driven at least 2500 to 5000 kms per year (42%), whereas, only 14% of the male and female participants have driven less than 1000 kms per year. This may be either because they have recently bought the car or they rarely use the car and have alternate cars that they drive and does not belong to the four chosen companies. It was also found that at least 23% of the customers drive 1000 to 2000 kms per year and only 15% drive more than 5000 kms per year. Again, the customers were also asked for the reasons for drop in sales of automobiles in India. In this regard, majority said that (21%) rising costs of cars and maintenance costs, followed by poor vehicle quality (15%) and the least said that increase in fines (traffic and otherwise) (8%). Lastly, the customers were also asked if the improvements in the reasons for sale decrease and satisfactory factors and others were to increase they may think of automobile purchase decision; and 94% of the customers agreed with the same.
Figure 7: Demographic distribution
In this study, a cluster analysis was also conducted amongst the three dependent variables of the study; vehicle met your expectations, overall satisfaction and recommends your vehicle brand. This was conducted to find the structures within the dependent data responses and based on the clusters formed it can be said that there is a high degree of relationship between the intentions to purchase a vehicle and customer satisfactions and expectations from the vehicle. The distance between the responses of the participants are very close to each other with significant coefficient values of .000. This also means that there is a high chance that the hypotheses formed for the study will have a significant result and there may be a high importance of customer satisfaction on the perspectives to purchase of automobiles and therefore impact the Indian automobile industry.
Hypothesis01: There is no impact of factors perceived during purchase of vehicles on recommendation of the vehicle brand to others.
HypothesisA1: There is a significant impact of factors perceived during purchase of vehicles on recommendation of the vehicle brand to others.
A Pearson correlation test was conducted and therefore, the correlation was run between the independent and dependent variables. The independent variables in this regard were the factors that lead to the purchase of vehicles like safety features, design, performances and others to name, whereas, the dependent variable was recommend vehicle brand to others based on overall satisfaction of the customers.Based on the findings from the table 2, it can be implicated that this is a low degree of relationship with respect to features of a vehicle to recommendation for purchase as it can be seen that the correlation value for Safety features was found to be insignificant at .012 and only the factor “Resale Value” was found to have a p value less than 0.05 and a correlation value of .175. Therefore, it may be implicated that customer mostly recommend the vehicle brands based on the resale value and mileage of the vehicle, but give low priority to performance, safety, design and comfort.
| How likely are you to recommend your vehicle brand to others based on your overall satisfaction? | ||
| Safety features | Pearson Correlation | .012 |
| Sig. (2-tailed) | .856 | |
| N | 241 | |
| Design and structure of the vehicle | Pearson Correlation | .063 |
| Sig. (2-tailed) | .334 | |
| N | 240 | |
| After sale services | Pearson Correlation | .057 |
| Sig. (2-tailed) | .382 | |
| N | 240 | |
| Mileage | Pearson Correlation | .079 |
| Sig. (2-tailed) | .219 | |
| N | 241 | |
| Resale Value | Pearson Correlation | .175 |
| Sig. (2-tailed) | .007 | |
| N | 241 | |
| Comfort | Pearson Correlation | .002 |
| Sig. (2-tailed) | .971 | |
| N | 241 | |
| Customer Satisfaction | Pearson Correlation | .027 |
| Sig. (2-tailed) | .681 | |
| N | 241 | |
| Performance | Pearson Correlation | .025 |
| Sig. (2-tailed) | .698 | |
| N | 240 | |
In the next section the ANOVA and regression tests have been performed and presented. However, the study uses linear regression because there comprises of one dependent variable at once for one model. There are other types of regression like logistic or binary regression, but it is not possible in this case as the categories are different and there are more than two missing variables in the current dataset. Therefore, the ANOVA and regression was run between factors that lead to purchase a vehicle and perception to recommend on these features. Based on the ANOVA test from table 3, it can be seen that the R value is very low at .194 or 19.4% and on error estimation the adjusted R value came to be .004 or 0.4%. Therefore, it may be said that only 0.4% of the responses by the customers with respect to features of vehicle impacting their decisions to recommend lie in the regression line and there is a very low chance that the null hypothesis will be rejected. In addition, the p value was also found to be highly insignificant at .352 (p>0.05 at 95% CI).
| Model | R | R Square | Adjusted R Square | Std. Error of the Estimate | ||||||
| 1 | .194a | .038 | .004 | 1.399 | ||||||
| a. Predictors: (Constant), Performance, Comfort, Milage, Safety features, Customer Satisfaction, Resale Value, After sale services, Design and structure of the vehicle | ||||||||||
| Model | Sum of Squares | df | Mean Square | F | Sig. | |||||
| 1 | Regression | 17.501 | 8 | 2.188 | 1.117 | .352b | ||||
| Residual | 448.319 | 229 | 1.958 | |||||||
| Total | 465.819 | 237 | ||||||||
| a. Dependent Variable: How likely are you to recommend your vehicle brand to others based on your overall satisfaction? | ||||||||||
| b. Predictors: (Constant), Performance, Comfort, Mileage, Safety features, Customer Satisfaction, Resale Value, After sale services, Design and structure of the vehicle | ||||||||||
Further, to check if there is significant impact of any of the independent variables a coefficient of regression has been presented in table 4 whereby it indicates that out of the 8 independent variables only one independent variable was found to be significant, the resale value whereby p value was .023 (p<0.05) at 95% CI. On the other hand, all the variables like Safety features, Design and structure, sale services, Mileage, Customer Satisfaction and Performance were found to have insignificant variables. However, for a model to reject a null hypothesis at least one of the variables must have p<0.05 and therefore, in this section, the null hypothesis can be rejected. This means, the hypothesis statement for null there is no impact of factors perceived during purchase of vehicles on recommendation of the vehicle brand to others is rejected and significant impact of factors perceived during purchase of vehicles on recommendation of the vehicle brand to others is accepted.
| Model | Unstandardized Coefficients | Standardized Coefficients | t | Sig. | ||
| B | Std. Error | Beta | ||||
| 1 | Safety features | -.106 | .157 | -.046 | -.672 | .502 |
| Design and structure of the vehicle | .069 | .138 | .037 | .502 | .616 | |
| After sale services | .008 | .137 | .004 | .058 | .954 | |
| Mileage | .110 | .122 | .065 | .903 | .367 | |
| Resale Value | .204 | .089 | .163 | 2.284 | .023 | |
| Comfort | -.057 | .191 | -.020 | -.297 | .767 | |
| Customer Satisfaction | .173 | .216 | .055 | .801 | .424 | |
| Performance | -.004 | .124 | -.002 | -.036 | .972 | |
| a. Dependent Variable: How likely are you to recommend your vehicle brand to others based on your overall satisfaction? | ||||||
Hypothesis02: There is no relationship between customer’s perception to upgrade car or repurchase and customer’s satisfaction level from recent visit of the vehicle store.
HypothesisA2: There is a significant relationship between customer’s perception to upgrade car or repurchase and customer’s satisfaction level from recent visit of the vehicle store.
In this section, again initially Pearson was conducted whereby the independent variables were factors affect customer’s satisfaction level as per their recent service visit and the dependent variable is perception to upgrade car or repurchase from their current seller. From the correlation analysis in table 5, all the independent variables were found to have significant value at p<0.05 and the Pearson value to be positive and high. For instance the relationship between the factors “explained the work to be performed before hand” and “upgrade car or repurchase” was found to have strong and significant correlation at .530, whereby, factors like “contacted you to ensure the work was performed to your satisfaction” and “upgrade car or repurchase” was also found to be significant and positive at .341. Therefore, it may be implicated that with higher the satisfactions of the customers with respect to the services and actions provided by the vehicle companies, there is a higher chance that the customer will repurchase or upgrade car from the same brand.
| How likely are you to upgrade your car or repurchase from your current seller, according to your overall satisfaction? | ||
| Explained the work to be performed before hand | Pearson Correlation | .530 |
| Sig. (2-tailed) | .000 | |
| N | 241 | |
| Explained the work performed and the break down of the charges | Pearson Correlation | .337 |
| Sig. (2-tailed) | .000 | |
| N | 242 | |
| You were informed when your car was ready | Pearson Correlation | .315 |
| Sig. (2-tailed) | .000 | |
| N | 242 | |
| The paperwork was completed and waiting for you when you arrived | Pearson Correlation | .465 |
| Sig. (2-tailed) | .000 | |
| N | 241 | |
| They contacted you to ensure the work was performed to your satisfaction | Pearson Correlation | .341 |
| Sig. (2-tailed) | .000 | |
| N | 240 | |
In table 6, the test statistics from ANOVA has been presented. The R square value is .448 and the adjusted R is .436 with a very little variation. In this regard it may be said that 45% of the responses made from the participants lie in the regression line and it may also be implicated that 44% of the participants believe that there is a significant impact of the factors on the impact of drop in sales impact on the performance of the automobile industry. Again the significance value was also found to be .000 (p<0.05) which means there is a significant impact of the independent variables on the dependent variables. Moreover, the deviation of the standardised error is less, so, there is a high chance that the null hypothesis can be rejected in overall basis. Moreover, the F value was also found to be high indicating that there is high relationship between the factors whereby there is a significant impact on the customer’s perceptions to purchase a car or repurchase from the same seller if their experiences from visiting the company showroom was well enough and the customers felt that the services is well maintained.
| Model | R | R Square | Adjusted R Square | Std. Error of the Estimate | ||||||
| 2 | .669a | .448 | .436 | .990 | ||||||
| a. Predictors: (Constant), They contacted you to ensure the work was performed to your satisfaction, You were informed when your car was ready, Explained the work to be performed before hand, Explained the work performed and the break down of the charges, The paperwork was completed and waiting for you when you arrived | ||||||||||
| Model | Sum of Squares | df | Mean Square | F | Sig. | |||||
| 2 | Regression | 185.540 | 5 | 37.108 | 37.826 | .000b | ||||
| Residual | 228.577 | 233 | .981 | |||||||
| Total | 414.117 | 238 | ||||||||
| a. Dependent Variable: How likely are you to upgrade your car or repurchase from your current seller, according to your overall satisfaction? | ||||||||||
| b. Predictors: (Constant), They contacted you to ensure the work was performed to your satisfaction, You were informed when your car was ready, Explained the work to be performed before hand, Explained the work performed and the breakdown of the charges, The paperwork was completed and waiting for you when you arrived | ||||||||||
Based on the findings of the regression coefficient in table 7 for perceptions of the customers to upgrade their car or repurchase from current seller and found that all the five independent variables have significant variable individually ay p<0.05 and 95% CI. Therefore, it may be implicated that the factors of services like explained the work to be performed before hand, informed when car was ready, paperwork was completed and waiting and contacted to ensure the work was performed to satisfaction ensure a level of high satisfaction amongst the customers and the customer perceives to purchase or repurchase the car from the same seller. Again, the null hypothesis can be rejected that there is no relationship between customer’s perception to upgrade car or repurchase and customer’s satisfaction level from recent visit of the vehicle store, whereas, the alternative hypothesis there is a significant relationship between customer’s perception to upgrade car or repurchase and customer’s satisfaction level from recent visit of the vehicle store is accepted.
| Model | Unstandardized Coefficients | Standardized Coefficients | t | Sig. | ||
| B | Std. Error | Beta | ||||
| 2 | Explained the work to be performed before hand | .997 | .138 | .383 | 7.216 | .000 |
| Explained the work performed and the break down of the charges | .291 | .139 | .111 | 2.091 | .038 | |
| You were informed when your car was ready | .421 | .135 | .163 | 3.109 | .002 | |
| The paperwork was completed and waiting for you when you arrived | .644 | .141 | .248 | 4.569 | .000 | |
| They contacted you to ensure the work was performed to your satisfaction | .301 | .135 | .119 | 2.236 | .026 | |
| a. Dependent Variable: How likely are you to upgrade your car or repurchase from your current seller, according to your overall satisfaction? | ||||||
Hypothesis03: There is no impact of factors that enable increasing the sale of automobiles on the expectations of the customers.
HypothesisA3: There is a significant impact of factors that enable increasing the sale of automobiles on the expectations of the customers.
Based on the conduction of the Pearson correlation test for expectations of the customers and the factors that impacts the sales of vehicles, as dependent and independent respectively, it was found that the factor “Increasing benefits (free services, insurance deals, etc)for customers” had a positive and significant correlation value which means the independent and dependent are directly correlated and it means for even increase in increasing benefits of the vehicles there is a higher from the customers. This also means that when the benefits like insurances are reduced it also impacts the expectationsof the consumers which may lead to poorer sales of vehicles.Again it was also found that there is a significant relationship between“Customer Satisfaction” and the expectations of consumers which is also relatable to the poorer sales figures of automobiles. With decreasedcustomer satisfactions, there is a high chance that the customers will not purchase the brand. Again, the factors like “Reduction in Costs”, “Improving Vehicle Quality” and “Assistance of brands in improving the infrastructure as a CSR” were found to have positive correlation variables, which mean with every increase in one value of the independent variables the value for dependent also increases. It may also be implicated that there is a high chance that the null hypothesis will be rejected.
| To what extent has your vehicle met your expectations? | ||
| Increasing benefits (free services, insurance deals, etc)for customers | Pearson Correlation | .187 |
| Sig. (2-tailed) | .004 | |
| N | 241 | |
| Customer Satisfaction | Pearson Correlation | .217 |
| Sig. (2-tailed) | .001 | |
| N | 241 | |
| Reduction in Costs | Pearson Correlation | .136 |
| Sig. (2-tailed) | .035 | |
| N | 241 | |
| Improving Vehicle Quality | Pearson Correlation | .109 |
| Sig. (2-tailed) | .090 | |
| N | 241 | |
| Assistance of brands in improving the infrastructure as a CSR | Pearson Correlation | .164 |
| Sig. (2-tailed) | .011 | |
| N | 241 | |
The test statistics from ANOVA has been presented whereby the R square value is .347and the adjusted R is 0.102 with a very high variation. In this regard it may be said that at least 10% of the responses made from the participants lie in the regression line and it may also be implicated that the participants perceive that the expectation from their vehicles have an impact from factors that help in increasing the sale of automobiles. However, the F value was also found to be very low and the p value was found to be significant at .000 at 95% CI. Therefore, there is a high chance that the null hypothesis of the current model is rejected.
| Model | R | R Square | Adjusted R Square | Std. Error of the Estimate | ||||||
| 3 | .347a | .120 | .102 | .719 | ||||||
| a. Predictors: (Constant), Assistance of brands in improving the infrastructure as a CSR, Reduction in Costs, Increasing benefits (free services, insurance deals, etc)for customers, Improving Vehicle Quality, Customer Satisfaction | ||||||||||
| Model | Sum of Squares | df | Mean Square | F | Sig. | |||||
| 3 | Regression | 16.606 | 5 | 3.321 | 6.432 | .000b | ||||
| Residual | 121.345 | 235 | .516 | |||||||
| Total | 137.950 | 240 | ||||||||
| a. Dependent Variable: To what extent has your vehicle met your expectations? | ||||||||||
| b. Predictors: (Constant), Assistance of brands in improving the infrastructure as a CSR, Reduction in Costs, Increasing benefits (free services, insurance deals, etc)for customers, Improving Vehicle Quality, Customer Satisfaction | ||||||||||
The findings of the regression coefficient in table 10 indicated that majority of the factors of that impact the sale of automobiles in India were found to have significant variables at p<0.05 at 95% CI. Three out of five independent variables like increasing benefits, customer satisfaction and assistance of brands in improving the infrastructure as a CSR had p values of .011, .005 and .009 respectively. Thus it clearly shows that the customer expectations have a clear impact from the factors that impact sales of automobiles in India. When there is an increase in the benefits from the automobile industry it improves the expectations of the customers and they tend to purchase vehicles, but, when there arelow customer satisfactions the purchase will decline. Therefore, the null hypothesis is rejected and the alternative is accepted. It may be implicated that there is a significant impact of factors that enable increasing the sale of automobiles on the expectations of the customers.
In this section, the qualitative assessment has been presented, whereby, thematically the findings have been presented in a manner whereby the statements from the managers were transcribed, coded and then interpreted thematically. The section has two main parts the demographic and general information and the themes. There are three main themes; customer satisfaction, intention for purchase of vehicles and decreasing sales and production of vehicles.All the interviews took a maximum of 15 minutes and an average of 8 minutes to complete the interviews. Furthermore, all interviews were conducted over telephone and the main aspects that were discussed were; customer satisfactions, purchase factors, and reasons for decrease of vehicular purchase in India.
4.5.1 Theme 1: Customer Satisfaction
In this theme three main questions were asked for customer satisfaction measures, understanding of the same and maintain customer satisfactions in the 4 companies chosen for the study.
The manager from Hyundai said that, “Ensuring customer satisfaction and maintaining long-term relationships with customers have become essential for survival among competitive service industries.” This means that customer satisfactions is not just limited to sales and providing good services and meets the queries of the customers but also the making relationships that are long lasting and continuous. However, on the basis of measures for customer satisfaction, the managers mentioned that they look for positive reviews by the customers, brand loyalty and image, follow up of customers, and helping in decision making. The managers of Maruti Suzuki also mentioned in this regard that, “when customer recommends to a friend, family member about a vehicle and services, repurchasing and likelihood of recommending to a friend are indicators of customer satisfaction.” Lastly, the managers of Mahindra and Tata with respect to maintaining customer satisfactions stated that “listen to needs being responsive and know the customers and enable to build your brand awareness.” This can be linked to by saying that the factors like customer services, after sales services, follow up of customers and helping in decision making for right choice of vehicles and other assistance in building brand image and awareness leads to customer satisfactions(Hill & Alexander, 2017).
4.5.2 Theme 2: Influence purchase of vehicles
In this section, the managers were asked for factors that influence purchase of vehicles in India.
In this regard, the manager from Hyundai said that, “purchasing cars consider the brand of the cars that indicate their supremacy and then they look for the features of fuel efficiency”, whereas, the manager of Tata said that “customers look for “brand, price, style, performance and fuel economy, safety features, space and ground clearance.” This can be implicated that factors that have pushed the capability of Indian customers towards purchasing automobiles include the brand status and fuel efficiency. Indian customers while purchasing cars consider the brand of the cars that indicate their supremacy and then they look for the features of fuel efficiency. The purchase of automobile among the customers includes marketing mix that helps in determining the product categories along with determining the distribution system of the automobile industry within India(Baker & Saren, 2016).Safety features such as airbags that customers in India always wants when they make up their mind to purchase any vehicles. Therefore, based on all these features Indian customers decide to purchase automobiles.
4.5.3 Theme 3: Decreasing sales and production of vehicles
In this segment, the managers were asked the reasons for decreasing sales and production of vehicles.
According to the manager of Maruti Suzuki, “sales have decreased because people are worried about the increased vehicle prices and other taxes, also the increase in pooling services.” Whereas, manager of Mahindra says that, “sales of all vehicle segments have reduced dramatically inhibiting economic growth and so low sales of cars.”In this regard, it may be implicated that, the findings from the literature and the quantitative findings that drop in sales of personal cars and other vehicles in the auto, motive segment are the banking crisis, reformation of tax to introduce GST and the banning of cash in the form of demonetisation(Ibef, 2019). In addition, the low economic growth in the country in addition to the structural changes in the industry itself like altering freight rates and the norms of axle loading have furtherer added to the misery of sales.
Based on the current findings of the study, it can be implicated that customer satisfactions is not just limited to sales and providing good services and meets the queries of the customers but also the making relationships that are long lasting and continuous. However, on the basis of measures for customer satisfaction, the managers mentioned that they look for positive reviews by the customers, brand loyalty and image, follow up of customers, and helping in decision making. Moreover, based on the findings of the qualitative and quantitative, it was found that factors like customer services, after sales services, follow up of customers and helping in decision making for right choice of vehicles and other assistance in building brand image and awareness leads to customer satisfactions. Lastly, the research findings also implicated that the capability of Indian customers towards purchasing automobiles has decreased. Indian customers while purchasing cars consider the brand of the cars that indicate their supremacy and then they look for the features of fuel efficiency. In addition, the drop in sales of personal cars and other vehicles in the auto, motive segment are the banking crisis, reformation of tax to introduce GST and the banning of cash in the form of demonetisation. In addition, the low economic growth in the country in addition to the structural changes in the industry itself like altering freight rates and the norms of axle loading have furtherer added to the misery of sales. These have been implicated because of the hypothesis testing whereby the null hypotheses were rejected and the alternative accepted.
Chapter 5: Conclusion and recommendations
A brief discussion in the above section in regards to identifying customer satisfaction it has been noticed that the determinants that influence the satisfaction of the customers include of quality of the product along with its after-sales services. The quality of the product ensures that the customers receive standardised and updated products that comply with the changing needs of the customers so that they can extract values out of it and enjoy its features. Moreover, it has also been noticed that after-sales service also plays a crucial part in respect of generating customer satisfaction because receiving proper guidance’s along with an extended warranty of services enthral the consumers and resonate the value proposition of the firm towards its customers. Examining the factors related to uplift satisfaction among the customers it has been noticed that ease of accessing information makes it easier for the organisation to achieve success. The service users before making out their purchase decision always prefer to compare two similar and identical products and services based on their specifications, prices and value output. Therefore, the availability of accessing information at their fingertip benefits in generating a sense of loyalty and respect towards the organisation.
Discussing the drop in the sales of automobile sector while they extended their reach on to Indian business environment, the crisis in the banking sector that infuses inflation rate within the country increased drastically as a result of which the purchasing capability of the customers fell drastically. Examining the other factors that drop the sales of the automobile industry in India it has been noticed that reformation of tax introducing such as GST has also made it harder for the automobile industry to establish their business within India. Moreover, demonetisation in India has also helped the cause of the fact that the sales of automobiles fell drastically within the country.
- To evaluate the importance of customer satisfaction in the automotive industry
Customer satisfaction is the most crucial aspect within any business organisation because it enables the establishments in earning higher revenue along with generating more market share. Furthermore, it has also been noticed that satisfaction among the customers also benefits the automotive industry in understanding the acceptance of the new cars and their specification among their intended customer base(Hill & Alexander, 2017). The satisfaction of the customers also enables the automobile industry in gaining feedback from the customers that aids the automobile industry in designing the cars based on the feedbacks of the customers so that loyalty and customer relationships with them can be maintained. Based on the opinion of Goyal, et al. (2017)the automobile industry while operating in India accounts for receiving feedbacks from the end of the customers while conducting surveys and undertaking market research in order to access trend within the automobile industry in India. The determinants of customer satisfaction also enable the automobile industry in generating profitability for the business organisation in order to earn growth opportunities for the automobile industry working within India. Similar, implications has been found from the statistical assessments whereby it was found that there is a significant impact of factors perceived during purchase of vehicles on recommendation of the vehicle brand to others.
- To critically analyse the factors that influence the purchase of automobiles in India
Based on the opinion of Xu, et al. (2017), it has been noticed that the brand of the car is one of the prominent factors that Indian customers prefer while making out their minds to purchase a car. Brand of the automobile acts as a social class for the Indian customers which greatly resonates with their lifestyle and social class among the society, therefore the brand status of the car plays a significant factor for the customers while purchasing automobiles. India being a developing country where the infrastructure in comparison to European countries is not up to the mark the customers mainly prefers fuel-efficient cars. Fuel efficiency is one of the crucial factors that help the Indian customers in making out their mind to purchase the automobile(Kim, et al., 2015). Automobile manufacturers while manufacturing the designing of the cars in India keeps special focus towards making the car more fuel-efficient so that the growing number of middle-class people can make their mind towards purchasing automobiles. Moreover, it has also been noticed that Indian customers also prefer safety and space as the two main essential factors that influence the purchasing decision of the customers. In comparison to the western world, Indian culture believes towards extended family where more than 7-8 people reside in a family. Therefore, Indian customers mainly prefer MPV and SUVs along with retaining safety within the cars so that it influences the purchasing decision of the Indian customers. The objective can also be addressed by saying that there is a significant relationship between customer’s perception to upgrade car or repurchase and customer’s satisfaction level from recent visit of the vehicle store.
- To determine the factors highlighting the drop in vehicle sales in the automobile sector of India.
Evaluating the factors that have decreased the overall sales of vehicles in the Indian automobile industry comprises of the slow growth of the country. The GDP of India has fallen by 4.5% which made it harder for the automobile industry to operate its business within the country(BBC, 2019). Furthermore, it has also been noticed that the alteration of taxation within the country is also growing to be the challenge for the India automobile industry as because it makes it harder for the automobile industry to procure resources along with managing their expenses that decrease the profitability for the automobile organisations(Economictimes, 2019). The crunch of liquidity along with the lack of availability of finances is also a challenge for the Indian automobile industry. Lastly, the statistical analyses also implied that factors like increasing benefits, customer satisfaction and assistance of brands in improving the infrastructure as a CSR and therefore, there is a significant impact of factors that enable increasing the sale of automobiles on the expectations of the customers.
Based on the evaluation of the above section the recommendation that could be implemented by the India automobile industry as following;
- Automobile industry while operating in India can achieve success through development in product and portfolio via adding values towards the customers along with adding safety features and increasing the product portfolio.
- Indian customers like to enjoy value proposition out of their prized possession therefore automotive industry while operating in India also needs to include new process development in order to improve the quality of the cars along with offering a significant amount of quality products to the customers.
- The automobile industries in India must work and collaborate with the Government to find new policies to reduce insurance and vehicular costs and find new possibilities to increase the purchase of automobiles.
- Automobile industry may also vest their interests towards hybrid cars and electronic vehicles to improve purchase and spread awareness on new age cars and invest on innovative ideas and R&D.
- Finally, the business model of the automobile industry in India needs to be environmentally friendly and light-weight so that sustainability within the country can be implemented.
The chapter of evaluating the present state of customer satisfaction as well as the drop in sales in the Indian automotive industry is a considerably vast topic hence if there were other companies included within the research the study would have been successful. Furthermore, it has also been noticed that there were 256 customers that have been considered for the study that have owed or owns a vehicle from either of Maruti, Tata, Hyundai and Mahindra. It is suggested that in future studies there may be comparative assessment of the customer satisfactions between the owners of these or other companies and find the main and common reasons for low purchase of automobiles in India.
Ažman, S. & Gomišček, B., 2015. Functional form of connections between perceived service quality, customer satisfaction and customer loyalty in the automotive servicing industry. Total Quality Management & Business Excellence, 26(7-8), pp. 888-904.
Baker, M. & Saren, M. e., 2016. Marketing theory: a student text. London: Sage.
BBC, 2019. Why is India’s car industry in breakdown mode?. [Online]
Available at: https://www.bbc.com/news/world-asia-india-49645889
[Accessed 2 Jan 2020].
Bellamy, C., 2012. Principles of methodology. 4th ed. London: Sage.
Bell, E., Bryman, A. & Harley, B., 2018. Business research methods. 2nd ed. Oxford: Oxford university press.
Businesstoday, 2019. Automobile sales crash 23.5% in August, worst decline in a month since 1997-98. [Online]
Available at: https://www.businesstoday.in/sectors/auto/automobile-sales-hit-a-nadir-in-august-in-india-worst-decline-in-a-month-since-1997-98-even-worse-maybe-in-store-in-september/story/378137.html
[Accessed 30 Dec 2019].
Cicerone, B., 2009. Improving customer satisfaction: A lesson learned by finding the reason a car engine does not start. Performance Improvement, 48(7), p. 5.
David, A. & Banumathi, M., 2014. Factors Influencing the Purchase Decision of Passenger Cars in Puduchery. International Journal of Exclusive Management Research (IJEMR), ISSN, 4(4), pp. 2249-2585.
Economictimes, 2012. How Maruti keeps meeting India’s demand & what makes Swift and Dzire so popular. [Online]
Available at: https://economictimes.indiatimes.com/how-maruti-keeps-meeting-indias-demand-what-makes-swift-and-dzire-so-popular/articleshow/15547385.cms?from=mdr
[Accessed 30 Dec 2019].
Economictimes, 2019. 5 Factors to consider while buying a new car in India. [Online]
Available at: https://economictimes.indiatimes.com/wealth/insure/motor-insurance/5-factors-to-consider-while-buying-a-new-car-in-india/articleshow/70228145.cms?from=mdr
[Accessed 30 Dec 2019].
Economictimes, 2019. Auto slowdown’s cyclical, but may be protracted this time. [Online]
Available at: https://economictimes.indiatimes.com/markets/stocks/news/auto-slowdowns-cyclical-but-may-be-protracted-this-time/articleshow/71002552.cms?from=mdr
[Accessed 30 Dec 2019].
Economictimes, 2019. Automobile sales in India see the worst-ever fall in 21 years. [Online]
Available at: https://economictimes.indiatimes.com/industry/auto/auto-news/reverse-gear-domestic-car-sales-plunge-for-the-10th-straight-month-down-41-in-august/articleshow/71044021.cms
[Accessed 30 Dec 2019].
Economictimes, 2019. Leaders fall the most in auto Inc’s worst dip in 2 decades. [Online]
Available at: https://economictimes.indiatimes.com/industry/auto/auto-news/leaders-fall-the-most-in-auto-incs-worst-dip-in-2-decades/articleshow/71513815.cms?from=mdr
[Accessed 2 Jan 2020].
Famiyeh, S., Kwarteng, A. & Asante-Darko, D., 2018. Service quality, customer satisfaction and loyalty in automobile maintenance services: Evidence from a developing country. Journal of Quality in Maintenance Engineering, 24(3), pp. 262-279.
Fang, Y. et al., 2014. Trust, Satisfaction, and Online Repurchase Intention: The Moderating Role of Perceived Effectiveness of E-Commerce Institutional Mechanisms. Mis Quarterly, 38(2), p. 38.
Fernández-Jalvo, Y. & Andrews, P., 2016. In Atlas of Taphonomic Identifications. In: Introduction and Rationale. London: Springer, Dordrecht, pp. 1-5.
Flick, U., 2015. Introducing research methodology: A beginner’s guide to doing a research project. 5 ed. London: Sage.
Gopal, P. & Thakkar, J., 2016. Production Planning & Control. Sustainable supply chain practices: an empirical investigation on Indian automobile industry, 27(1), pp. 49-64.
Goyal, G., Samalia, H. & Verma, P., 2017. Interpretive structural modeling for integrating quality management in manufacturing and service counterparts. International Journal of Quality & Reliability Management, 34(9), pp. 1568-1591.
Hill, N. & Alexander, J., 2017. The handbook of customer satisfaction and loyalty measurement. London: Routledge.
Hill, N. & Brierley, J., 2017. How to measure customer satisfaction. London: Routledge.
Ibef, 2019. autocomponents-india. [Online]
Available at: https://www.ibef.org/industry/autocomponents-india.aspx
[Accessed 21 November 2019].
Ibef, 2019. India-automobiles. [Online]
Available at: https://www.ibef.org/industry/india-automobiles.aspx#:~:targetText=The%20Indian%20auto%20industry%20became,of%20commercial%20vehicles%20in%202018.
[Accessed 14 December 2019].
Júnior, E. et al., 2019. New business models and the sharing economy: impacts and challenges for the traditional automotive industry. International Journal of Automotive Technology and Management, 19(3-4), pp. 301-320.
Kim, D., Ko, J. & Park, Y., 2015. Transportation Research Part D: Transport and Environment. Factors affecting electric vehicle sharing program participants’ attitudes about car ownership and program participation, 36(1), pp. 96-106.
Kozlovskiy, V. & Aydarov, D., 2017. System of Customer Satisfaction Monitoring by New Cars in View of Perceived Quality. Quality-Access to Success, 18(161), p. 20.
Livemint, 2019. India auto sales decline for 10th straight month, worst slump in two decades. [Online]
Available at: https://www.livemint.com/auto-news/india-auto-sales-decline-for-10th-straight-month-worst-slump-in-two-decades-1568010510610.html
[Accessed 2 jan 2020].
Livmint, 2019. India’s per-capita income rises 10% to ₹10,534 a month in FY19. [Online]
Available at: https://www.livemint.com/politics/policy/india-s-per-capita-income-rises-10-to-rs-10-534-a-month-in-fy19-1559318636062.html
[Accessed 21 November 2019].
Miller, T., Birch, M., Mauthner, M. & Jessop, J. e., 2012. Ethics in qualitative research. 2nd ed. London: Sage.
Moneycontrol, 2019. Auto sales crash: 13 reasons why fewer people are buying cars. [Online]
Available at: https://www.moneycontrol.com/news/technology/auto/auto-sales-crash-13-reasons-why-fewer-people-are-buying-cars-4421211.html
[Accessed 30 Dec 2019].
Moneycontrol, 2019. Auto sector which is 49% of manufacturing GDP looks for rescue. [Online]
Available at: https://www.moneycontrol.com/news/business/markets/trouble-in-motown-auto-sector-which-is-49-of-manufacturing-gdp-looks-for-rescue-4264251.html
[Accessed 14 December 2019].
Nataraj, S. & Nagaraja, N., 2016. Customer satisfaction in automobile industry–an indian online buyers’ perspective of car manufacturers’ websites. International Journal of Multidisciplinary Research, 2(6), pp. 92-107.
Panneerselvam, R., 2014. Research methodology. London: PHI Learning Pvt. Ltd.
Patten, M. & Newhart, M., 2017. Understanding research methods: An overview of the essentials. 4th ed. London: Routledge.
Pirbazari, K. & Jalilian, K., 2019. Designing an Optimal Customer Satisfaction Model in Automotive Industry. Journal of Control, Automation and Electrical Systems, 31(1), pp. 31-39.
Quinlan, C., Babin, B., Carr, J. & Griffin, M., 2019. Business research methods. 1st ed. London: South Western Cengage.
Ritchie, J., Lewis, J., Nicholls, C. & Ormston, R., 2013. Qualitative research practice: A guide for social science students and researchers. eds ed. London: Sage.
Ritchie, J., Lewis, J., Nicholls, C. & Ormston, R., 2013. Qualitative research practice: A guide for social science students and researchers. 1st ed. London: Sage.
Saunders, M., 2011. Research methods for business students. 2nd ed. London: Pearson Education.
Saunders, M., 2011. Research methods for business students. London: Pearson Education .
Sekaran, U. & Bougie, R., 2016. Research methods for business: A skill building approach. 5th ed. London: John Wiley & Sons.
Shahin, A. & Mohammadi Shahiverdi, S., 2015. Estimating customer lifetime value for new product development based on the Kano model with a case study in automobile industry. Benchmarking: An International Journal, 22(5), pp. 857-873.
Siamindia, 2019. Performance of Auto Industry during 2018-19. [Online]
Available at: http://www.siamindia.com/statistics.aspx?mpgid=8&pgidtrail=9
[Accessed 21 November 2019].
Sidel, J., 2014. Economic foundations of subnational authoritarianism: Insights and evidence from qualitative and quantitative research. Democratization, 21(1), pp. 161-184.
Srinivas, K., 2013. The study on customer satisfaction with respect to Hyundai motor cars i20 in Bangalore city. International Journal of Management Research and Reviews, 3(10), p. 3569.
Taylor, S. J., Bogdan, R. & DeVault, M., 2015. Introduction to qualitative research methods: A guidebook and resource. London: John Wiley & Sons.
Telegraphindia, 2019. Two-day shutdown at Maruti. [Online]
Available at: https://www.telegraphindia.com/business/two-day-shutdown-at-maruti/cid/1702636
[Accessed 30 Dec 2019].
Tight, M., 2016. Phenomenography: The development and application of an innovative research design in higher education research. International Journal of Social Research Methodology, 19(3), pp. 319-338.
Trang, N. & Tho, N., 2019. The role of proactive postsales services in supplier innovativeness and customer satisfaction. Service Business, 13(2), pp. 249-268.
Williams, C., 2011. Research methods. Journal of Business & Economics Research (JBER), 5(3), p. 22.
Xu, L., Blankson, C. & Prybutok, V., 2017. Relative contributions of product quality and service quality in the automobile industry. Quality Management Journal, 24(1), pp. 21-36.
| Position/designation | Sales Manager |
| Years of experience | 18 |
| Company | Maruti |
| What do you understand by customer satisfaction? | “When customer recommends to a friend, family member about a vehicle and services, repurchasing and likelihood of recommending to a friend are indicators of customer satisfaction” |
| What are different measures for customer satisfaction? | “Customer Satisfaction Surveys, Feedback forms, referral vehicle purchases” |
| What does your company do to maintain customer satisfactions? | “After sales services, inform about the arrival of cars, reduce the waiting time for booked cars, free accessories, attractive insurances and loans” |
| What are the factors that influence purchase of vehicles in India? | “Price, safety features, reviews in the internet and brand image” |
| What are the main reasons for the decreasing sales and production of vehicles? | “sales have decreased because people are worried about the increased vehicle prices and other taxes, also the increase in pooling services” |
| Position/designation | Marketing Manager |
| Years of experience | 16 |
| Company | Tata |
| What do you understand by customer satisfaction? | “A highly satisfied customer is a loyal customer, buy more products, tells their friends and family about the product or service, they less likely to switch brands, costs less to serve than a new customer, they are willing to pay more for the products or service and, nowadays all companies are realizing the significance of delivering and managing service quality, which leads to customer satisfaction.” |
| What are different measures for customer satisfaction? | “Surveys, feedback, customer complaints, Customer Satisfaction Score” |
| What does your company do to maintain customer satisfactions? | “Explain the features of vehicles, help choose the best option, low waiting period, vehicle services, information of arrival of car, test drive options” |
| What are the factors that influence purchase of vehicles in India? | “Customers look for brand, price, style, performance and fuel economy, safety features, space and ground clearance” |
| What are the main reasons for the decreasing sales and production of vehicles? | “Reasonsbehind the decline in vehicle sales are multiple hikes in GST rates, fuel prices and vehicle registration cost. Apart from this, liquidity issues in semi-urban markets and high rate of interest have compelled the potential buyers to put their plans on hold.” |
| Position/designation | Deputy Manager |
| Years of experience | 23 |
| Company | Mahindra |
| What do you understand by customer satisfaction? | “A customer who has a good experience with the concerned dealer may probably use the same brand again while the customer who experiences problems with a particular brand of car may not use the same in next time.” |
| What are different measures for customer satisfaction? | “Feedback assessment, customer relations, feedback from vehicular services, customer survey” |
| What does your company do to maintain customer satisfactions? | “Low premiums, sales and post sales services and relations, use social platform for customer feedback, test drives, vehicle detailing” |
| What are the factors that influence purchase of vehicles in India? | “Cost of maintenance, insurance costs, price of vehicles, new business models” |
| What are the main reasons for the decreasing sales and production of vehicles? | “Sales of all vehicle segments have reduced dramatically inhibiting economic growth and so low sales of cars” |
| Position/designation | Sales Manager |
| Years of experience | 13 |
| Company | Hyundai |
| What do you understand by customer satisfaction? | “Ensuring customer satisfaction and maintaining long-term relationships with customers have become essential for survival among competitive service industries” |
| What are different measures for customer satisfaction? | “Use of tools like Customer Effort Score (CES), Customer Satisfaction Score, surveys and feedback on official website and customer relations” |
| What does your company do to maintain customer satisfactions? | “Ensure swift delivery of cars, home delivery of cars, accessory and freebies, vehicle service free for one year, discounts on referrals” |
| What are the factors that influence purchase of vehicles in India? | “Purchasing cars consider the brand of the cars that indicate their supremacy and then they look for the features of fuel efficiency” |
| What are the main reasons for the decreasing sales and production of vehicles? | “Decrease in purchasing power of people, GST, increase in vehicular prices, lack of interest to purchase vehicles” |
