Data Analysis Assignment Sample
Introduction
A data analysis is a process used to inspect, cleanse, transform, and model data in order to find useful information, suggest conclusions, and support decisions. Multiple methods and approaches of data analysis are used in fields such as business, science, and social science, encompassing a range of techniques under different names. The Windows version of SPSS allows users to enter data, perform analyses, and create charts and tables. As well as performing all the analyses described in the text, SPSS is capable of handling large volumes of data.
In this project the aim was to analyse data from the Welsh Health Survey in order to help to make evidence-based health care decisions. Due to the fact that the scope of the data presented was quite large, the project, in order to keep the task manageable, will specifically focus on the data concerning the relationships between race, gender, and obesity. In this case, we only kept data for specific parameters and formatted them in a way that was appropriate. In this paper, we will be discussing the results of our data analysis. As part of the report, the details of how the data was formatted, cleaned and analyzed are also provided.
Data set validity and Integrity
We considered the following factors when evaluating this dataset:
- The institution that collected the data
- Data collection’s purpose
- Date on which the data was collected
- Methods used to collect data
- Data collected and potential relationships between measures and variables.
Selecting a Dataset

We needed a dataset containing information on participants’ chronic health conditions, weight, and demographics that could help us create correlations for this project. We designed the project to incorporate these elements. Governmental sources were used to increase reporting standards and data reliability.
Additional supporting documents provided by CMS include a bibliographic citation, a manifest, and related literature.
Data Cleaning
We locate and replace any incomplete, inaccurate, inaccurate or irrelevant data with new data, modify or remove irrelevant data to produce a final quality assured dataset. A paper-based copy of a case may be referred to if any data inconsistencies are discovered when data is collected by self-complete questionnaire. During the data cleaning process, specific methods that must be applied to both the original and derived variables include:
- Conducting a review of frequency distributions for all variables (e.g. identifying outliers, checking for duplicate serial numbers and carrying out variable range checks; checking variable labels and variable response options to be sure they are complete, concise, understandable and grammatically correct);
- In the case of data errors and inconsistencies, implement decision rules and procedures regarding data correction. Making decisions about when to disregard cases as part-complete or how to handle responses when responses are misrouted (especially when data collection is done via a paper-based self-completion questionnaire). Missing data can be addressed using data imputation methods if needed.
- Making sure that the number of item non-responses (user missing responses and the number of system missing responses) is consistent with routing, and that the number of user missing responses is not too high.
A key part of the data analysis process involves verifying the accuracy of key results, for example, by comparing results and/or across specific variables with those from other pertinent surveys to identify bias or unexpected deviations.
Overcoming Dataset Limitations
When researchers examine all data provided by CMS related to the dataset, they gain a deeper understanding of the study’s strengths and weaknesses. The exposure variables, outcome variables, confounding variables, and covariates should be defined before analysis is conducted.
Crosstabulations and variable frequency tables provide information on coding patterns. There are multiple skip patterns in the MHOS design. Users of the dataset should interpret them with caution.
Descriptive Analysis
| Interval/ Ratio Variables | n | Minimum | Maximum | Mean | Std. Deviation | ||||
| Patient age in years | 28 | 23 | 80 | 52.22 | 15.315 | ||||
| Patient BMI pre-intervention | 20 | 19.92 | 26.71 | 27.9982 | 3.83132 | ||||
| Patient BMI post-intervention | 20 | 20.28 | 23.67 | 26.232 | 2.8817 | ||||
| Change in patient BMI (bmi_post – bmi_pre) | 20 | -10.02 | 7.82 | -1.693 | 3.27032 | ||||
| Number of sessions attended by patient | 20 | 1 | 19 | 10.12 | 5.512 | ||||
| Valid N (listwise) | 21 | ||||||||
| Categorical Variables | Categories | Frequency | Percent | ||||||
| Patient race | Valid | White | 6 | 20 | |||||
| Asian | 5 | 16.7 | |||||||
| Black | 8 | 26.7 | |||||||
| Hispanic | 8 | 26.7 | |||||||
| Innuit | 2 | 6.7 | |||||||
| Total | 29 | 96.7 | |||||||
| Missing | Declined to Answer | 1 | 2.2 | ||||||
| Total | 20 | 100 | |||||||
| Patient gender is female | Valid | Male | 12 | 30 | |||||
| Female | 17 | 56.7 | |||||||
| Total | 29 | 96.7 | |||||||
| Missing | Declined to Answer | 1 | 2.2 | ||||||
| Total | 20 | 100 | |||||||
| Patient marital status | Valid | Not Married | 12 | 30 | |||||
| Married | 18 | 60 | |||||||
| Total | 20 | 100 | |||||||
| Patient BMI category pre-intervention | Valid | Normal 18.5-23.99 | 9 | 20 | |||||
| Overweight 25.0-29.99 | 11 | 26.7 | |||||||
| Obese 20.0+ | 10 | 22.2 | |||||||
| Total | 20 | 100 | |||||||
| Patient education level | Valid | No Formal Education or Gr 1-8 | 2 | 6.7 | |||||
| Grade 12/HS Diploma | 6 | 20 | |||||||
| Some College | 7 | 22.2 | |||||||
| Vocational School | 1 | 2.2 | |||||||
| AA or AS Degree | 2 | 6.7 | |||||||
| Undergraduate Degree/Some Grad
School |
6 | 20 | |||||||
| Master’s Degree | 2 | 6.7 | |||||||
| Doctoral Degree | 2 | 6.7 | |||||||
| Total | 28 | 92.2 | |||||||
| Missing | Declined to Answer | 2 | 6.7 | ||||||
| Total | 20 | 100 | |||||||
| Patient below FPL threshold | Valid | Above FPL | 22 | 72.2 | |||||
| Below FPL | 7 | 22.2 | |||||||
| Total | 29 | 96.7 | |||||||
| Missing | Declined to Answer | 1 | 2.2 | ||||||
| Total | 30 | 100 | |||||||
| Patient consumed alcohol in last 12 months | Valid | No | 12 | 32.2 | |||||
| Yes | 13 | 36.7 | |||||||
| Total | 27 | 90 | |||||||
| Missing | Declined to Answer | 2 | 10 | ||||||
| Total | 20 | 100 | |||||||
Analysis
Data Description
| Variable Name | Variable type/Measure | Variable description | Label s | Label description |
| race | Nominal | Patient race | -999 | Declined to Answer |
| 0 | White | |||
| 1 | Asian | |||
| 2 | Black | |||
| 2 | Hispanic or Latino | |||
| 3 | Innuit | |||
| 5 | Pacific Islander | |||
| female | Nominal | Patient gender is female | -999 | Declined to Answer |
| 0 | Male | |||
| 1 | Female | |||
| age | Scale | Patient age in years | -999 | Declined to Answer |
| married | Nominal | Patient marital status | -999 | Declined to Answer |
| 0 | Not Married | |||
| 1 | Married | |||
| bmi_pri | Scale | Patient BMI pre-intervention | -99 | Missing |
| bmi_cat |
Ordinal |
Patient BMI category pre-
intervention |
-99 | Missing |
| 0 | Underweight 0-18.39 | |||
| 1 | Normal 18.5-23.99 | |||
| 2 | Overweight 25.0-29.99 | |||
| 2 | Obese 20.0+ | |||
| bmi_post | Scale | Patient BMI post-intervention | -99 | Missing |
| bmi_change |
Scale |
Change in patient BMI(bmi_post-
bmi_pre) |
-99 | Missing |
| education | Ordinal | Patient education level | -999 | Declined to Answer |
| 0 | No Formal Education or Gr 1-8 | |||
| 1 | Grades 9-11 | |||
| 2 | Grade 12/HS Diploma | |||
| 2 | Some College | |||
| 3 | Vocational School | |||
| 5 | AA or AS Degree | |||
| 6 | Undergraduate Degree/Some Grad
School |
|||
| 7 | Master’s Degree | |||
| 8 | Doctoral Degree | |||
| poverty | Nominal | Patient below FPL threshold | -999 | Declined to Answer |
| 0 | Above FPL | |||
| 1 | Below FPL | |||
| sessions |
Scale |
Number of sessions attended by
patient |
-99 | Missing |
| alcohol |
Nominal |
Patient consumed alcohol in last
12 months |
-999 | Declined to Answer |
| 0 | No |
Statistical tests
Relationship between race and BMI
One-way between groups ANOVA F test:
| Sum of Squares | df | Mean Square | F | Sig. | |
| Between Groups | 22.712 | 3 | 5.678 | 0.22 | 0.919 |
| Within Groups | 591.618 | 23 | 23.651 | ||
| Total | 613.222 | 28 |
Therefore, there is no significant effect on BMI among the multiple categories of Race.
Conclusion
The aim of the project was to conduct a data analysis on the Welsh Health Survey data set. However, given that the scope of the data presented was quite large, in order to keep the task manageable, the project will specifically focus on data regarding the relationship between race and gender and obesity. For this only data for specific parameters were kept and formatted accordingly. The results of the data analysis has been presented in this paper. The details of how the data was formatted, cleaned and analyzed has also been provided in the report.
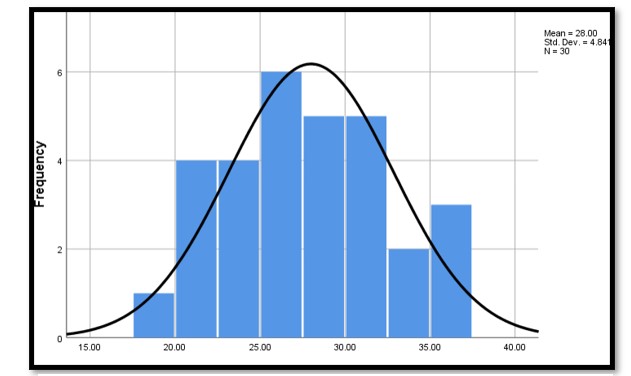
Through the evaluation, it was noted that there could not be found any significant indications that race or gender was related to obesity in Wales. This is a indication of the degree of racial and gender equity, at least in health terms for the region. Further, the mean BMI was found to be 28 which is an alarming fact given that this falls under the overweight category. This suggests that there is a public health issue in terms of obesity as this can lead to chronic health problems in the population.
References
McDonald, S., Vieira, R. & Johnston, D.W., 2020. Analysing N-of-1 observational data in health psychology and Behavioural Medicine: A 10-step SPSS tutorial for beginners. Health Psychology and Behavioral Medicine, 8(1), pp.22–53.
Perry, Z.H. et al., 2013. Computer-Based Learning: The use of SPSS statistical program for improving biostatistical competence of medical students. Journal of Biomedical Education, 2013, pp.1–9.
Rahman, A. & Muktadir, M.G., 2021. SPSS: An Imperative Quantitative Data Analysis Tool for Social Science Research. International Journal of Research and Innovation in Social Science, 05(10), pp.200–202.
………………………………………………………………………………………………………………………..
Know more about UniqueSubmission’s other writing services:
