
ECO105 ASSIGNMENT QUESTIONS
Q1.
The capacity of a business enterprise restrains the price of a particular product by manipulation of the supply, demand or both of them are shown by the market power. A monopoly is a situation where the business enterprise has the authority to decrease the supply or output for the increasing prices. Due to this, the impact on demand is that it is reduced at that time when the enterprise can increase the price (Dunne, et al., 2013). The measurement of sensitivity in a particular variable to make changes in another is referred to as elasticity. According to the concept of elasticity, in the context of the price or income changes, the amount of demand also can be changed. Price elasticity refers to the capability of bringing change in supply for increasing the price.
According to my, water supplies are the necessary goods due to which it has higher elasticity as compare to landline phone connections. The reason behind it is that if the firm decreases water supply then it will have a higher effect on people. In context of the public they will need water supply more, not the connection of landline as water is vital for them, not landline connection. Hence, it can be concluded that water supply has more market power than the landline phone connections business as it influence price more by decreasing the supply (Chen, et al., 2011).
Q2.
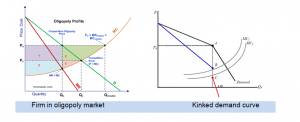
The business giants KFC, Mac Donald’s and Hungry Jack all are having an oligopolistic market structure. An oligopoly structure is one in which there are not enough firms only limited firms are dominating the market. In an oligopolistic market structure, the firms are offering homogeneous products to the customers. These three firms are also independent firms that dominate the market. These firms are having only a few competitors in the marketplace and account for a larger market share in the market, they have the power to limit the entry of new firms or market players in the market. The remaining firms to remain in the market needs to put efforts to achieve economies of scale in the market as Mac Donald’s has acquired economies of scale already (Shen & Xiao, 2014). In this type of market structure, it is very difficult for the new players to enter and make their place in the market as the barriers to entry is very high in the marketplace. Changes in the price by one firm will compel the other firms to do the same. In the oligopolistic market, the demand curve for these three companies is a kinked demand curve. The elasticity of demand for these three companies is inelastic, they have a high market share and the business firms operating in such a market structure have a high tendency to earn more profits.

Q3.
The level of competition that is been faced by the CDU in Darwin with that of Sydney Campus is a form of monopolistic competition. The university is selling alike/ homogeneous products and they have competitors which are providing services in a similar business. In respect of the competitive market, Darwin campus will have an impact on the market price because the students start to compare with similar universities or other Sydney Campuses if they increase their price. The CDU in Darwin has a downward-sloping demand curve because it has products that are a little different as compared with other universities in the context of various courses they offer as well as extracurricular activities. The downward sloping demand curve states that with a little increase in the prices of both universities, the demand will not reduce and at the same time the campus will get able to get the students enrolled. As there are different universities the demand curve is elastic (Worthington & Higgs, 2011). The type of competition that exists at CDU in Darwin has more attention on advertising which helps to develop brand loyalty. When the marginal revenue is the same as the marginal costs then in monopolistic competition the campus can attain a level of output point of profit maximization. Therefore, CDU can discover the price by the demand curve where it can maximize its level of profit-output.
Q4.
If a small variation in the price is followed up by a large variation in the demand of quantity, the product is said to be elastic. There will be inelasticity of price demand if private companies will start to provide fire emergency services in Australia. The reason behind this is that it offers a low response to price changes in the fire emergency services. Along with this, the demand will be more inelastic when the fire emergency services will get privatized (Martinez, et al., 2010). Since there are no other substitutes so the price of fire emergency services will get in demand. One of the significant factors which decide the elasticity of price of the demand is the substitutability factor. Therefore, due to a large number of closely related substitutes in the marketplace, the demand will become elastic.
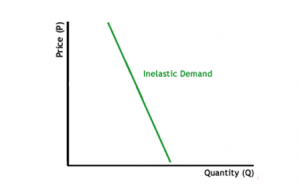
At the same time, due to inelastic demand, there will be a rise in revenues with a rise in the price of the fire emergency services as shown below.
Price Elastic Demand
Q5.
The firms access full power and control on the prices of the various products in a monopoly competition. The firms are price makers in monopoly competition and they cannot alter decisions on price as per the competitors. The level up to which the monopolist can increase the prices of the products of its firm in the market is determined by the elasticity of demand. Because of the cost conditions, the firm becomes compel to lower its price. As such there are no competitors in the short as well as the long run. However, in reality, it is seen that such a model of competition does not exist.
There exists another kind of competition model which is the monopolistic competition model where the firms encounter little competition from their competitors. The competitors are having close substitute products and also the decisions in the context of price and output are affected by the strategies of the competitors to an extent (Gaynor, et al., 2013). One of the key models is the product differentiation competition model under which there are identical cost and demand curves. Additionally, the oligopolistic competition model is one in which there are limited firms that generate alike or differentiated products. There is a situation of intense competition among the firms. They experience a state of independence regarding making decisions on market prices and outputs.
There are firms that have the majority of the market share in the marketplace and they are the dominant firms. This factor of dominance acts as a barrier for the other firms to get entry in the marketplace. Due to this type of competition, a high entry of barrier is developed for the new market players which reflects an oligopoly situation. In respect of the Australian firms, the monopolistic competition model is the most realistic model as it offers an advantage to both buyers and sellers as well. In this competition model, the new market players can enter the Australian market for capturing the market share. At the same time, the new firms are attracted for economic profits. With the introduction of new products and services by the firms, companies will initially gain market share. But at the same time, the close substitutes of the products being available in the marketplace will force the firms to reduce their market share.
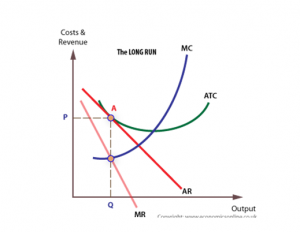
Monopolistic competition model in long-run
Q6.
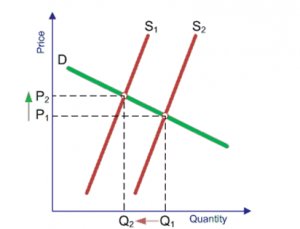
If the passing marks at CDU increase from 50% to 60% for all the tertiary students it will have an impact on the demands that will in return affect the enrollment of the students on the campus. There is an inverse proportion in the demand for enrolments and the increase in the passing marks. If the passing marks are changed the demand curve will move along and if there are no changes there will be a shift in the demand curve (McEachem, 2016). There is a negative relationship between the enrollments and the passing marks when there is a downward-sloping demand curve. The rise in the passing marks will result in a change in preference in the selection of students of the university which is a non-price factor. Due to this non-price factor, there will be a shift in the demand curve. Hence, the outlook the students have towards passing marks will get change and this will in return change the preference of CDU University.
A shift in Demand Curve
Q7.
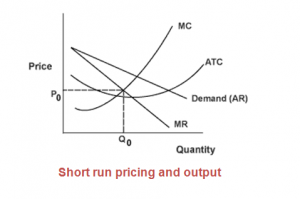
- The slope of the marginal cost curve is downward sloping and when the firm raises the production activity to an extent it starts to decline because the firm doesn’t gain from specialized labour but at a higher level of production, the marginal cost curve has an upward slope. There is an intersection in the curve at the minimum points of average total and variable costs. With the increase in the quality, there will be a decline in the marginal cost as well(Morris, et al., 2012). At the same time, with an increase in the quantity, per unit cost will decrease. With labour specialization, there will be an increase in the output so the cost curve will slope downwards. The marginal cost will also increase as more labour and effort are needed to produce additional units. At a certain level, the marginal and cost per unit also goes up and the curve slope upwards. In the competing market, the shape of the curve is U-shape.
Hence, the relationship between the level of the output and marginal cost keeping other variables constant like product price represents the marginal cost curve. Thus the cost of production of one additional unit is referred to as the marginal cost (Mazumder, 2010). On the other hand, the opportunity cost helps the organization by sacrificing the highest unit of the cost of production. The cost of making one more additional unit in the production is called the opportunity cost.
- The concept of marginal cost is significant as it depicts the relationships between the marginal cost of the product or service and that of the quantity of output been produced by the firm. It signifies the cost which is incurred by the firm to produce one more additional unit of the good/service. It also helps in providing the advantage of rising in production levels (Kesicki & Ekins, 2012). With the addition in the production of a unit of output, there is an impact on the total cost. It further helps the firm in developing an effective pricing policy with the help of cost-benefit analysis. At the same time, it also helps in providing the cost-benefit of per unit increment in the level of production.
- The marginal cost of adding an additional household on to the NBN network is the variation in the opportunity cost. Due to this the household (quantity) produced will have a rise by one additional household unit. The marginal cost refers to the variation in costs divided by the variation in quantity. Hence, it is the cost of the additional inputs that are needed to produce one additional unit of a household. The opportunity cost will increase by adding one additional labour in producing a household.
Q8.
The success of the supermarkets has contributed in the oligopoly market structure where there is a high concentration of few dominant supermarket chains. Due to this, the forms are able to gain economies of scale and also generate low price quality products or services for the end-users. This will result in developing a strategic component for these market players in the oligopolistic competition model. This structure of the market gives a competition that is not perfect for the various supermarket chains which are operating in a competitive market. There are small numbers of rivals who produce and provide similar/homogeneous or little differentiated products who become the source of competition for the supermarkets having a greater share in the market. At the same time, Tesco acts as a dominant firm and is an entry barrier for the new market players as it is already capturing a large market share in the market and also has gained economies of scale (McWilliams & Siegel, 2011). Therefore, it becomes quite easy to monitor the strategies and decisions of the competitors by the dominant firms and react against them in return. The firms which are planning to enter the market with low-profit margins should be forced to stand out by attracting new customers by the leading firms by bringing reduction in the price.
Oligopoly Demand curve
Therefore, it is observed that in the oligopoly market structure the supermarket chains focus on reducing the prices of the competitors not on increasing the prices. This will lead to giving rise in the elasticity of the demand curve.
These are the characteristics of an oligopoly market structure that will become the reason for the success of supermarkets in many countries.
References
Chen, S. H., & Liao, C. C. (2011) Are foreign banks more profitable than domestic banks? Home-and host-country effects of banking market structure, governance, and supervision. Journal of Banking & Finance, 35(4), pp. 819-839.
Dunne, T., Klimek, S. D., Roberts, M. J., & Xu, D. Y. (2013) Entry, exit, and the determinants of market structure. The RAND Journal of Economics, 44(3), pp. 462-487.
Gaynor, M., Moreno-Serra, R., & Propper, C. (2013) Death by market power: reform, competition, and patient outcomes in the National Health Service. American Economic Journal: Economic Policy, 5(4), pp. 134-166.
Kesicki, F., & Ekins, P. (2012) Marginal abatement cost curves: a call for caution. Climate Policy, 12(2), pp. 219-236.
Martinez, F. J., Toh, C. K., Cano, J. C., Calafate, C. T., & Manzoni, P. (2010) Emergency services in future intelligent transportation systems based on vehicular communication networks. IEEE Intelligent Transportation Systems Magazine, 2(2), pp. 6-20.
Mazumder, S. (2010) The new Keynesian Phillips curve and the cyclicality of marginal cost. Journal of Macroeconomics, 32(3), pp. 747-765.
McEachem, W. A. (2016) Microeconomics: A Contemporary Introduction. USA: Cengage Learning.
McWilliams, A., & Siegel, D. S. (2011) Creating and capturing value: Strategic corporate social responsibility, resource-based theory, and sustainable competitive advantage. Journal of Management, 37(5), pp. 1480-1495.
Morris, J., Paltsev, S., & Reilly, J. (2012) Marginal abatement costs and marginal welfare costs for greenhouse gas emissions reductions: results from the EPPA model. Environmental Modeling & Assessment, 17(4), pp. 325-336.
Shen, Q., & Xiao, P. (2014) McDonald’s and KFC in China: Competitors or Companions?. Marketing Science, 33(2), pp. 287-307.
Worthington, A. C., & Higgs, H. (2011) Economies of scale and scope in Australian higher education. Higher Education, 61(4), pp. 387-414.
