
ECO701 Economics and the Business Environment Assignment Sample
Question 1
This case is the case of demand-supply mechanism. The decline in the price of the laptops can tend to higher demand of the laptops among the buyers who were willing to buy it. The higher demand lowers the willingness between the buyers and thus the sale decreases which leads to lowering of the price for getting sold.

This is the case of the increasing popularity of substitute goods for its better pricing policy. Increment in the price of the relative goods which is laptop manufactured by other rival company can be directed towards the lower demand of the rival company. This increase inversely can affect the non-rival company though increasing its demand due to its lower pricing of the laptops.
- In case of more advertising or reports for the company which produce anti-virus software, it can be noted that the demand of the software must increase. The influencers promote the software for being up to date and using such anti-virus and protections can lower the risk of protection disruption.
- In the first quarter, the price of the software was 9.99 pound. In the question it is seen that the price declined in quarter 2 and it fell down to 6.99 pounds. The company sold 11000 units in the quarter 1 with respect to that price and in quarter 2 he sale increased up to 11500 units. Now the elasticity can be evaluated from the given procedure.
Price in quarter 1= 9.99 pounds
Price in quarter 2 = 6.99 pounds
Quantity in quarter 1 = 11000units
Quantity in quarter 2= 11500units
From the formula of Percentage change in quantity= [(Q2-Q1)/{(Q1+Q2)}/2]*100 = 4.44
On the other hand, the Percentage change in price= [(P2-P1)/{(P1+P2)}/2]*100 =-35.33 The price elasticity of demand can be calculated by dividing the percentage change in quantity by the percentage change in price.
Price elasticity of demand= 4.44/(-35.33)= -0.1257
The price of the software in quarter 2 attracted many customers indicating a success in its business and the elasticity is lower than one. This shows that the product is little sensitive to the product. The company can charge this price for attracting more customers for creating better future scope.
- The owner had given the fee for their online gaming specialist virus protection software at 11.99 pound in the quarter 1 which they increased in quarter 2 to 14.99 pounds. This action lowered the sale of the software which was 14000 unit in quarter 1 to 10000 units in the quarter 2. Now the elasticity can be evaluated from the given procedure.
Price in quarter 1= 11.99 pounds
Price in quarter 2 = 14.99 pounds
Quantity in quarter 1 = 14000units
Quantity in quarter 2= 10000units
From the formula of Percentage change in quantity= [(Q2-Q1)/{(Q1+Q2)}/2]*100= -16.66
From the formula of Percentage change in price= [(P2-P1)/{(P1+P2)}/2]*100= 11.23
The price elasticity of demand can be calculated by dividing the percentage change in quantity by the percentage change in price.
Price elasticity of demand= -1.48
In this case it is seen that Elasticity has changed more than 1. This is a serious indicator that the good is highly elastic in nature and this fluctuating price has been keeping serous effect in the behaviour of the consumers in order to purchase the software.
iii. In this case, the owner notices the decline of income of the regular subscribers of the software which affected the sale or subscription of the premium virus protection software to 6000 which was 9000 previously. The income of the subscribers were 3000 pounds previously which decline to 2500 pounds.
The income elasticity of demand can be evaluated in the following way.
Initial quantity or the initial number of subscribers = 9000 units
Initial Income of the subscribers = 3000 pound
Final quantity or the number of subscribers = 6000 units
Final Income of the subscribers = 2500 pounds
Income elasticity of demand indicates the sensitive change of the quantity demanded after the certain change in the income of consumers. It is calculated by dividing the percentage change in quantity demanded by the change in the income.
Income elasticity of demand= 2.22
This software is a luxury good. Luxury goods represent the goods that are not necessarily needed but willingness of the goods are high among the consumers (Issin, 2017). The elasticity of the luxury goods are very high and generally greater than 1. In this case, the income elasticity of demand of the good is 2.22 which is certainly greater than 1, the software subscription is luxury good.
Question 2
The question itself states that the bakery had been accounting higher demand which can increase its sale if they can provide more supply in aggregate. This leads to higher consumption of staff, energy and capital which can be another point of consideration for better economies of scale for avoiding loss in long run. In this case, first of all the economies of scale can be discussed for better understanding. It represents the state or position of any firm where it can produce and supply higher level of goods and services with lower average cost in the long run (Klien and Michaud, 2019). In the economies of scale, the firm gets more efficient as the cost of production reduced as the increment in the quantity produced is observed.
In this case, the bakery owner wants to increase the production and distribution through hiring new vehicles, and temporary staff at short notice. They want to have rectification of the issues which is highly needed for any bakery that wants to raise their supply. For getting the economies of scale, there are many means to achieve it. First of all, if the bakery wants to reduce the average cost in the long run, it can easily increase its plant of production. Expansion of the production is thus helpful in order to get economies of scale through cost advantages. The bakery can introduce new types of products for attracting customers and this can be beneficial for competitiveness. On the other hand, technological staffing and production processing can be beneficial. Introduction of new machines inside the bakery can lower the cost of depreciation which is mostly effective in bakery system for old machines. This can reduce serious fixed costs and it should be noted that in long run every factor of production becomes variable and the introduction of new technologies can be helpful to tackle cost advantages. Inventory and stock management is another effective way to achieve economies of scale. The inventory management can give support to the supply chain management which will introduce the company to new recognition. On the other hand, risk loving nature can be represented as beneficial for bringing out some expensive benefit for long run.
Question 3
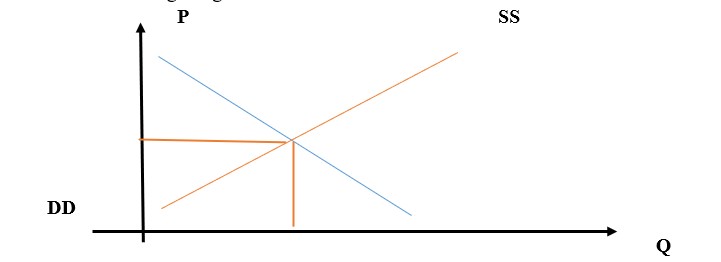
First of all, from the question it is clear that the bad weather and less interest in planting and harvesting in the households, had kept serious effect on the demand section of planting and this is responsible for the leftward shift of the demand curve shown in the following diagram.
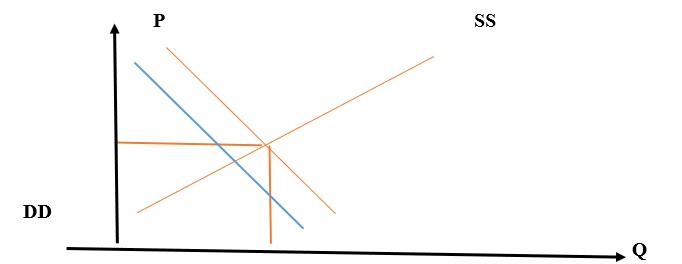
The Media streaming services is recorded to be one of the most liked action which had gathered utter public interest due to its great entertaining feature in leisure time. This is a positive sign that indicated the high demand of media service for any provider in the market (Yuan et al. 2021). From the theory of demand and supply it is noted that for any rise in demand of any good or services, the demand curve shifts rightward followed a hike in the price of the service and media service also faced the same. This means demand for the media services is quite high for any providers. Though there are many more providers in the market and demand is higher, the rightward shift in the demand curve can be seen as the sign of popularity.
On the other hand, football is no doubt a healthy practice and during the lockdown the enthusiastic game had been focus of many people which indicated by the rise of playing of it. Due to the high demand and supply of the equipment related to football, the price might not be hiking to an extreme position but the excess demand can increase it without any doubt. On the other hand it is seen that the equipment of electric scooter is less supplied than the high demand of the scooter during the lockdown which is a serious indicator of hike in its price. This is why the supply can fall and this will lead to higher level of price of the electric scooted accompanied by the higher demand of it through social media influencing.
Question 4
- From the given diagram it is seen that, at Pe Consumer surplus is ACPe and producer surplus is PeCB.
- At Pm, Consumer surplus is APmD and producer surplus is PmDFB.
- Yes, the DCF area is the deadweight loss shown in the figure.
- Yes, in any cases, minimum price not only gave the protection to the domestic market but also increased the efficiency by providing security.
Question 5
From the theory demand and supply, it is seen that at equilibrium
Quantity demanded= Quantity supplied
Qd=900-10P
Qs=5P
- At equilibrium, Qd=Qs
900-10P=5P
P=60.
Q= 300 units.
- In this case, the Consumer surplus = ½* 840*300= 126000
And Produce surplus = ½*60*300= 9000 .
- After implementation of the price ceiling, Price reduces to 50.
And on the other hand the quantity becomes Q= 250 units.
In this case, Producer surplus= ½*50*300= 7500
And Consumer surplus = ½* 250*850=106250.
The Deadweight loss= consumer loss+ producer loss= 1500+ 19750= 21250.
Question 6
| Quantity | TR | FC | Variable cost | TC | Profit | MR | MC |
| 0 | 0 | 12 | 0 | 12 | -12 | ||
| 1 | 20 | 12 | 8 | 20 | 0 | 20 | 8 |
| 2 | 40 | 12 | 24 | 36 | 4 | 20 | 12 |
| 3 | 60 | 12 | 54 | 66 | 4 | 20 | 18 |
| 4 | 80 | 12 | 108 | 120 | -40 | 20 | 27 |
| 5 | 100 | 12 | 190 | 202 | -102 | 20 | 38 |
| 6 | 120 | 12 | 312 | 324 | -204 | 20 | 52 |
- In any competitive market, price equals to marginal cost or p=MC holds and in this case, profit is maximised in the quantity 2 and 3.
- Here the fixed cost falls to 10 pounds and selling price falls to 18 pounds and its result can be seen in the following table.
| Quantity | TR | FC | Variable cost | TC | Profit | MR | MC |
| 0 | 0 | 10 | 0 | 10 | -10 | ||
| 1 | 18 | 10 | 8 | 18 | 0 | 20 | 8 |
| 2 | 36 | 10 | 24 | 34 | 2 | 20 | 12 |
| 3 | 54 | 10 | 54 | 64 | -10 | 20 | 18 |
| 4 | 72 | 10 | 108 | 118 | -36 | 20 | 27 |
| 5 | 90 | 10 | 190 | 200 | -110 | 20 | 38 |
| 6 | 108 | 10 | 312 | 322 | -214 | 20 | 52 |
Question 7
- From the view of producer, it is highly possible and easy for a monopolist to charge higher prices for any good and service in the market. This is the way where the producer can earn supernormal profit. This supernormal profit can be invested in different development of consumer and producers such as research and development (Alhadeff, 2020).
It can be seen that in monopoly, the cash reservation is more accounting.
On the other hand, for any consumer, the system is nothing but a high priced mechanism where the price of the goods are kept high with lower level of supply so that the demand remains high in the market. On the other hand, Competitive market includes lower price with differentiated types of goods available in it. The Consumer surplus is lower in monopoly along.
In monopoly, the Social welfare is reduced because the consumer surplus declines and in any social welfare case, the consumer surplus is highly important to be enough strong to promote development of the society (Zeuthen, 2018).
- It is not a permanent solution by government to break the monopoly because the natural monopoly may still exist. The government can levy some laws on it to protect small business.
Reference List
Alhadeff, D.A., 2020. Monopoly and competition in banking. University of California Press.
Issin, M., 2017, September. Approximate formulas for elasticity of the Tornquist functions and some their advantages. In AIP Conference Proceedings (Vol. 1880, No. 1, p. 060006). AIP Publishing LLC.
Klien, M. and Michaud, D., 2019. Water utility consolidation: Are economies of scale realized?. Utilities Policy, 61, p.100972.
Yuan, Y., Cheung, G., Frossard, P., Zhao, H.V. and Huang, J., 2021. Landmarking for Navigational Streaming of Stored High-Dimensional Media. arXiv preprint arXiv:2104.06876.
Zeuthen, F., 2018. Problems of monopoly and economic warfare. Routledge.
………………………………………………………………………………………………………………………..
Know more about Unique Submission’s other writing services:
