Economics and the Business Environment Assignment Sample
Question 1:
Porsche is an aspirational brand within the global automotiveindustry focusing on providing exceptional quality products at high prices. As opined by Blazkova and Dvoulety(2017), the concept of price elasticity emphasizes the interconnection between the percentage changes in quantity demand to the percentage change in price. Due to the premium pricing of Porsche goods, it is highly classified as a luxury product, in that case, the price elasticity of Porsche is regarded as elastic hinting that the price elasticity is greater than one indicating high responsiveness to the changes in the prices.
Question 2:
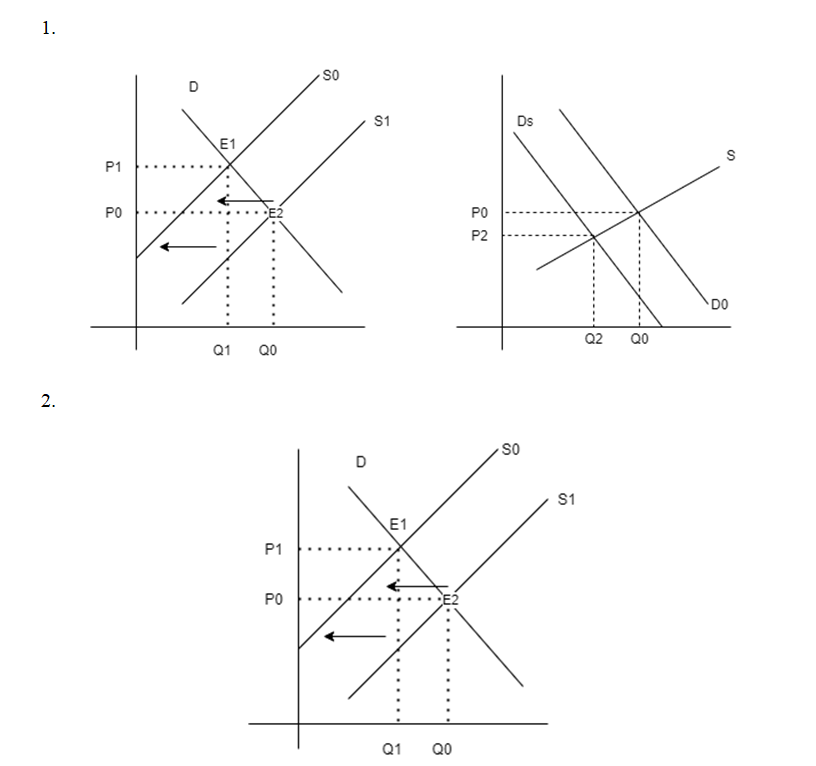
As affirmed by Michis(2016), market concentration refers to the function of the numbers of the firms and their respective contribution to the total production operating within a particular market or industry. In the provided case, during the outbreak period,the high street prices of travel size sanitizer stood at £0.99, further hinting at greater demand of customers in relation to the impulsive purchasing trait. Besides, the trickling down prices further trigger the demand for the products thus, increasing the share of market concentration. On the contrary, after the outbreak the prices of hand sanitizer rose to £2.49, with higher costs the demand for the product within the potential market segment fell considerably thereby, decreasing the share and extent of market concentration.
Question 3:
A.) The formula for the estimation of Price Elasticity of Demand is mentioned below:

Price Elasticity of Demand =Percentage Change in Quantity Demanded / Percentage Change in the Price of the Commodity
Given,
Increased the Price of Canned Soda = 10%
Sales Dropped = 2.5%
Price Elasticity of Demand = 2.5 /10 = 0.25
B.) Based on the estimated figure it is affirmative that if the price of the canned soda changes by 1% the quantity demanded will change by 0.25%. Thus, suggesting that the change in the price of the commodity will further lead to a smaller percentage change in quantity demanded. As the Total Revenue received is themultiplication of the price of the product to the quantity demanded, therefore, the changes in the prices will have a negligent impact on the total revenue earned from the sale of the product.
Question 4:
a.) Given,
QD= 100 + 4P
QS= -20 +2P
Henceforth,
In Equilibrium
QD = QS
Therefore,
= 100 +4P = -20 + 2P
= 100+ 20 = 2P +4P 3b
P (Equilibrium Price) = 20
QS= -20 + 2 X 20
Equilibrium Quantity = 20
b.) If the customers purchase 60 bottles at a given price the new equilibrium prices and quantity of the productswould be equivalent to the old equilibrium prices and quantity demanded.
Such that,
QD= 160 + 4P
QS=-40 +2P
Henceforth,
In Equilibrium
QD = QS
Therefore,
160+4P = -40 +2P
P = 20
Additionally,
QS= -20 + 2 X 20
Equilibrium Quantity = 20
Question 5:
As affirmed by Longworth, Jongeneel, and Saatkamp(2019), producer surplus refers to the difference between how much the producers of the product are willing to accept for the given quantity of goods supplied versus how much they can receive by selling the goods at the market price. Besides, changes within the equilibrium price aredirectly associated with producer surplusother things being constant. Moreover, in equilibrium as the price of the commodity increases the potential producer surplusalso increases.In addition, the shift in the demand curve is directly related to the producer’s surplus, as the demand for the commodity increases, the producer’s surplusincreases. On the other hand, in the case of the supply curve, bothquantity supplied and producer surplus are directly related. In theprovided case the equilibrium price and the quantity of good X were $10 and 5 million pounds. Additionally, as a result of increased demand,the equilibrium price and the quantity of good X are $12 and 7 million pounds. Therefore if :
A.)Producers surplus increased from $12.5 million to $49 million, the increase in the producer’s surplus would further trigger the demand for the commodities thereby enhancing the share of quantity supplied with the market.
B.)On the other hand, if the producer surplus increased from $12.5 million to $24.5 million is likely to increase the share of quantity supplied of the commodity within the operating markets followed by the rise in the demand for the commodity or service. On the contrary, the price elasticity of demand is inversely associated with producer surplus, when the supply is completely elastic the producer surplus is zero.
C.)Producer surplus increased from $3 million to $7 million, in this case, the increase in producer surplus is double, therefore, and thequantity demanded of the commodity also increases doublyin association with the quantity supplied. However, concerning the existing interconnection between the percentagechanges in quantity demandedto the percentage ata price the, producer surplus would be zero as there exists an inverse interconnection.
D.) Moreover, in this case, the producer surplus increased from $4.2 million to $5.6 million therefore, as a result of the direct interconnection between the quantity demanded, quantity supplied and producer surplus, the equilibrium price, and quantity would rise in the same percentage as of the rise in producer surplus. However, due to the inverse interconnection between the estimates of price elasticity and producer surplus, it will be zero, as depicted by a horizontal line.
Question 6:
A.) Considering the Law of Demand, there exists an inverse interconnection between the price of the commodity and the quantity demandedprovided other things remain constant. Thus, the value of the price elasticity of demand is always negative as both price and quantity have an inverse relationto each other. Provided that the Price Elasticity of Demand for Football Match tickets is -0.50 if the prices of the tickets are further increased by 5% thenthe quantity demanded would fall by 0.025 times with respect to the rise.
B.) Provided that the price elasticity of demand is –1.12 if the expenditures of fried chicken increase to an extent this would further result in increasing the price of the products consequently leading to a drastic fall in the quantity demanded corresponding to theprovided price.
C.) Given,
QD = 1,000
P = £100
Price Elasticity of Demand = 1,000 /100 = -0.10
D.) The availability of substitutes has a significant impact on the elasticity of demand as the demand for goods and commodities in the availability of substitutes is comparatively elastic that a slight increase in the price levels of goods further leads the consumer to buy substitutes. Besides, in the presence of close substitutes the quantity demanded is comparatively high which later changes the price level and vice versa.
E.) Elastic demand refers to the scenario when the price of the goods and serviceshave a considerable impact on the consumers demand. However, two of the major reason associated with elastic demand are namely, the availability of substitutes and the proportion of income spent on a particular good.
Question 7:
In the provided case, the demand for lobsters decreased from the fall in customer income however, the supply of lobster increased from the record-breaking harvest. Therefore, according to the provided case in equilibrium quantity demanded is the equivalentto quantity supplied. Henceforth the impact on the following scenarios are discussed below:
Question 8:
a.)The size of the subsidy in this case refers to the specific sum per unit produced which is given to producers. Therefore the size of the subsidiary according to this figure refers to the difference between points A and B
b.) The price the consumer pays for the subsidiary as per the figure provided below falls from P to P1
c.) In the case of the producers, the benefit of the producers refers to a section of C –P in the figure provided below.
d.)The levels of customer surplus are equivalent to PFBP1.
e.)The producer surplus is equivalent to the area of cross-section C – P unit
f.) Besides, the subsidy cost to the government is equivalent to CABP1.
g.)As a result of the total surplus within the market which is lower in the case of subsidy in the free market thus leading to economic inefficacies referred as dead weight loss.
Question 9:
a.The equilibrium price and quantity of ammunition in the free market lies in the intersection of the supply and demand curve
b.The new equilibrium price and quantity after imposing a quota on ammunition are E and F respectively
c.The area of consumer surplus before the quota is A and B
d.The area of consumer surplus after the quota is C
e.The area of producer surplus after the quota is E and C
f.The area of producer surplus after the quota is B and C
- The letters that represent the deadweight loss from the quota are C and D
Question 10:
A.) Equilibrium price and quantity
Given,
QD = 80 – 10P and QS = 10P
Henceforth,
In Equilibrium
QD = QS
Therefore,
= 80 = 10P + 10P
P = 4
QS= 10 P = 10X 4 = 40
- Producers Surplus refers to the difference between the actual prices of the commodity with respect to its market price. On the other hand, Consumer surplus is defined as the highest amount the consumer would pay for the commodity with respect to the actual price of the product. Therefore,
Consumer Surplus = 1 / 2 (40)(4) = 80
On the other hand,
Producer Surplus = 1 2 (40)(4) = 80
Plugging P = 7 into the supply curve
We get,
Q = 10(P) = 10(7) = 70
No. of Units the consumers would purchase = Q = 80 − 10(7) = 10
Difference = 60 surplus
At Floor Price of $7 per bag
Consumer Surplus = CS = 1 2 (10)(1) = 5
Producer Surplus = (6)(10) + 1 2 (10)(1) = 60 + 5 = 65.
Dead Weight Loss = 1/2 (6)(30) = 90
Question 11:
D1 indicates the demand curve at the initial stage from the particular process point of starting price-quantity adjustment. The demand volume has been decided by the consumers based on the current prices whereas the authority or the management produce item based on the price level. The equilibrium points are adjusted by the market itself in the short-run. The prices and demand have been adjusted to P* and Q* following the price mechanism. On the other hand, D2 refers to the demand curve of the long-term run and the price adjustment point has been initiated from a’. All of the factors are required to be added in the adjustment process by the producers in the long-run. The consumer behavior has been estimated based on identifying production costs. The production factors are considered as a variable where the company would adjust the output level along with attaining equilibrium in the market.
Question 12:
The demand amount and equilibrium price of wine are Qe and Pe respectively and E reflect the equilibrium. The consumer has to pay Pc and the manufacturer receive Ps where the amount of equilibrium has changed to Qs after subsidy imposition.
The subsidy cost to the treasury has been reflected through the area of PcCSPs
Measured subsidy cost = (Ps – Pc)*(Qs – O)
B.
The new social welfare level is calculated as the additional value of triangle area of APeE, and EPeG.
The subsidizing policy of wine market has resulted in rising consumer surplus level. On the contrary, the subsidiary policy has also influenced the producer surplus level. However, the customers don’t provide the same value after subsidy imposition. The producers would receive the higher subsidy value in the same production cost. The deadweight loss is generated from subsidization(Wang et al. 2020).
Question 13:
Sales tax is considered as the imposed taxes on a particular service or product offered to the customer. The particular tax has impacted the demand-supply equilibrium after considering the leftward inclination of the initial equilibrium point. The product value has been increased and the demand volume has reduced simultaneously. The demand curve’s elasticity has influenced the changing demand(Alshirah et al. 2021). The liquor demand has been considered inelastic in comparison to rental video. The change amount demand for the liquor would be reduced than the rental video after the rise in the sales tax. The sales tax burden would be on the rental video owner rather than focusing on the owner of the liquor store. It is considered as the reason behind the proposed 1% increase in sales tax by rental store owners with compared to that of the liquor shop owner.
Question 14:
The taxes provided on the items that are imported would increase the expenses of foreign products in the domestic economy. The tariff decision on imports has impacted the domestic consumers as the prices have raised(Ahn and McQuoid, 2017). The tariff has raised the domestic goods’ prices where other substitute products minimize the consumer surplus. In the figure, A, B, C, and D are considered as the identified areas which comprise the loss in customer welfare. The producers would perform better because imported tariffs of foreign products have raised producer surplus levels in the domestic economy. The producer surplus gain is denoted as A.
Table 1:Tariff situation for small domestic nation
Tariffs or taxes on foreign product imports would influence the Government by increasing the Government revenue level. The Government has been benefited from the decision of tariffs on imported items. The gain in Government revenue generation level has been estimated as area C. The overall welfare economy level is identified as the additional value of consumer and producer abundance. The customer abundance level has aggregated the producer Government revenue along with abundance gain. So, the net small domestic economy welfare would reduce by the decision of Tariff.
Question 15:
A.
Table 2: Table of Profit-maximizing Source: Auhor
| Quantity | Total Revenue | Fixed Cost | Variable Cost | Total Cost | Profit = Revenue – Total Cost | Marginal Revenue | Marginal Cost |
| 0 | 0 | 10 | — | — | |||
| 1 | 18 | 10 | 8 | 18 | 0 | 0 | 8 |
| 2 | 36 | 10 | 4 | 22 | 14 | 14 | 12 |
| 3 | 54 | 10 | 6 | 28 | 26 | 12 | 18 |
| 4 | 72 | 10 | 9 | 37 | 35 | 9 | 27 |
| 5 | 90 | 10 | 12 | 49 | 41 | 6 | 39 |
| 6 | 108 | 10 | 13 | 62 | 46 | 5 | 52 |
For maximizing the profit level, Emma would produce 6 shawls per week.
The marginal cost for additional output level has been equal with the marginal revenue for excess and additional output. The marginal expenses for the profit maximizing output is 9 which has been equal with the marginal revenue.
- The fixed cost for Emma has been reduced to 7 GBP.
Table 3: Changed profit maximisation output Source: Author
| Quantity | Total Revenue | Fixed Cost | Variable Cost | Total Cost | Profit = Revenue – Total Cost | Marginal Revenue | Marginal Cost |
| 0 | 0 | 7 | — | — | |||
| 1 | 18 | 7 | 8 | 15 | 3 | 3 | 8 |
| 2 | 36 | 7 | 4 | 19 | 15 | 12 | 12 |
| 3 | 54 | 7 | 6 | 25 | 29 | 14 | 18 |
| 4 | 72 | 7 | 9 | 34 | 38 | 9 | 27 |
| 5 | 90 | 7 | 12 | 46 | 44 | 6 | 39 |
| 6 | 108 | 7 | 13 | 59 | 49 | 5 | 52 |
So, the profit maximization decision of Emma would not change.
References
Ahn, J. and McQuoid, A.F., 2017. Capacity constrained exporters: Identifying increasing marginal cost. Economic Inquiry, 55(3), pp.1175-1191.
Al-Abbadi, H.A. and Abdul-Khaliq, S., 2017. The Causal Relationship between Sales Tax Revenue and Economic Growth in Jordan. International Research Journal of Applied Finance, 8(3), pp.170-177.
Blazkova, I. and Dvoulety, O., 2017. Is the price-cost margin affected by the market concentration? Evidence from the Czech food and beverages industry. Business and Economic Horizons, [online] 13(2), pp.256-269. Available at: <https://www.researchgate.net/publication/320501526_Is_the_price-cost_margin_affected_by_the_market_concentration_Evidence_from_the_Czech_food_and_beverages_industry> [Accessed 23 February 2021].
Michis, A., 2016. Market concentration and nonlinear pricing in European banking. Journal of Economics and Business, [online] 85, pp.1-12. Available at: <https://ideas.repec.org/a/eee/jebusi/v85y2016icp1-12.html> [Accessed 23 February 2021].
Jadidzadeh, A. and Serletis, A., 2017. How does the US natural gas market react to demand and supply shocks in the crude oil market?. Energy Economics, 63, pp.66-74.
Longworth, N., Jongeneel, R. and Saatkamp, H., 2019. A vertically linked dynamic partial equilibrium model to analyze market shocks caused by HPAI control in the Dutch egg production chain. NJAS – Wageningen Journal of Life Sciences, [online] 88, pp.112-128. Available at: <https://www.sciencedirect.com/science/article/pii/S1573521418301118> [Accessed 23 February 2021].
………………………………………………………………………………………………………………………..
Assignment Services Unique Submission Offers:
