
FINANCIAL DECISION MAKING
Executive Summary
The purpose of conducting this report is to critically examine the financial position of Marks and Spencer and thus several financial ratios have been calculated. Apart from that, business expansion is necessary in order to enhance the revenue thus M&S has an opportunity to invest £45 million. Therefore, NPV and IRR the two popular investment appraisal techniques have been used to find out the attractiveness of the investment. Along with, potential issues of ratio analysis and risks of investment have been discussed in this report. Finally, an enhanced discussion regarding the acquisition of Ocado retail Ltd. has been made briefly.
1. Introduction
Business development and enhancement are possible with proper guidance and the Chief Financial Officer helps a company to improve financial performance. It can be seen in a company that several transactions often occur and proper analysis and control is necessary. CFO is involved in decision-making activities as well thus managers are able to make accurate plans and budgets for the future. This assignment has been prepared on the basis of analyzing the financial report of Marks & Spencer and a critical analysis of its internal financial condition has been conducted.
1.1. Company Background
Marks & Spencer is a fashion brand situated in London, the UK which was established in the year 1884. Fashion choices are dependable on the demands of customers; however, M & S is able to develop its fashion segment even in a competitive market. The reason behind the success of this fashion company is a good marketing strategy and customer’s oriented products. There are over 80,000 employees serving the company in over 1400 stores across the globe. Therefore, it is necessary to examine the financial position of this big company in order to state its position in the international market.
2. Financial Performance Analysis

Analysis of financial performance is necessary for a CFO as it helps to identify the actual financial condition. According to Sharma, Kaur and Bansal (2017, p.147), a high revenue earning company suffers losses and the reason is uncontrolled expenses but ratio analysis helps a company to spot the problem in an early stage. This part of the assignment has been conducted on the basis of analyzing five years of annual reports of Marks and Spencer. There exist several ratios that are used to find out the performance of a company from different perspectives but liquidity, efficiency, profitability and leverage ratios are considered key ratios.
2.1. Profitability Ratio
Shareholders and the investor’s main attraction point is the profit earning power of a company and they prefer to invest in a high earning company. As per the view of Andjelic and Vesic (2017, p.15), profitability ratio analysis focuses on the earning power in comparison with revenue earned by the company in a year. Hence, based on the income statement of the past five years net profit percentage has been calculated for Marks and Spencer Group.
Net Profit Margin Analysis: M&S is a big retail company hence high revenue is expected and the company has been able to earn a significant amount of revenue in the last five years. However, the growth of revenue is not stable as in the year 2015 the revenue was £10,311.40 million which reached £10,698.20 million in 2018 but fell down to £10,377.30 million in 2019. Although the result of low revenue has no impact on the net profit as in the year 2018 the total net profit of M&S was £29.10 million that increased to £37.30 million in 2019. Therefore, the net margin in 2018 was 0.3% and in the year 2019 that increased to 0.4% and the highest net margin was noticed in the year 2015 where it was 4.7%.
| Profitability Ratios | 2015 | 2016 | 2017 | 2018 | 2019 |
| Revenue | 10,311.40 | 10,555.40 | 10,622.00 | 10,698.20 | 10,377.30 |
| Net Profit | 481.70 | 404.40 | 115.70 | 29.10 | 37.30 |
| Net Profit margin | 4.7% | 3.8% | 1.1% | 0.3% | 0.4% |
Table 1: Profitability Ratio
(Source: Created by learner)
Figure 1: Profitability Ratio
(Source: Created by learner)
2.2. Liquidity Ratio
The condition of M & S in terms of cash availability is an important factor and it is necessary to have a good liquidity condition as it ensures lower risks for shareholders. The current ratio is considered as a widely used liquidity ratio, therefore
Current Ratio Analysis: The calculation of the current ratio requires current assets and current liabilities of M & S and these data have been collected from the annual report. According to Shaverdi et al.(2016, p.250), it is expected for a company to have a high volume in current assets compared to current liabilities, so an ideal current ratio is 1:1. Based on the calculation it can be seen that the current assets of M & S have fluctuated several times. However, the current asset in the year 2015 was 1,455,000 and it can be seen that in the year 2019 it became 1,490,400. A high volume of current liabilities has been observed in the last five years. Therefore, based on the calculation it is observable that the current ratio in the year 2015 was 0.69:1 and the same ratio was observed in the year 2016. However, the ratio has been increased in the year 2018 and 2017 but in the year 2019 the ratio reduced to 0.67:1 due to the increase in current liabilities
| Liquidity Ratios | 2015 | 2016 | 2017 | 2018 | 2019 |
| Current Assets | 1,455.00 | 1,461.40 | 1,723.30 | 1,317.90 | 1,490.40 |
| Current Liabilities | 2,111.60 | 2,104.80 | 2,368.00 | 1,826.00 | 2,228.40 |
| Current Ratio | 0.69 | 0.69 | 0.73 | 0.72 | 0.67 |
Table 2: Liquidity Ratio
(Source: Created by learner)
Figure 2: Liquidity Ratio
(Source: Created by learner)
2.3. Efficiency Ratio
Efficiency refers to the utilization power of assets and other financial elements in production and sales. As per the view of Beg (2018, p.9), invested money of shareholders are used to expand processors or purchase fixed assets thus it is necessary to decide whether their invested money is able to increase the revenue or not. Therefore, this section has been created to analyse the efficiency of the Marks and Spencer Group.
Assets Turnover Ratio: This calculation has been conducted by comparing the revenue earned by M&S in the last five years with the total assets of the company. The company had a recent drop in revenue earnings in the year 2019 but it is also observable that the total assets also were reduced. The company had total assets of £8,196.10 million in the year 2015 which reached its highest point in the year 2016 with £8,476.10 million. However, after the year 2016 M&S has started reducing its worth as a result in the year 2019 it became £7,200.20 million. Based on the condition it can be seen that the assets turnover ratio was 1.26 in 2015 and in the year 2016 it was lowest at 1.25. The reason was the high volume of total assets and from the year 2017, it has started climbing and reached 1.44 in the year 2019 which is presently the highest in the last five years.
| Efficiency Ratio | 2015 | 2016 | 2017 | 2018 | 2019 |
| Revenue | 10,311.40 | 10,555.40 | 10,622.00 | 10,698.20 | 10,377.30 |
| Total Assets | 8,196.10 | 8,476.40 | 8,292.50 | 7,550.20 | 7,200.20 |
| Assets Turnover Ratio | 1.26 | 1.25 | 1.28 | 1.42 | 1.44 |
Table 3: Efficiency Ratio
(Source: Created by learner)
Figure 3: Efficiency Ratio
(Source: Created by learner)
2.4. Financial Gearing Ratio
The gearing ratio is used to analyse the leverage of the capital structure of a company and high leverage means high risks and also has a scoop of high income for shareholders. As per the view of Bohatkiewicz (2019, p.10), a critical analysis of the debt-equity ratio is necessary as it reflects the proportion of total liability and equity of the company.
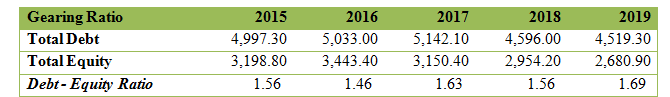
Debt – Equity ratio Analysis: Based on the calculation it is observable that the liabilities, as well as shareholder’s equity, had been reduced and increased in the last five years. The impact of these fluctuations is observable in this ratio analysis as it was 1.56 in 2015 and reduced to 1.46 in 2016. The ratio reached 1.63 in 2017 and after a drop in 2018; it again increased to 1.69 in the year 2019. Hence, it can be seen that the leverage is currently average and risk is moderate.
| Gearing Ratio | 2015 | 2016 | 2017 | 2018 | 2019 |
| Total Debt | 4,997.30 | 5,033.00 | 5,142.10 | 4,596.00 | 4,519.30 |
| Total Equity | 3,198.80 | 3,443.40 | 3,150.40 | 2,954.20 | 2,680.90 |
| Debt – Equity Ratio | 1.56 | 1.46 | 1.63 | 1.56 | 1.69 |
Table 4: Gearing Ratio
(Source: Created by learner)
Figure 4: Gearing Ratio
(Source: Created by learner)
2.5. Problems and Limitations of using ratio analysis
The result of the ratio analysis does not consider the size of the business, so the result cannot be judged based on the company’s net worth. As per the view of Boshkoska (2017, p.15), there are no strict rules of using a particular ratio to measure financial performance, so it is confusing and incomparable to shareholders. Value of money changes over the period of time, so comparison of the previous year’s performance with the current year may not provide a reliable result. Moreover, changes in accounting policies can alter the meaning of a particular financial term as a result ratio analysis using a new policy can be hard to prepare and compare.
3. Discussion on Investment Appraisal Technique
A good investment program requires analyzing the possible outcome from the investment, so investment appraisal techniques are used to analyze the investment proposals (Christensen, 2017, p.5). This part of the assignment has been prepared on the basis of utilizing NPV and IRR techniques in order to find out the attractiveness of the investment. Marks and Spencer Group has a scope of expanding business, so through using those techniques, a conclusion can be made regarding profitability from the investment option.
3.1. Evaluation of NPV technique
Net present value is the summation of present values of cash inflows of an investment program. As per the view of Dinçer, Hacıoğlu and Yüksel (2017, p.18), it represents the net profit from an investment project in current currency value by using a discounting factor. This part has been created by assuming that Marks and Spencer Group Plc has an opportunity of placing an investment of £45 million. Moreover, it has also been assumed that there is an opportunity of gaining a cash inflow of 30% of initial investment so the yearly cash inflow will be £13.5 million. The discounting factor is 12% and based on the DCF the present value of cash inflows are required to be calculated. It is a good decision-making tool because availing data of future incomes in current currency value it helps to get an idea about the possible income. It can be seen that acquiring profit from a new project often takes time thus the investment program has been made for 10 years. Apart from that, the discounting factors have been calculated as 1 / (1+12%) ^ year and through this method, the DCF of year 1 is 0.893 and it is 0.322 in the year 10. It can be expected that at the end of the investment program Marks and Spencer Group will be able to gain a significant amount of profit. Therefore, the present value of the investments has been calculated by multiplying the DCF with possible cash inflows. It can be seen that the PV of cash inflow in the first year is £12,053,571 and it is £4,346,638 at the end of year 10, so the NPV is £3,664,478.
| Year | Net Cash Flow | DCF (@12%) | PV |
| 0 | -£ 45,000,000.00 | 1.000 | -£ 45,000,000.00 |
| 1 | £ 13,500,000.00 | 0.893 | £ 12,053,571.43 |
| 2 | £ 13,500,000.00 | 0.797 | £ 10,762,117.35 |
| 3 | £ 13,500,000.00 | 0.712 | £ 9,609,033.35 |
| 4 | £ 13,500,000.00 | 0.636 | £ 8,579,494.06 |
| 5 | £ 13,500,000.00 | 0.567 | £ 7,660,262.55 |
| 6 | £ 13,500,000.00 | 0.507 | £ 6,839,520.14 |
| 7 | £ 13,500,000.00 | 0.452 | £ 6,106,714.41 |
| 8 | £ 13,500,000.00 | 0.404 | £ 5,452,423.58 |
| 9 | £ 13,500,000.00 | 0.361 | £ 4,868,235.34 |
| 10 | £ 13,500,000.00 | 0.322 | £ 4,346,638.69 |
| NPV | £ 3,664,478.73 | ||
Table 5: NPV technique
(Source: Created by learner)
3.2. Evaluation of IRR technique
The internal rate of return represents the profitability rate of the investment program, so it requires being high in order to make the investment. As per the view of Gorgieva-Trajkovska, Koleva and Nikoloski (2017, p.17), it can be compared with the discount rate as if the discount rate and IRR are equal then it means there is no profit in the investment. This technique has been calculated by comparing the changes in NPV while using a high DCF and a low DCF. The 12% discount rate has been taken as lower DCF and a 15% discount rate has been taken as the higher DCF.
| At Lower Discounting Rate | |||
| NPV | |||
| Year | Net Cash Flow | DCF (@12%) | PV |
| 0 | -£ 45,000,000.00 | 1.000 | -£ 45,000,000.00 |
| 1 | £ 13,500,000.00 | 0.893 | £ 12,053,571.43 |
| 2 | £ 13,500,000.00 | 0.797 | £ 10,762,117.35 |
| 3 | £ 13,500,000.00 | 0.712 | £ 9,609,033.35 |
| 4 | £ 13,500,000.00 | 0.636 | £ 8,579,494.06 |
| 5 | £ 13,500,000.00 | 0.567 | £ 7,660,262.55 |
| 6 | £ 13,500,000.00 | 0.507 | £ 6,839,520.14 |
| 7 | £ 13,500,000.00 | 0.452 | £ 6,106,714.41 |
| 8 | £ 13,500,000.00 | 0.404 | £ 5,452,423.58 |
| 9 | £ 13,500,000.00 | 0.361 | £ 4,868,235.34 |
| 10 | £ 13,500,000.00 | 0.322 | £ 4,346,638.69 |
| NPV | £ 3,664,478.73 | ||
Table 6: NPV at Lower Discounting Rate
(Source: Created by learner)
| At Higher Discounting Rate | |||
| NPV | |||
| Year | Net Cash Flow | DCF (@15%) | PV |
| 0 | -£ 45,000,000.00 | 1.000 | -£ 45,000,000.00 |
| 1 | £ 13,500,000.00 | 0.870 | £ 11,739,130.43 |
| 2 | £ 13,500,000.00 | 0.756 | £ 10,207,939.51 |
| 3 | £ 13,500,000.00 | 0.658 | £ 8,876,469.14 |
| 4 | £ 13,500,000.00 | 0.572 | £ 7,718,668.82 |
| 5 | £ 13,500,000.00 | 0.497 | £ 6,711,885.93 |
| 6 | £ 13,500,000.00 | 0.432 | £ 5,836,422.54 |
| 7 | £ 13,500,000.00 | 0.376 | £ 5,075,150.04 |
| 8 | £ 13,500,000.00 | 0.327 | £ 4,413,173.95 |
| 9 | £ 13,500,000.00 | 0.284 | £ 3,837,542.56 |
| 10 | £ 13,500,000.00 | 0.247 | £ 3,336,993.53 |
| NPV | £ 254,093.82 | ||
Table 7: NPV at Higher Discounting Rate
(Source: Created by learner)
Based on the calculation it has been found that the NPV of the lower DCF is £3,664,478 and by implementing a higher DCF the NPV has been found as £254,093.
Therefore, IRR = 12% + [{3,664,478 / (3,664,478 – 254,093)} * (15%-12%)]
Or, IRR = 15.22%
3.3. Illustration of Investment Appraisal results
Marks and Spencer Group has an opportunity to make an investment of £45 million from which the company will be able to make a profit of £13.5 million annually. Based on the NPV calculation it has been found that the company has an income of £3,664,478 from the 10 years program. Clearly, it is a high income and approximately 8% of the initial investment and the value is on current currency value so inflation and tax rate has been ignored. Apart from that, the IRR has been founded as 15.22% while the discount rate has been considered as 12% so, it also ensures the possibility of achieving a good amount of income.
3.4. Potential Implication
The investment of £45 million will cover within 3-4 years hence in the remaining 6-7 years the cash inflow from the investment will help the company to increase overall profitability. Based on the analysis of NPV it already proved a good investment option for the firm and after the end of the 10th year, there may exist residual value which can be an addition in cash inflow.
3.5. Risk and Uncertainty
The investment appraisal technique is considered a good decision-making technique but in future is unpredictable, so there is no guarantee in cash inflows. As per the view of Horvat and Mojzer (2019, p.15), if costs increase then the cash inflow will be reduced thus companies have to bear the risk even after analysing investment appraisal techniques.
4. Potential Merger and Acquisition
Merger and acquisition provide an opportunity to maintain business by combining the potentials of two or more companies. As per the view of Hua and Wang (2018, p.16), small companies suffer problems in a competitive market but have technological enhancement or have the power of building quality products. Thus, big companies acquire such small companies in order to use the potential advantages to enhance performance. This part of the assignment has been conducted to analyse the acquisition of Ocado Retail Ltd. by Marks & Spencer Group.
4.1. The rationale for the acquisition of Ocado Retail Ltd.
M&S is a big and old company and has been spread across the world at a successive rate; however, the e-commerce business is now changing the retail business industry. As per the view of Isiavwe, Adetiloye and Eriabie (2017, p.5), changing business strategies is essential in order to survive in the competition. Ocado Retail Ltd. had introduced its online retail business in the UK in 2000 and now the company is listed in LSE. The company has been able to adopt the online business market in a short time and now the company generates a significant amount of revenue annually. However, the business is counted in small business thus Marks and Spencer Group Plc has a good opportunity to acquire the company. Litavcová, Jencova and Vasanicova (2017, p.409), a SWOT analysis is necessary to examine in order to justify the acquisition as a good business strategy.
Strengths:
Ocado has a good platform in online business, so it is a good opportunity for M&S to use technology and increase sales. As per the view of Kim, Gutter and Spangler (2017, p.260), the online business requires a lower number of employees hence there is a scope of reducing costs. Ocado has experience in online business for over 20 years and it can be a good strength for M&S as supply chains of Ocado already exist across the world.
Weaknesses:
Ocado is new in the retail industry and has low experience in retail services so M&S may suffer losses because of bad packaging and delivery. As per the view of Lu, Won and Cheng (2016, p.20), in the case of online business there exist high costs in the packaging and distribution process.
Opportunity:
Retail business is shifting towards online business thus there is a great opportunity to enhance the online business and make profits from it (Warmath, Piehlmaierand Robb2019, p.1033). There are several countries where M&S has not opened retail shops yet, through e-commerce; there is a possibility of delivering products at the doorstep.
Threats:
Big e-commerce websites such as Amazon and Alibaba are possible threats while stepping into online business. As per the view of Manurung and Rachmat (2019, p.15), the delivery process can take time in the initial stage thus customers can get offended.
4.2. Synergistic Gain
Ocado Retail Ltd. has an online platform and also makes significant revenue as well; on the other hand, M&S has several years of experience. As per the view of Reyers (2016, p.389), there is a high possibility of increasing net profit in future by combining the strengths of the two companies. Moreover, M&S has a brand value after the successful acquisition process online sales in the Ocado platform will increase.
4.3. Evaluation of financing the acquisition
| Profitability Ratios | M&S | Ocado |
| Revenue | 10,377.30 | 1,756.60 |
| Net Profit | 37.30 | -211.8 |
| Net Profit margin | 0.4% | -12.1% |
| Liquidity Ratios | M&S | Ocado |
| Current Assets | 1,490.40 | 1,005.00 |
| Current Liabilities | 2,228.40 | 459.3 |
| Current Ratio | 0.67 | 2.19 |
| Efficiency Ratio | M&S | Ocado |
| Revenue | 10,377.30 | 1,756.60 |
| Total Assets | 7,200.20 | 2,293.20 |
| Assets Turnover Ratio | 1.44 | 0.77 |
| Gearing Ratio | M&S | Ocado |
| Total Debt | 4,519.30 | 1,234.90 |
| Total Equity | 2,680.90 | 1,058.30 |
| Debt – Equity Ratio | 1.69 | 1.17 |
Table 8: Ratio comparison of M&S and Ocado for the year ended 2019
(Source: Created by learner)
An analysis of the financial condition of the Ocado group will provide an idea of the financial performance of the company. Therefore, this analysis has been conducted on the basis of the annual report of the Ocado group for the year 2019. It can be seen that the company has an attractive liquidity ratio which is 2.19 because of the availability of high amounts in current assets. Apart from that, low risk in its debt to equity ratio is observable as it is 1.17 compared to M&S it is 1.69. However, the efficiency ratio has been founded as 0.77 which is below average and the reason is low revenue earnings. The company is presently suffering a financial loss in its business because of excessive distribution costs.
Figure 5: Ratio comparison of M&S and Ocado for the year ended 2019
(Source: Created by learner)
4.4. Issues, Challenges, Risks and Uncertainty
Market condition is unpredictable so the acquisition process may fail because of low product demand through online business strategy. As per the view of Sadovykh and Sundaram (2017, p.5), there is a need for good supply chain management in order to deliver products unharmed and it can be a challenge for the company. Expenses of packaging also need to be taken into consideration as it increases the product’s price. As per the view of Shahid, Ahmad and Badar (2017, p.25), the environmental factor is also required to include in the packaging process as excessive uses of plastic can harm the environment. There exist several people who prefer to buy clothes after judging the quality thus online shopping has its limitations as customers can not feel the product quality with their hands.
4.5. Potential Implication
The online business platform is now a necessity as the evolution of technologies has forced customers to use smartphones and a large number of customers are using e-commerce to meet their needs. It is a good opportunity for M&S to acquire Ocado in order to establish a stable online platform. Apart from that, it will also be used for advertising purposes as e-commerce will be available across the globe and able to see newly released products of M&S.
5. Conclusion
Marks and Spencer is an old and popular fashion retail brand and business expansion is necessary as competition is increasing. E-commerce websites are ruling the retail market in this century as a result revenue of M&S is declining gradually.
5.1. Suggestions and Recommendations
The company has a need for building effective and widespread online business support and Ocado group has 20 years of experience in this sector. It is recommended to M&S acquire Ocado in order to expand their online business and establish a low cost and fast supply chain system.
References
Andjelic, S. and Vesic, T., 2017.The importance of financial analysis for business decision making.In Book of proceedings from Sixth International Scientific Conference Employment, Education and Entrepreneurship (pp. 9-25).
Beg, K., 2018. Impact of Accounting Information System on the Financial Performance of Selected FMCG Companies. Asian Journal of Applied Science and Technology, pp.08-17.
Bohatkiewicz, J., 2019. Financial controlling in service enterprises: key tools and indicators facilitating the decision-making process with particular emphasis on improving financial condition. Przedsiębiorczość i Zarządzanie, 20(1, cz. 1).
Boshkoska, M., 2017.Planning and Analysis of the Company’s Financial Performances by Using a Software Simulation. Management and Economics Review, 2(1), pp.14-23.
Christensen, P.H., 2017. A post-global financial crisis (GFC) framework for strategic planning, assessment and management decision making for US sustainable commercial real estate. Journal of Property Investment & Finance.
Dinçer, H., Hacıoğlu, Ü. and Yüksel, S., 2017. Balanced scorecard based performance measurement of European airlines using a hybrid multicriteria decision-making approach under the fuzzy environment. Journal of Air Transport Management, 63, pp.17-33.
Gorgieva-Trajkovska, O., Koleva, B. and Nikoloski, K., 2017.The importance of financial reporting for investment decision making. International Journal Knowledge, 17(1).
Horvat, T. and Mojzer, J., 2019.Influence of Company Size on Accounting Information for Decision-Making of Management. Našegospodarstvo/Our economy, 65(2), pp.11-20.
Hua, F. and Wang, J., 2018. How Investor Sentiment Impacts Financial Decision-making Behavior: From A Cognitive Neuroscience Perspective. NeuroQuantology, 16(5).
Isiavwe, D.T., Adetiloye, K.A. and Eriabie, S.O., 2017. FINANCIAL REPORTS AND SHAREHOLDERS DECISION MAKING IN NIGERIA: ANY CONNECTEDNESS?. Journal of Internet Banking and Commerce, 22(8), pp.1-14.
Kim, J., Gutter, M.S. and Spangler, T., 2017. Review of family financial decision making: Suggestions for future research and implications for financial education. Journal of Financial Counseling and Planning, 28(2), pp.253-267.
Litavcová, E., Jencova, S. and Vasanicova, P., 2017.„ On Modelling the Evolution of Financial Metrics in Decision Making Unit in the Electronics Industries “. Prazak, P., MME, pp.408-413.
Lu, Q., Won, J. and Cheng, J.C., 2016. A financial decision-making framework for construction projects based on 5D Building Information Modeling (BIM). International Journal of Project Management, 34(1), pp.3-21.
Manurung, D.T. and Rachmat, R.A.H., 2019, February. Impact of ISO 14001 Implementation and Financial Performance on Corporate Social Responsibility Disclosure (Study on 2014-2016 Non-Financial Companies). In 5th Annual International Conference on Accounting Research (AICAR 2018).Atlantis Press.
Reyers, M., 2016.The role of financial literacy and advice in financial decision making. Southern African Business Review, 20(1), pp.388-413.
Sadovykh, V. and Sundaram, D., 2017, January. Decision-making processes in online social networks: A comparative analysis of health and financial online social networks. In Proceedings of the 50th Hawaii International Conference on System Sciences.
Shahid, S., Ahmad, B. and Badar, M., 2017.Association of demographic and behavioural characteristics on financial decision making. Corporate Governance and Sustainability Review, 1 (2), pp.20-29.
Sharma, A., Kaur, G. and Bansal, J., 2017.A comparative analysis of Prometheus, ahp and topics aiding in financial analysis of firm performance. In Proceedings of the First International Conference on Information Technology and Knowledge Management, ACSIS (Vol. 14, pp. 145-150).
Shaverdi, M., Ramezani, I., Tahmasebi, R. and Rostamy, A.A.A., 2016.Combining fuzzy AHP and fuzzy TOPSIS with financial ratios to design a novel performance evaluation model. International Journal of Fuzzy Systems, 18(2), pp.248-262.
Warmath, D., Piehlmaier, D. and Robb, C., 2019. The impact of shared financial decision making on overconfidence for married adults. Financial Planning Review, 2(1), p.e1032.
| Profitability Ratios | 2015 | 2016 | 2017 | 2018 | 2019 |
| Revenue | 10,311.40 | 10,555.40 | 10,622.00 | 10,698.20 | 10,377.30 |
| Net Profit | 481.70 | 404.40 | 115.70 | 29.10 | 37.30 |
| Net Profit margin | 4.7% | 3.8% | 1.1% | 0.3% | 0.4% |
Table 1: Profitability Ratio
(Source: Created by learner)
Figure 1: Profitability Ratio
(Source: Created by learner)
| Liquidity Ratios | 2015 | 2016 | 2017 | 2018 | 2019 |
| Current Assets | 1,455.00 | 1,461.40 | 1,723.30 | 1,317.90 | 1,490.40 |
| Current Liabilities | 2,111.60 | 2,104.80 | 2,368.00 | 1,826.00 | 2,228.40 |
| Current Ratio | 0.69 | 0.69 | 0.73 | 0.72 | 0.67 |
Table 2: Liquidity Ratio
(Source: Created by learner)
Figure 2: Liquidity Ratio

(Source: Created by learner)
| Efficiency Ratio | 2015 | 2016 | 2017 | 2018 | 2019 |
| Revenue | 10,311.40 | 10,555.40 | 10,622.00 | 10,698.20 | 10,377.30 |
| Total Assets | 8,196.10 | 8,476.40 | 8,292.50 | 7,550.20 | 7,200.20 |
| Assets Turnover Ratio | 1.26 | 1.25 | 1.28 | 1.42 | 1.44 |
Table 3: Efficiency Ratio
(Source: Created by learner)
Figure 3: Efficiency Ratio
(Source: Created by learner)
| Gearing Ratio | 2015 | 2016 | 2017 | 2018 | 2019 |
| Total Debt | 4,997.30 | 5,033.00 | 5,142.10 | 4,596.00 | 4,519.30 |
| Total Equity | 3,198.80 | 3,443.40 | 3,150.40 | 2,954.20 | 2,680.90 |
| Debt – Equity Ratio | 1.56 | 1.46 | 1.63 | 1.56 | 1.69 |
Table 4: Gearing Ratio
(Source: Created by learner)
Figure 4: Gearing Ratio

(Source: Created by learner)
| Year | Net Cash Flow | DCF (@12%) | PV |
| 0 | -£ 45,000,000.00 | 1.000 | -£ 45,000,000.00 |
| 1 | £ 13,500,000.00 | 0.893 | £ 12,053,571.43 |
| 2 | £ 13,500,000.00 | 0.797 | £ 10,762,117.35 |
| 3 | £ 13,500,000.00 | 0.712 | £ 9,609,033.35 |
| 4 | £ 13,500,000.00 | 0.636 | £ 8,579,494.06 |
| 5 | £ 13,500,000.00 | 0.567 | £ 7,660,262.55 |
| 6 | £ 13,500,000.00 | 0.507 | £ 6,839,520.14 |
| 7 | £ 13,500,000.00 | 0.452 | £ 6,106,714.41 |
| 8 | £ 13,500,000.00 | 0.404 | £ 5,452,423.58 |
| 9 | £ 13,500,000.00 | 0.361 | £ 4,868,235.34 |
| 10 | £ 13,500,000.00 | 0.322 | £ 4,346,638.69 |
| NPV | £ 3,664,478.73 | ||
Table 5: NPV technique
(Source: Created by learner)
| At Lower Discounting Rate | |||
| NPV | |||
| Year | Net Cash Flow | DCF (@12%) | PV |
| 0 | -£ 45,000,000.00 | 1.000 | -£ 45,000,000.00 |
| 1 | £ 13,500,000.00 | 0.893 | £ 12,053,571.43 |
| 2 | £ 13,500,000.00 | 0.797 | £ 10,762,117.35 |
| 3 | £ 13,500,000.00 | 0.712 | £ 9,609,033.35 |
| 4 | £ 13,500,000.00 | 0.636 | £ 8,579,494.06 |
| 5 | £ 13,500,000.00 | 0.567 | £ 7,660,262.55 |
| 6 | £ 13,500,000.00 | 0.507 | £ 6,839,520.14 |
| 7 | £ 13,500,000.00 | 0.452 | £ 6,106,714.41 |
| 8 | £ 13,500,000.00 | 0.404 | £ 5,452,423.58 |
| 9 | £ 13,500,000.00 | 0.361 | £ 4,868,235.34 |
| 10 | £ 13,500,000.00 | 0.322 | £ 4,346,638.69 |
| NPV | £ 3,664,478.73 | ||
Table 6: NPV at Lower Discounting Rate
(Source: Created by learner)
| NPV | |||
| Year | Net Cash Flow | DCF (@15%) | PV |
| 0 | -£ 45,000,000.00 | 1.000 | -£ 45,000,000.00 |
| 1 | £ 13,500,000.00 | 0.870 | £ 11,739,130.43 |
| 2 | £ 13,500,000.00 | 0.756 | £ 10,207,939.51 |
| 3 | £ 13,500,000.00 | 0.658 | £ 8,876,469.14 |
| 4 | £ 13,500,000.00 | 0.572 | £ 7,718,668.82 |
| 5 | £ 13,500,000.00 | 0.497 | £ 6,711,885.93 |
| 6 | £ 13,500,000.00 | 0.432 | £ 5,836,422.54 |
| 7 | £ 13,500,000.00 | 0.376 | £ 5,075,150.04 |
| 8 | £ 13,500,000.00 | 0.327 | £ 4,413,173.95 |
| 9 | £ 13,500,000.00 | 0.284 | £ 3,837,542.56 |
| 10 | £ 13,500,000.00 | 0.247 | £ 3,336,993.53 |
| NPV | £ 254,093.82 | ||
Table 7: NPV at Higher Discounting Rate
(Source: Created by learner)
| Profitability Ratios | M&S | Ocado |
| Revenue | 10,377.30 | 1,756.60 |
| Net Profit | 37.30 | -211.8 |
| Net Profit margin | 0.4% | -12.1% |
| Liquidity Ratios | M&S | Ocado |
| Current Assets | 1,490.40 | 1,005.00 |
| Current Liabilities | 2,228.40 | 459.3 |
| Current Ratio | 0.67 | 2.19 |
| Efficiency Ratio | M&S | Ocado |
| Revenue | 10,377.30 | 1,756.60 |
| Total Assets | 7,200.20 | 2,293.20 |
| Assets Turnover Ratio | 1.44 | 0.77 |
| Gearing Ratio | M&S | Ocado |
| Total Debt | 4,519.30 | 1,234.90 |
| Total Equity | 2,680.90 | 1,058.30 |
| Debt – Equity Ratio | 1.69 | 1.17 |
Table 8: Ratio comparison of M&S and Ocado for the year ended 2019
(Source: Created by learner)
Figure 5: Ratio comparison of M&S and Ocado for the year ended 2019
(Source: Created by learner)


Hello i am kavin, its my first time to commenting anyplace, when i read this post i thought i could also make comment due to this sensible piece of writing.
https://suba.me/