
Financial Analysis Assignment Sample
The main purpose of this study is to review the financial position of an organization. For this purpose, Tesco PLC is selected an organization that is reviewed in this report. In order to analyze the performance of Tesco, different ratios are calculated and compared with the ratios of its key competitor. As a competitor, Sainsbury PLC is selected and provided reviews on the basis of the calculated ratios. In addition to this, this study also provides the risk and opportunities that can are identified through the ratio analysis of Tesco. In addition, some recommendations are also provided to Tesco to improve its financial position in the industry.

The ratio analysis is considered a key area that will represent the financial position of Tesco PLC. The ratio analysis is selected because it provides the effective financial position of the company as well as the shareholders also estimate the financial position of the company. In concern to ratio analysis of Tesco PLC, different ratios are analyzed that are showing the financial strength, efficiency, and profitability of the company. Each ratio will demonstrate the capacity of the company in financial decisions (Bean & Hussey, 2011).
Financial Strengths of Tesco PLC
In order to identify the financial strength of Tesco, these ratios are compared to its main competitor Sainsbury PLC. There are some ratios are analyzed for the last financial years 2018. The below table is representing different ratios that show that the financial strengths of Tesco as compared to Sainsbury such as working capital, current ratio, quick ratio, and debt ratio:
| Financial Strengths | Tesco | SAINSBURY | |
| 1. | Working capital | (£ in Millions) | (£ in Millions) |
| Current Assets – Current Liabilities | -£5,661 | -£2,436 | |
| Current Assets | 13,577 | 7866 | |
| Current Liabilities | 19,238 | 10302 | |
| 2. | Current ratio | ||
| Current Assets/Current Liabilities | 0.71 | 0.76 | |
| Current Assets | 13,577 | 7866 | |
| Current Liabilities | 19,238 | 10302 | |
| 3. | Quick ratio (Acid test) | ||
| Liquid assets/current liabilities | 0.28 | 0.17 | |
| Liquid assets | 5306 | 1730 | |
| Current Liabilities | 19,238 | 10302 | |
| 4. | Debt ratio | ||
| Total Assets/ Total Liabilities | 129.96% | 150.80% | |
| Total Assets | 44,713 | 22001 | |
| Total Liabilities | 34404 | 14590 |
- Working capital
The working capital measures the liquidity, operational efficiency and financial health for short-term of an organization. In this, it measures the difference between current assets and current liability of an organization.
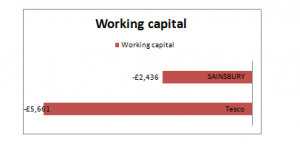
On the basis of the above diagram, it can be said that Tesco has a negative value of working capital. In this, the working capital of Tesco was -£5,661 in 2018 and working capital of Sainsbury was -£2,436 in 2018 (Annual Report, 2018). It is proving that the organizations do not have good liquidity and operational efficiency. However, it can be said that the short-term financial health of Tesco is poor that indicate a risk of distress. It is because the current liability is more than the current assets in the last two financial years.
- Current ratio
The current ratio measures the ability of the company to pay short-term obligations.
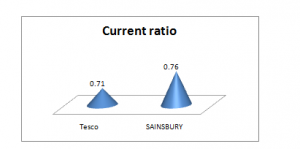
In concern to Tesco, it is identified that the company has a current ratio less than one because it is 0.71 of Tesco and 0.76 for Sainsbury (Annual Report, 2018). It is telling that Tesco is not able to meet the short-term obligations. On the other hand, it can also be said that this current ratio is alarming to Tesco that the company should increase its current assets to cover the current debts.
- Quick ratio
The quick ratio is an indicator of the short-term liquidity position of a company with its most liquid assets.
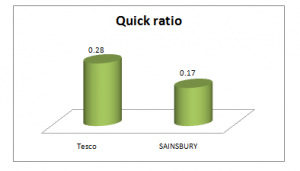
As per the above diagram, it is identified that Tesco has quick ratios less than 1 because it was 0.28 as well as it was 0.17 for Sainsbury. A normal quick ratio is considered 1 where the company’s assets have the ability to pay its current liabilities. In this situation, the company may not be able to fully pay off the current liabilities in the short term after selling its inventory (Lee et al., 2009).
- Debt ratio
The debt ratio of a firm explains the extent of leverage. Simply, it measures the proportion of assets that are financed by the debt of the company.
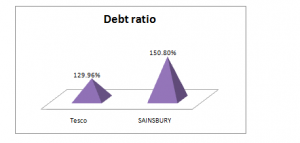
On the basis of the above image, it can be said that Tesco and Sainsbury both have more than 100% debt ratio where a considerable portion of the debt is funded by an asset of the company. Similarly, it can also be said that Tesco has more liabilities than assets that are putting it into the risk of default. It is because if the interest rates will rise sudden on its loans. In this, Tesco has 1.30 debt ratios and Sainsbury has 1.51 debt ratios that is more than 100%.
Efficiency ratios of Tesco PLC
Efficiency ratios define the financial efficiency of the company in concern to its different items of assets and labiality. The below table is calculating different ratios for Tesco to measure internal efficiency of assets and liabilities of the company.
| Efficiency ratio | Tesco | SAINSBURY | |
| 1. | Inventory turnover | (£ in Millions) | (£ in Millions) |
| Cost of sales /Inventory | 23.92 | 17.54 | |
| Cost of sales | 54,141 | 31,741 | |
| Inventory | 2,263 | 1810 | |
| 2. | Days inventory outstanding | ||
| 365/Inventory turnover | 15.26 | 20.81 | |
| 3. | Account receivable turnover | ||
| SALES/Avg. account receivable | 38.88 | 42.66 | |
| Sales | 57,491 | 31,741 | |
| Aveage Account recevable | 1478.5 | 744 | |
| 4. | Days receivable outstanding | ||
| 365/Account receivable turnover | 9.39 | 8.56 | |
| 5. | Accounts payables turnover | ||
| Purchases/Avg. account payable | 167.1250 | 49.7508 | |
| Purchases | 57,491 | 31,741 | |
| Avg. account payable | 344 | 638 | |
| 6. | Pay outstanding period | ||
| Accounts payables turnover/365 | 2.18 | 7.34 | |
| 7. | Cash consumption cycle | ||
| (Days inventory outstanding + days sales outstanding) – days payables outstanding | 22.46 | 22.30 | |
| 8. | Assets turnover | ||
| Net sales /Average total assets | 128.58% | 144.27% | |
| Sales | 57,491 | 31,741 | |
| Average total assets | 44,713 | 22,001 |
- Inventory turnover
As per the above calculation, it can be said that Tesco has a high turnover of the inventory with 23.04 in the financial year 2018 whereas Sainsbury only has inventory turnover with 17.54 in 2018. It explains that Tesco sells and replace its stock of goods 23 to 24 times in a year. The demand for the products of Tesco is good in the industry because Tesco is selling goods quickly.
- Days inventory outstanding
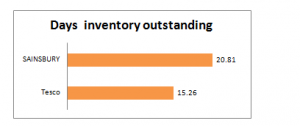
From the above figure, it can be explained that Tesco had 15.26 days or 16 days inventory outstanding in the year 2018, as well as Sainsbury, has 20.81 days or 21 days inventory outstanding in the year 2018. It is showing that Tesco takes 15 to 16 days on an average to turn its inventory into sales that are showing good performance in the industry (Marsh, 2012).
- Account receivable turnover
In the above diagram, it is described that Tesco is maintaining the accounts receivables indirectly extending interest-free loans (Sheela and Karthikeyan, 2012). In this, Sainsbury has an account receivable with 42.66 or 43 days pay for the product in the financial year 2018. On the other hand, Tesco has 38.88 or 39 days as account receivable turnover. It represents the less efficiency of Tesco as compared Sainsbury to collect credit from the customers.
- Days receivable outstanding
In the basis of the above calculation of day’s receivable outstanding, it is identified that Tesco uses 9.39 or 9 days as receivable outstanding. On the other hand, Sainsbury only provides 8.56 days to receivable outstanding that is less than Tesco’s days receivable outstanding. It is not much high for both firms and beneficial for the business operation.
- Accounts payables turnover
On the basis of the above diagram, it can be said that Tesco paid its accounts payable 167.13 times in financial 2018 whereas Sainsbury has paid to its accounts payable only 49.75 times in the financial year 2018. It can be used by the investors to determine the capabilities of the company to meet its short term obligations.
- Pay outstanding period
From the above figure, it can be explained that Tesco had 2.18 days or only 2 days as pay outstanding period in the year 2018. On the other hand, Sainsbury has 7.34 days or 7 days as pay outstanding period in the year 2018. It is showing that Tesco takes only 2 days on an average to pay for the inventory purchased from suppliers. However, it is showing good performance of the Tesco in the industry.
- Cash consumption cycle
On the basis of calculations, it can be said that Tesco has 22.46 days as cash consumption cycle in financial 2018 whereas Sainsbury has 22.03 as cash consumption cycle in financial 2018. It is explaining that Tesco is effectively managing the payments and receivables of the credit in a timely manner.
- Assets turnover
On the basis of the above calculation of assets turnover, it can be said that Tesco has assets turnover as 1.29 in 2018 whereas Sainsbury has 1.44 that is more than Tesco. In this, it can be said that Tesco is not performing better than Sainsbury because the company is not able to generate more revenue percentage as compared to its competitor. In the retail sector, the assets turnover should be higher than in other industries (Babalola and Abiola, 2013).
Profitability ratios of Tesco PLC
Profitability ratios are calculated by an organization to assess the ability to generate earnings by a business relative to its revenue, balance sheet assets, operating costs, and shareholders’ equity over time, through the use of data from a specific point in time. The below table is calculating different profitability ratios for Tesco to measure the efficiency of the company:
| Profitability ratio | Tesco | SAINSBURY | |
| 1. | Gross profit margin | (£ in Millions) | (£ in Millions) |
| Gross profit / Net sales | 5.05% | 5.93% | |
| Gross profit | 2,902 | 1,882 | |
| Net Sales | 57,491 | 31,741 | |
| 2. | Operating profit margin | ||
| Operating profit / Net sales | 1.77% | 2.19% | |
| Operating profit | 1,017 | 694 | |
| Net Sales | 57,491 | 31,741 | |
| 3. | ROA | ||
| Net income / Total assets | -4.96% | 1.40% | |
| Net Income | -2,220 | 309 | |
| Total assets | 44,713 | 22001 | |
| 4. | ROE | ||
| Net income / Average shareholder equity | -34.61% | 4.17% | |
| Net Income | -2,220 | 309 | |
| Average shareholder equity | 6,414 | 7411 |
- Gross profit margin
In the above diagram, it is described that the gross profit margin of Tesco is 5.05% whereas the gross profit margin of Sainsbury is 5.93%. It is showing that Tesco is less efficient to generate gross profit in the industry. However, it can also be said that the less efficiency of Tesco as compared Sainsbury to gain gross profit.
- Operating profit margin
On the basis of the above diagram, it is described that Sainsbury has more operating profit margin as compared to Tesco. It is because the operating profit margin of Tesco is 1.77% whereas the operating profit margin of Sainsbury is 2.19%. However, it can also be said that Tesco should focus on its operating expense to gain a competitive advantage.
- ROA
From the above diagram, it can be explained that the ROA (return on assets) of Tesco was -4.96% that is negative in nature whereas ROA of Sainsbury is 1.40% that is positive in nature. It is showing that Tesco has earned negative income (loss) in the current financial year that can increase different kinds of risks. However, it can be said that Tesco is showing bed performance in the industry.
- ROE
As like ROA, Tesco is also showing negative ROE it the current financial year. It is because Sainsbury has 4.17% ROE in the current financial year whereas Tesco has -34.61% ROE. It is showing that the shareholder equity of Tesco has been reduced in the current financial year. It provides a warning to the investors that they should not invest in the organization because the company is in the loss situation.
Risks and opportunities for Tesco
On the basis of the above ratios analysis, it is identified that the organization is facing several risk issues in the current financial year. In which, the current liabilities are more than current assets that indicate that the organization is not performing well currently. In addition to this, the company is facing risk related to paying short-term liabilities (Uechi et al., 2015). On the other hand, its concern to long-run Tesco has a good financial position because its balance is strong till now. Tesco has invested in different fixed assets that provide the opportunity to reduce further exposure.
The above risks can be reduced by Tesco through the use of different growth opportunities such as develop the market, increase product line, increment in product mix, etc. The growth opportunities will deliver strong and sustainable returns for the stakeholders.
On the basis of the above financial analysis or review, it is recommended to Tesco that it should focus on the liquidity position of the company and it should strengthen the current assets position of the company. In addition to this, it is also recommended that the organization should also design a cost reduction strategy to reduce the overall cost of business and increase the revenue and income of the company.
On the basis of the above analysis, it is concluded that the financial position of Tesco PLC is reviewed by the ratio analysis method. In this method, the different ratios are compared to Tesco’s key competitor Sainsbury. In the ratio analysis, it is reviewed that Tesco is facing several issues that are risky for the business and its position in the industry is reducing day by day. In addition to this, the study also explained several risks and opportunities that are identified through this financial review of Tesco. In this, it is concluded that the company has a good financial position for the long-run but it is not battered in the short-run. However, it can be said that the company should focus on the strategy that can improve the short-term financial position such as liquidity position, shareholder’s value, etc.
Annual Report (2018) Sainsburys` plc. [Online]. Available at https://www.about.sainsburys.co.uk/~/media/Files/S/Sainsburys/documents/reports-and-presentations/annual-reports/sainsburys-ar-2018-full-report-v2.pdf (Accessed: 3 May, 2019)
Annual Report (2018) Tesco PLC. [Online]. Available at https://www.tescoplc.com/media/474793/tesco_ar_2018.pdf (Accessed: 3 May, 2019)
Babalola, Y.A. and Abiola, F.R. (2013) Financial ratio analysis of firms: A tool for decision making. International journal of management sciences, 1(4), 132-137.
Bean, J. & Hussey, L. (2011) Finance for Non Financial Public Sector Managers: Essential Skills for the Public Sector. UK: HB Publications.
Higgins, R.C. (2012) Analysis for financial management. McGraw-Hill/Irwin.
Lee, A.C., Lee, J.C. & Lee, C.F. (2009) Financial Analysis, Planning & Forecasting: Theory and Application. Singapore: World Scientific.
Marsh, C. (2012) Financial Management for Non-Financial Managers Strategic Success. UK: Kogan Page Publishers.
Mayo, H. (2015) Basic Finance: An Introduction to Financial Institutions, Investments, and Management. USA: Cengage Learning.
Melicher, R.W. & Norton, E.A. (2011) Introduction to Finance: Markets, Investments, and Financial Management (14th ed). USA: John Wiley and Sons.
Porter, G., & Norton, C. (2012) Financial accounting: the impact on decision makers. USA: Cengage Learning.
Samonas, M. (2015) Financial Forecasting, Analysis and Modelling: A Framework for Long-Term Forecasting. UK: John Wiley & Sons.
Sheela, S.C. and Karthikeyan, K. (2012) Financial performance of pharmaceutical industry in India using dupont analysis. European Journal of Business and Management, 4(14), 84-91.
Uechi, L., Akutsu, T., Stanley, H.E., Marcus, A.J. and Kenett, D.Y. (2015) Sector dominance ratio analysis of financial markets. Physica A: Statistical Mechanics and its Applications, 421, 488-509.
Vemic, M.B. (2010) Elaboration of Key Aspects of Financial Planning In Entrepreneurial Endeavours, Economics and Organization, 7(4), pp. 411 – 421.
Wang, X. (2010) Financial Management in the Public Sector: Tools, Applications, and Cases. UK: M.E. Sharpe.
