
Financial Analysis of Next PLC
The report aim is to evaluate public limited company performance as how well it is performing in its own industry. For this report Next Plc is selected as the company to evaluate the performance. In the report, ratio analysis is carried out for Next Plc so that performance can be evaluated. The report also evaluates risk and opportunity of Next Plc. It also provide recommendation to Next Plc. The report compares both Next Plc and Marks and Spencer, UK financial strength.

Next Plc is the multinational clothing, home products as well as footwear retailer in UK. Its headquarters is situated in Enderby. It was established in the year 1864 and founded by Joseph Hepworth. The company has around 700 stores in UK. In the year 2018 it is 500 stores in circa.
It is one of the largest clothing retailer by sales in UK. It is listed in the London Stock Exchange. Its revenue for the year 2018 is $4,055.5 million (Next Plc, 2018). In the year 2018 there were 43,970 employees all across the world. The company has good financial growth as compare to other competitors like Marks and Spencer, John Lewis Partnership and etc.
Critically Assess and Evaluate the Theoretical Basis of Finance
In concern of Next PLC, it is determined that in order to evaluate the company’s financial strength, it is important to calculate its ratios in the manner of ratio analysis that is the quantitative method of achieving insight within the liquidity of the company, its operational efficiency as well as profitability through comparing the important information that is contained by the organization’s financial statements (Flannery, 2016).
In a similar manner, the ratio analysis of any company includes different kinds of ratios such as liquidity ratio, debt ratio, profitability ratio, market ratio, and the activity ratios, etc. which are essential to analyze the company’s financial strength in an effective manner.
In a similar manner, for Next Plc, the liquidity ratios, profitability ratio, debt ratio, etc are mainly included so that its financial strength in comparison to market leader i.e. Marks and Spencer Group Plc can be examined more efficiently. In this, the theoretical basis of finance of the company is mentioned below:
| Liquidity Ratio | Next Plc | M & S Group | |
| 1. | Working capital | ||
| Current Assets – Current Liabilities | $882,700 | $1,135,300 | |
| Current Assets | 1797500 | 1,317,900 | |
| Current Liabilities | 914800 | 182,600 | |
| 2. | Current ratio | ||
| Current Assets/Current Liabilities | 1.96 | 0.72 | |
| Current Assets | 1797500 | 1,317,900 | |
| Current Liabilities | 914800 | 1,826,000 |
Liquidity ratios are the ratios which are defined the company’s liquidity in concern of its liabilities. It means how much the company is efficient in order to pay off its expenses or liabilities in an effective manner.
- Working Capital
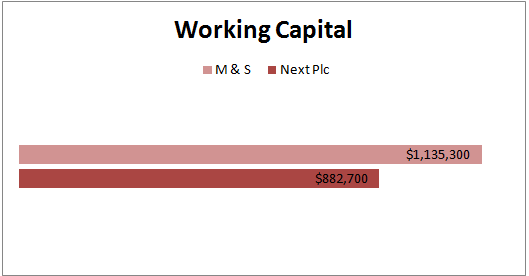
In respect of Next Plc, it is found out that the company has $ 882,700 working capital that is less in comparison to Marks and Spencer Group Plc that has its working capital $1,135,300. In this way, Next Plc is less liquidity to pay off its liabilities. In this way, the company has low current assets in against its current liabilities (Next Plc, 2018).
- Current Ratio
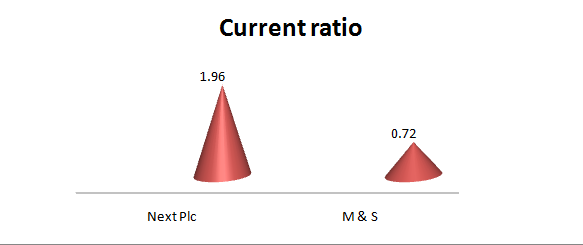
With the help of current ratio, it is determined how much company is capable to pay its short-term obligations. Similarly, while calculating the current ratio of Next Plc, it is analyzed that Next Plc has high current ratio i.e. 1.96 in comparison to Marks and Spencer Group Plc which has 0.72 current ratio (Marks and Spencer, 2018). It means Next Plc is more efficient to pay its short-term liabilities because it has more current assets in against of its liabilities (Next Plc, 2018).
Efficiency Ratio of Next Plc:
| Next Plc | M & S | ||
| 1. | Inventory turnover | ||
| Cost of sales /Inventory | 5.72 | 8.64 | |
| Cost of sales | 2,668,600 | 6,745,600 | |
| Inventory | 466,700 | 781000 | |
| 2. | Account receivable turnover | ||
| S/Avg. account receivable | 3.54 | 73.88 | |
| Sales | 4,090,700 | 10,698,200 | |
| Average Account Receivable | 1154000 | 144800 | |
| 3. | Accounts payables turnover | ||
| Purchases/Avg. account payable | 15.85 | 7.73 | |
| Purchases | 2,668,600 | 6,745,600 | |
| Avg. account payable | 168400 | 872900 |
In respect of the efficiency ratio, it is used to measure how efficiently a company uses its all the assets as well as liabilities internally.
- Inventory turnover
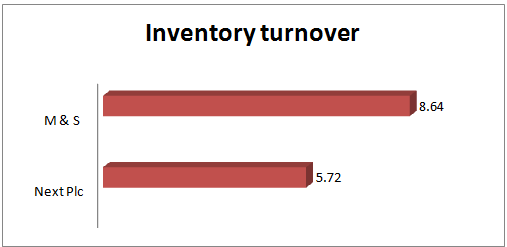
In concern of the inventory turnover ratio, it is the ratio that shows how many times a business has sold as well as replaced the inventory while a given period. In respect of Next Plc, it is found out that company has 5.72 times inventory turnover that is less in comparison to M & S Group Plc which has its turnover 8.64 times in a year that means Next Plc sells its inventory in more time (Marks and Spencer, 2018).
- Account receivable turnover
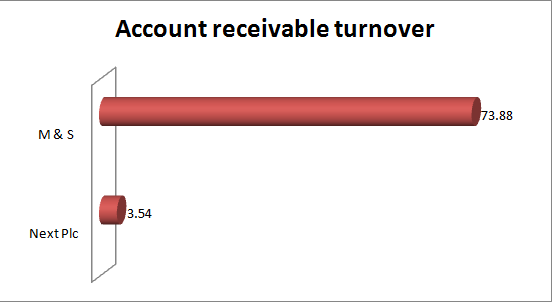
In the context of account receivable turnover, it is mentioned that it is the number of times per year which an organization collects its average accounts receivable. In this manner, for the Next Plc, the account receivable turnover is 3.54 times that means the company has less turnover which is not good for the company (Next Plc, 2018). At the same time, M & S Group has high account receivable turnover i.e. 73.88 times (Marks and Spencer, 2018). It means M & S Group is more efficient to collect its sales amount form its debtors.
- Accounts Payables Turnover
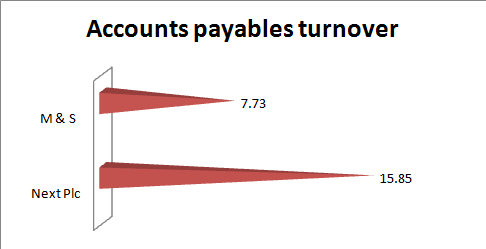
Account payable turnover also works on the rule of account receivable turnover but there is a difference. In account receivable turnover, the focus area is the company’s receivable but in case of account payable turnover, the focus is the company’s creditors. In this manner, the account payable turnover of Next Plc is 15.85times whereas the turnover of M & S Group is 7.73 times (Marks and Spencer, 2018). It means Next Plc does not pay off its obligations very frequently while M & S Group Plc pays its liabilities more efficiently.
Profitability Ratio of Next Plc:
| Profitability ratio | Next Plc | M & S Group |
| Gross profit margin | ||
| Gross profit / Net sales | 34.76% | 36.95% |
| Gross profit | 1,422,100 | 3,952,600 |
| Net Sales | 4,090,700 | 10,698,200 |
| Operating profit margin | ||
| Operating profit / Net sales | 18.58% | 6.33% |
| Operating profit | 760,000 | 677400 |
| Net Sales | 4,090,700 | 10,698,200 |
A profitability ratio is the category of the financial matrix which is used to evaluate the company’s ability in order to generate the earnings-related to its revenue, operating costs, balance sheet assets as well as shareholder’s equity over the time by using the data from a particular point in time.
- Gross Profit Margin
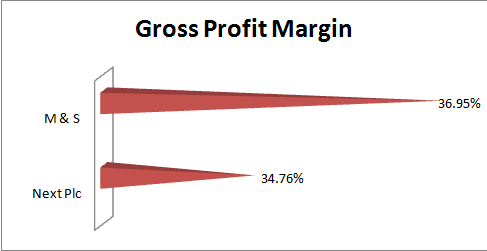
This ratio is beneficial to assess the company’s financial health as well as the business model by revealing the amount of money that is leftover from the sales after deducting the COGS. While comparing Next Plc with the M & S Group, it is examined that Next Plc has less gross profit margin as the company has 34.76% gross profit whereas M & S Group has around 36.95% gross profit (Next Plc, 2018). On the basis of this, it can be mentioned that Next Plc needs to enhance its profitability.
- Operating Profit Margin
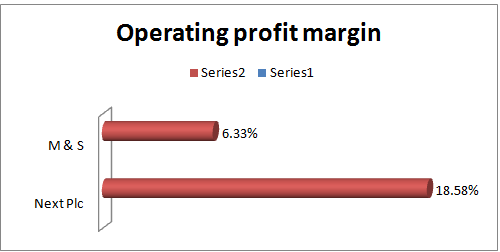
It is the measure of profitability that indicates that how much of each dollar of the revenues is remaining over after both the COGS and the operating expenses are also included in it. In concern of the Next Plc, the company has a high operating profit margin as it has 18.58% operating profit whereas M & S Group Plc has low operating profit margin i.e. 6.33% profit only (Marks and Spencer, 2018). It means the company has effective operating profitability.
Critically analyze the financial data, by the integration of theory and practice investigate and apply relevant tools to the assessment of a variety of organizational problems
From the above analysis of ratio, different risks and opportunities has been identified of Next Plc and its competitor Marks and Spencer. In terms of Working capital it can be seen that Next Plc working capital is low as compare to Marks and Spencer working capital.
This depicts that the risk is high and opportunity is low for Next plc. In terms of Marks and Spencer risk is low and opportunity is high as it can expand its business in more productive products. The high working capital of Marks and Spencer is the positive sign for its company.
In terms of current ratio of Next Plc is greater than 1.0 so this indicates it has enough current assets to settle its current liabilities (Churet and Eccles, 2014). This means the risk is low and opportunity is high for the company’s welfare. It got the opportunity as the creditors are willing to extend credit whoever shows that they have their own resources to pay.
On the other hand, Marks and Spencer current ratio is not greater than 1.0 so it does not have enough current assets to settle down the current liabilities (Marks and Spencer, 2018). It means it can face risk as it might not settle its current liabilities and another company can overtake its company.
Moreover, Next Plc has another opportunity such as new market expansion due to high current ratio. The company has enough current assets that it can pay the current liabilities as compare to Marks and Spencer. It has also been determined that Next Plc operating profit for the year 2017 was 353.3 and it decreased to 268.7 in the year 2018.
This shows risk for the company and due to this less opportunity is there (Cheng et al., 2014). The risk faced by Next Plc can be minimized if it invests in the things that provide growth and opportunity for the company. With the help of growth opportunities it can easily get the work done.
As it can be seen that the company is facing certain risk thus these risks can be managed through the theory i.e. modern portfolio theory. This theory is on how investors of risk can construct portfolio to increase the expected return on the basis of given level of risk in the market. On the basis of this theory there is possibility to construct efficient frontier that is offering expected return at the level of risk.
This theory was developed by Harry Markowitz in the year 1952. Moreover, this theory states that return on investment as well as return characteristics should not be viewed but there should be evaluation on how there is affect of investment on overall risk and return portfolio (Next Plc, 2018) . It shows multiple assets can be constructed to increase the return to the given level of risk. With the help of modern portfolio risk the investors can manage the risk in the market.
At the same time, risk or uncertainty can be managed on the daily basis by analyzing how profit and sales can be attained as well as operations of business become more effective and efficient. The budgets of annual and seasonal in terms of long-term objectives as cash flow forecast can be produced (Brealey et al., 2012).
Systematically evaluate and synthesize the problem-solving mechanisms in relation to financial decision making, utilizing the application of relevant tools and techniques
From the above analysis of financial statement of both Next Plc and Marks and Spencer the investors can be given suggestions as in which company it could invest and could get benefit. On the basis of analysis it can depicted that Next Plc is one of the largest fashion retailer company that has strong financial growth in the market.
So, it can be suggested to investor to invest in this company. It can been seen that its current ratio is greater than 1.0 in the year 2018 this depicts that it has enough current liabilities as compare to Marks and Spencer. Next Plc has done the good job in terms of shareholder in the last decade as there is increase in the sale of company, earnings as well as dividend consistently with the recession (Blackburn, 2012).
In addition, it has also increased its growth sales in regard to earnings and dividend. Its gross profit margin is good as compare to Marks and Spencer. It has also been determined that it should make more improvement in the company’s financial statement by regular reviewing it in an effective manner.
In addition, various other suggestions can be given to the company in order to make more improvement in the financial statement. It should recover outstanding debt by managing the debt and settling down how long debtors have to make settlement of debt.
The expenses can be minimized and rearranged as the company can keep periodic payment plan for the larger expenses. It can also switch to the insurance companies to get the better deal. Next Plc can be suggested to adopt marketing techniques in order to manage the financial statement in an effective manner. It can also opt for additional payment option. It should also keep up track for cash flow on the monthly basis.
It should also lower the expenses by finding the cheaper alternatives for supplies, services and equipments. It can also sell unwanted assets. The debt can also be consolidated in order to improve the business finances. The price can also be kept lower to improve the financial position of the company.
The marketing can be improved through social media it can remain updated so that it can take information of other companies and manage its financial position accordingly. The budget is monitored as well as implemented in order to improve the finance (Aebi et al., 2012).
The budget is need to be revised for the business growth. For measuring the performance of business the business benchmark can be used against the competitors for understanding the financial position of the company. It can also be recommended to manage the lifestyle inflation. The ability should be to build wealth in an effective manner. It should be active and there can be reinvestment of earnings that would be great value to the investment.
The company can also take into consideration problem solving mechanism by considering seven steps such as issue identification, understanding interest of all, list the possible solutions, evaluate options, agreements documentation, and agree on contingencies, evaluation as well as monitoring (Roca & Searcy, 2012). These steps can be taken into consideration by the company so the risk can be solved in an effective manner.
On the basis of the above measurements, it can be mentioned that if the overall financial performance of Next Plc is considered, then it is determined that company has good financial strength as compared to M & S Group Plc within the fashion industry in the UK. In a similar manner, it can also be reflected that company has a number of opportunities over the risk as its financial strength is good that is why it has the capability to deal any kind of critical situation in concern of the finance.
Aebi, V., Sabato, G., & Schmid, M. (2012). Risk management, corporate governance, and bank performance in the financial crisis. Journal of Banking & Finance, 36(12), 3213-3226.
Blackburn, W. R. (2012). The sustainability handbook: The complete management guide to achieving social, economic and environmental responsibility. UK: Routledge.
Brealey, R. A., Myers, S. C., Allen, F., & Mohanty, P. (2012). Principles of corporate finance. Tata McGraw-Hill Education.
Cheng, M., Green, W., Conradie, P., Konishi, N., & Romi, A. (2014). The international integrated reporting framework: key issues and future research opportunities. Journal of International Financial Management & Accounting, 25(1), 90-119.
Churet, C., and Eccles, R. G. (2014). Integrated reporting, quality of management, and financial performance. Journal of Applied Corporate Finance, 26(1), 56-64.
Flannery, M. J. (2016). Stabilizing large financial institutions with contingent capital certificates. Quarterly Journal of Finance, 6(02), 1650006.
Marks and Spencer (2018) Annual Report 2018 [Online]. Available at: http://www.annualreports.com/HostedData/AnnualReports/PDF/OTC_MAKSF_2018.pdf (Accessed: 25th July, 2019)
Next Plc (2018) Annual report 2018 [Online]. Available at: https://www.nextplc.co.uk/~/media/Files/N/Next-PLC-V2/documents/reports-and-presentations/2018/Final%20website%20PDF.pdf (Accessed: 25th July, 2019)
Next Plc (2018) About us. [Online]. Available at: https://www.nextplc.co.uk/about-next/our-history (Accessed: 25th July, 2019)
Roca, L. C., & Searcy, C. (2012). An analysis of indicators disclosed in corporate sustainability reports. Journal of Cleaner Production, 20(1), 103-118.

This web site certainly has all of the information I wanted concerning this subject and didn’t know who to ask.
https://bf.wpcookie.pro