
FINANCIAL DECISION MAKING ROAST LTD
Executive Summary
Roast Ltd. which is an independent coffee house chain situated in the United Kingdom is the main focus in this report. Starbucks UK is a well established coffee company and looking to acquire new and small companies in order to expand its business. Based on this reason the CFO of Starbucks has requested to make a review of the financial report of Roast Ltd. Therefore, the financial report of Roast Ltd. for the years 2017 and 2018 has been analysed and a final reviewed report has been provided. It has also been found that Roast Ltd. expanded its business to Romania in the year 2017 and before the expansion process the management had formed a forecast for the next five years. Thus, its investment appraisal has been critically analysed in this report. Moreover, the company had a further expansion plan to Italy but Roast Ltd. needed a proper source of funding, so a discussion has been formed regarding sources of finance.

Coffee is a delicate hot drink loved by the whole world and it is widely famous in the United Kingdom. The world of business has adopted this lovable and energetic drink as a medium for making revenue. According to the survey of Assfaw (2018, p.25), approximately 37.74% of the UK’s population drinks coffee 1-2 times in a single day, not only that 12.83% of people even take 3 times a day. Clearly, it proves coffee consumption addiction in the UK with having such an intense number of populations that consumes coffee in a day.
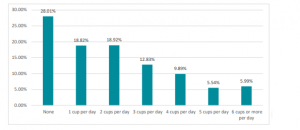
Figure 1: Coffee consumption in UK
(Source: Chou, 2019)
Therefore, several coffee industries are enhancing its coffee shops in the UK as well as expanding in the whole world. Costa Coffee, Starbucks and Caffe Nero are the three leading coffee house companies in the UK. It has been founded through the survey of Chou (2019, p.4166), the number of outlets of Costa is 2655, the number of stores of Starbucks is 992 and this number is 683 for Caffe Nero. It is indeed a high number of outlets and stores having a growth rate of 7.9% – 8.1%. This expansion is possible because of the high amount of profit that generates from selling quality coffee.
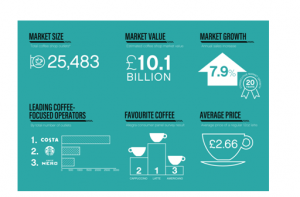
Figure 2: Top coffee industries in UK
(Source: Chou, 2019)
As per the view of Samper and Quiñones-Ruiz, (2017, p.17), there are several challenges that are now commonly faced by big brands such as Costa, Nero and Starbucks. It can be seen that a large number of coffee beans produced in Brazil and the economy of the country is highly dependable on the production of coffee beans. As per the view of Adam, Syahputra and Gunawan (2016, p.14), the climate is changing and global warming is steadily taking place, so it is impacting production as well. Apart from that, with passing time production costs are rising, as a result, big brands are also raising their coffee products. According to Aklimawati, Soemarno and Mawardi (2016, p.140), small companies are also taking place in the competitive market and selling coffees at a low price thus, it is causing problems for big coffee brands.
2. Business Performance analyses
As per the view of Bekaert and Hodrick (2017, p.19), it can be seen that there is already a massive number of coffee industries leading the coffee industry but there exist such small companies that are making profits from the market as well. Roast Ltd. is listed in such small companies that are growing in this highly intense competitive market. It is causing attraction towards small companies and it becoming a necessity to look at the financial performance of such companies. As per the view of Berry (2017, p.18), a big company can acquire small companies if it founded that the performance from the perspectives of liquidity, profitability and efficiency is good.
2.1. Statement of Profit or Loss
Roast Ltd. is one of good profit making, small and independent coffee house chains in the United Kingdom. As per the view of Cristea, Mitan and Zbuchea (2018, p.100), analysing its profit and loss account will help to understand its profit percentage from its earned revenue. Moreover, analysing the data of two years’ details will help to find out the growth rate of the company. Therefore, it can be seen that Roast Ltd. had made £2022000 of sales in 2017 and the sales increased to £2534000 at the end of 2018. It is clear that for a small coffee company it is a high volume of sales. Roast Ltd. had direct costs during the year 2017 of £1505000 and in the year 2018, the amount of cost was £1990000. Thus, the costs were increased as well with the increase of revenue amount; as a result, the gross profit was £517000 in 2017 and £544000 in 2018. Therefore, the rate of increase in the gross profit in the year 2018 was 5% and in order to analyse the gross profit amount further, ratio analysis has been conducted. It has been founded from the ratio analysis of gross profit that the GP margin in the year 2017 was 26% and in the year 2018, it was 21%.
Apart from the direct expenses, there are several operational expenses and that is required to be analysed. Roast Ltd. had several common operational expenses in 2017 and 2018 but the amounts in those sectors had been changed. The company had employee and directors remuneration of total £621700 in 2017 and £262800 in 2018, so the expenses in this sector were reduced. Apart from that, the utility cost was £26200 in 2017 that was reduced as well in 2018 while having a utility cost of £22800 during the year. A massive reduction in the cost of legal and professional fees has been observed in the year 2018, as it was £28700 in 2017 and became £3600 in 2018. However, expenses in the sector of selling and distribution overhead were increased, as the expenses under this head were £63200 in 2017 whereas it was £148200 in 2018. The total operating expenses in 2017 were £466000 and with little growth, the total operating expenses in 2018 were £477000. It can be noticed in the profit and loss account of Roast Ltd. that the company had an operating income in the year 2018 of £60000. Thus, it can be said that several changes had been conducted in operational activities by the company in the year 2018. The operating profit gained by Roast Ltd. in the year 2018 was £127000 while in the previous year the amount was £51000. Therefore, the growth rate of operating profit in 2018 is 150% approximately and a detailed comparison has been made through ratio analysis. The operating profit margin in the year 2018 was 5% while in the previous year the percentage was 3%, thus Roast Ltd. had managed to obtain a growth in the operating profit margin by 2%.
According to Cuong and Toan (2016, p.29), deduction of interest and the tax amount is required to get the net profit of the business. Therefore, Roast Ltd. had a total interest and tax of £15000 in the year 2017 whereas it became £46000 during the year 2018. The net profit, after adjusting interest and tax from operating profit, became £81000 in 2018 and the net profit in the previous year was £36000. Hence, the growth rate of net profit in the year 2018 is 125% and a ratio analysis regarding net profit has been calculated to analyse the details further. Thus, the NP margin was 3% at the end of the year 2018 whereas it was 2% in the previous year, so the growth of 1% in NP margin is observable.
| Particulars | 2018 |
| Revenue | 2,534.00 |
| Gross Profit | 544.00 |
| Gross profit ratio | 21% |
| Revenue | 2,534.00 |
| Operating Profit | 127.00 |
| Operating Profit ratio | 5% |
| Revenue | 2,534.00 |
| Net Profit After Interest and Tax | 81.00 |
| Net Profit ratio | 3% |
Table 1: Profitability Ratios in 2018
(Source: created by learner)
| Particulars | 2017 |
| Revenue | 2,022.00 |
| Gross Profit | 517.00 |
| Gross profit ratio | 26% |
| Revenue | 2,022.00 |
| Operating Profit | 51.00 |
| Operating Profit ratio | 3% |
| Revenue | 2,022.00 |
| Net Profit After Interest and Tax | 36.00 |
| Net Profit ratio | 2% |
Table 2: Profitability Ratios in 2017
(Source: created by learner)
2.2. Statement of Financial Position
Roast Ltd. is a small and independent coffee company in the UK but even as a small company a high volume worth is noticeable in the balance sheet statement of Roast Ltd. As per the view of Dierberger, McIntosh and Johnson (2016, p.93), this statement holds the details of working assets and liabilities of a company, so by analysing this statement an overview of financial liquidity and stability can be obtained. The current assets of the company are included with inventories, Debtors balance and cash balance. The total value of inventory was £299000 in 2018 and in the previous year, the volume was £120000. The balance of debtors’ dues was £148000 in 20018 and the balance was £93000 in the previous year. A bank overdraft balance is observable in the year 2018 of £73000 whereas in the previous year a positive cash balance of £134000 was present in the balance sheet statement. Apart from that, the company had dues to creditors of £235000 in 2018 while the balance was £138000 in the previous year. Hence, the total current assets were £447000 in 2018 while in the previous year it was £347000. Similarly, the total current liabilities were £308000 in 2018 while in the previous year it was £138000.
As per the view of Douglas et al. (2019, p.220), the current ratio is a popularly used liquidity ratio which utilises total current assets and current liabilities into the calculation. Hence, the current ratio of Roast Ltd. in 2018 was 1.45:1 while in the previous year the ratio proportion was 2.51:1. Acid test ratio is another liquid ratio which is a precise form of current ratio and it does not consider inventory value in its calculation. Hence, the acid test ratio of Roast Ltd. in the year 2018 was 0.48:1 while the ratio proportion was 1.64:1 in the year 2017.
Roast Ltd. had non-current liabilities which is long-term borrowings of £100000 in the year 2017 and during the year 2018 the company increased its borrowings by £175000. Hence, the total debt of Roast Ltd. was (£583000 + £275000) = £583000 in the year 2018 while the amount was (£100000 + £138000) = £238000 in the previous year. Apart from that, a total equity of £860000 and £779000 were observed in 2018 and 2017 respectively. It includes retained earnings of £660000 in 2018 and £579000 in 2017 and the share capital of £200000 in both years.
As per the view of Duicela-Guambi et al. (2019, p.245), the D/E ratio is a popularly used gearing ratio and it is used to measure the leverage power of capital structure. The process of calculating this ratio utilizes total liability or debt and total equity. Hence, the D/E ratio is 68% for the year 2018 while the percentage was 31% in the previous year. Capital gearing ratio is another broadly used gearing ratio and it can be seen that the capital gearing ratio was 40% in 2018 but in the previous year it was 23%. Apart from the ratio analysis, it can be seen that the company had total assets valued £1443000 in 2018 and £1017000 in the previous year.
| Particulars | 2018 |
| Current Assets | 447.00 |
| Current Liabilities | 308.00 |
| Current Ratio | 1.45 |
| Current Assets | 447.00 |
| Inventory | 299.00 |
| Current Assets less Inventory | 148.00 |
| Current Liabilities | 308.00 |
| Acid Test Ratio | 0.48 |
Table 3: Liquidity Ratios in 2018
(Source: created by learner)
| Particulars | 2017 |
| Current Assets | 347.00 |
| Current Liabilities | 138.00 |
| Current Ratio | 2.51 |
| Current Assets | 347.00 |
| Inventory | 120.00 |
| Current Assets less Inventory | 227.00 |
| Current Liabilities | 138.00 |
| Acid Test Ratio | 1.64 |
Table 4: Liquidity Ratios in 2017
(Source: created by learner)
| Particulars | 2018 |
| Total Debt | 583.00 |
| Total Equity | 860.00 |
| Total Debt and Equity | 1,443.00 |
| Capital Gearing | 40% |
| Total Debt | 583.00 |
| Total Equity | 860.00 |
| Debt/Equity Ratio | 68% |
Table 5: Gearing Ratios in 2018
(Source: created by learner)
| Particulars | 2017 |
| Total Debt | 238.00 |
| Total Equity | 779.00 |
| Total Debt and Equity | 1,017.00 |
| Capital Gearing | 23% |
| Total Debt | 238.00 |
| Total Equity | 779.00 |
| Debt/Equity Ratio | 31% |
Table 6: Gearing Ratios in 2017
(Source: created by learner)
Roast Ltd. is a small company thus it is expected to have a small transaction amount during the year (Grant, 2019, p.24). However, it was also noticeable that the company had a plan of expanding the business to Romania and so the company had taken several bold transactions. According to Ferreira and Ferreira (2020, p.79), a cash flow statement is the reflection of a cash transaction that takes place in an organization during one fiscal year. Roast Ltd. had an opening cash balance of £134000 in the year 2018 and at the end of the financial year, the cash balance had been turned into bank overdraft balance. One big reason behind this type of situation was that the company had been invested in a new property, equipment and plants and the invested amount was £358000. Moreover, they had an excessive interest and tax amount rather than the usual amount, expenses of interest was £26000 and the company had paid a tax of £20000. Roast Ltd. increased its stock balance by £179000 and it had reduced the cash balance as well. However, during the year the company had taken long-term borrowings because of which bank overdraft balance was slightly reduced by £175000. Although, at the end of the financial year 2018 Rost Ltd. had a bank overdraft balance of £73000.
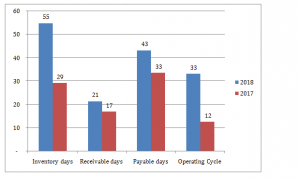
As per the requirement of the report, an operating cash cycle has been calculated and the main focusing point is the changes in the period between 2017 and 2018. The inventory periods have been calculated by utilising the data of inventory and direct costs for the year 2018 and 2017. Hence, Roast Ltd. had 55 inventory days in 2018 while in the previous year it was 29 days. According to Haight (2016, p370), the receivable days have been calculated on collected information of debtors dues and total revenue for the year 2018 and 2017. Hence, Roast Ltd. had 21 receivable days while it was 17 days in the previous year. According to Hartatri, Aklimawati and Neilson (2019, p.145), the payable days have been calculated on the basis of creditors balance and direct costs. Therefore, Roast Ltd. had 43 payable days in the year 2018 while in the previous year it was 33 days. According to Higdon (2016, p.27), the process of calculating the operating cycle is to add inventory period with receivable period and subtracting the period with the payable period. Hence, the operating cash cycle period was 33 days at the end of 2018 while it was 12 days in the previous year.
Regarding the dividend policy of Roast Ltd., it can be said that the company had paid £30000 in 2017. However, it has appeared that Roast Ltd. had a shortage of cash balance during the year 2018. Thus, Roast Ltd. had no other option rather than avoiding the payment of dividend.
| Particulars | 2018 |
| Inventory | 299.00 |
| Cost of Sales | 1,990.00 |
| Inventory days | 55 |
| Trade receivables | 148.00 |
| Revenue | 2,534.00 |
| Receivable days | 21 |
| Trade payables | 235.00 |
| Cost of Sales | 1,990.00 |
| Payable days | 43 |
| Inventory days | 55 |
| Receivable days | 21 |
| Payable days | 43 |
| Operating Cycle | 33 |
Table 7: Operating Cash Cycle in 2018
(Source: created by learner)
| Particulars | 2017 |
| Inventory | 120.00 |
| Cost of Sales | 1,505.00 |
| Inventory days | 29 |
| Trade receivables | 93.00 |
| Revenue | 2,022.00 |
| Receivable days | 17 |
| Trade payables | 138.00 |
| Cost of Sales | 1,505.00 |
| Payable days | 33 |
| Inventory days | 29 |
| Receivable days | 17 |
| Payable days | 33 |
| Operating Cycle | 12 |
Table 8: Operating Cash Cycle in 2017
(Source: created by learner)
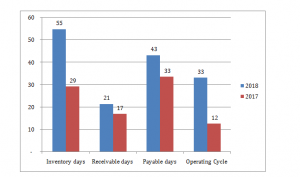
Graph 1: Operating Cash Cycle
(Source: created by learner)
3. Investment Appraisal and Sources of Finance
According to Karyani et al. (2019, p.57), it is a way of judging the attractiveness of investment so, it can be said that it is a good decision making tool Roast Ltd. decided to make an investment in a new country and it can be a good opportunity to step ahead of becoming a global brand. Therefore the review of investment appraisal of Roast Ltd is as follows:
Forecasting is an essential step before placing an investment in to live, so management needs to acquire realistic assumptions to build an effective forecast. The management of Roast Ltd. was planning to start their business in Romania and hence it was required by them to make proper assumptions on the initial investment, possible income from the investment per year and possible expenses. Roast Ltd. made a forecasted plan in the year 2016 and they had decided to make an investment of £500000 initially. This investment was necessary to acquire new equipment, plants and other fixed assets. Roast Ltd. assumed that in the initial period the company may not be able to gain sufficient revenue but eventually, the company will be able to make high revenue from the investment. The company had forecasted the next five years’ possible revenues and costs, by deducting the costs from the revenue the contribution can be ascertained. Therefore, the expected revenues of Roast Ltd. were £300000, £560000, £740000, £900000 and £1120000. The expected variable costs for the five years were expected to be £240000, £448000, £592000, £720000 and £896000. Hence the adjusted expected contributions for the following periods were £60000, £112000, £148000, £180000 and £224000.
3.1.2. Investment appraisal Techniques
3.1.2.1. Payback Period
This calculation ascertains the time that will be taken to collect the invested amount from an investment. As per the view of Rana, K’Aol and Kirubi (2019, p.19), the need for calculating PBP is to find out the time that is going to take to cover the investment in Romania from the cash outflows of every year. It has been calculated on the basis of investment forecast of Roast Ltd. Therefore, the CCF at the beginning of the first year was -£500000. The CCF became zero at the end of the fourth year, so, it can be said that the PBP of this investment is 4 years.
| Year | Cash Flow | Cum CF |
| 0 | (500) | (500) |
| 1 | 60 | (440) |
| 2 | 112 | (328) |
| 3 | 148 | (180) |
| 4 | 180 | – |
| 5 | 224 | 224 |
| PBP | 4 Years | |
Table 9: PBP calculation
(Source: created by learner)
3.1.2.2. Accounting Rate of Return
This calculation also has been conducted on the basis of forecasted cash flows and initial investment. As per the view of Regmi (2018, p.45), the reason for calculating ARR is to find out the return rate from the investment. Based on the calculation it can be seen that the ARR is approximately 18% and the expectation of Roast Ltd. from the investment is 10%.
3.1.2.3. Net Present Value
This calculation has been conducted on the basis of the discounting factor of 5% and forecasted cash flows and initial investment has been taken in this calculation. According to Paseto, de Alcantara and Patino (2018, p.37), the reason for calculating NPV is to find out the profit from the investment on today’s currency value basis. Therefore, present values of cash inflows are £57000, £102000, £128000, £148000 and 176000, so the NPV is £500000 – £610000 = £110000.
| Year | Net Cash Flow | DCF (5%) | PV |
| 0 | (500) | 1.000 | (500) |
| 1 | 60 | 0.952 | 57 |
| 2 | 112 | 0.907 | 102 |
| 3 | 148 | 0.864 | 128 |
| 4 | 180 | 0.823 | 148 |
| 5 | 224 | 0.784 | 176 |
| NPV | 110 | ||
Table 10: NPV calculation
(Source: created by learner)
According to Mbowa, Nkandu and Nakazi (2017, p.29), financing a company requires for several reasons such as for maintaining working capital, to arrange fixed assets or for expansion of the existing business. There are several sources as well to finance the company and it is mainly divided into two major sources namely, internal source of funds and external source of fund (Mulugeta, 2018, p.19). A company can arrange funds through its retained earnings, from an introduction of owners and by selling fixed assets and stocks. However, it has its limitation that these sources cannot provide a high amount of funds which often requires for expansion of a business. Roast Ltd. has a plan of expanding the business to Italy and hence the company requires an investment of total £400000. As per the view of Tognetti and Nguyet Nguyen (2018, p.19), external sources of funds are the option available to the company to fund the investment. The external financing sources are as follows:
Alternative plan A – Equity Financing
According to Suhardi et al. (2019, p.10), it allows a company to arrange funds by issuing equity share capital or preference share capital. It is a good source of arranging long term and a high amount of money so Roast Ltd. can arrange its required fund from this source. There are few benefits and drawbacks exist of collecting fund through equity financing which is discussed below:
| Benefits | Drawbacks |
| ● It has no burden of paying interest at a high rate, which banks often charge for providing a loan.
● There is no strict rule of paying the dividend, so the company can avoid dividend payment while there is a lack of cash balance. ● There is no necessity of repaying the collected amount, which is required to pay in case of Debt financing. |
● Equity financing has a risk of losing control over company ownership and risk increases with the increase of the number of share capital issued in the market.
● Small businesses struggle to collect money by issuing share capital in the market. ● The company has to pay its profit portion to its shareholders, so it reduces the optimum net profit. |
Alternative plan B – Debt Financing
As per the view of Smith (2017, p.15), banks and financial institutions provide bank loans and a company can borrow the fund in terms of achieving their needs. Apart from that, issuing bonds and debenture is also considered as debt financing. Roast Ltd. can arrange £400000 through long term borrowings but first, it is required to know its benefits and drawbacks, which are as follows:
| Benefits | Drawbacks |
| ● Tax calculation conducted after deduction of interest, thus debt financing causes tax benefits.
● There are no obligations and rights in overlapping ownership and there is no further relation with the lender after repayment of debt. ● It is easy to collect and small and medium-sized businesses can easily get the benefit of debt financing. |
● There is a requirement of paying interest and principal amount after a specific period of time.
● Several difficulties occur in cash flow management because of making an interest payment on a monthly basis. ● Rate of interest can be high and in case of debt financing, a company has to pay its dues whether the company has sufficient cash balance or not. |
It can be seen that the company has an average D/E ratio but also lacking in a positive cash balance (Sengere, Curry and Koczberski, 2019, p.225). Therefore, it can be said that Roast Ltd needs to utilize both debt financing and equity financing to arrange £400000.
It can be concluded that Roast Ltd. had maintained good performance in its profit and loss statement. Roast Ltd. had a growth in operating profit margin as well as in net profit margin so it can be concluded that the profitability condition was good in 2018. Based on the analysis of the balance sheet statement a good condition in the liquidity ratio is also observed. However, a poor condition in the cash balance causes having a bank overdraft balance at the end of 2018. Although, the good margin of profit Roast Ltd. will able to write off the bank overdraft balance in income in the financial year. Therefore, it can be said that the acquisition of Roast Ltd can be profitable for Starbucks UK.
Adam, M., Syahputra, H. and Gunawan, B., 2016, March. Industry Attractiveness and Knowledge Management on the Formulation of Competitive Strategy and Parternership and Its Implication on Coffee Company Performace in Aceh. In 3rd International Seminar and Conference on Learning Organization. Atlantis Press.
Aklimawati, L., Soemarno, D. and Mawardi, S., 2016. Factors Affecting Micro and Small-Scale Industries Income: A Case Study on Coffee Processing Industry. Pelita Perkebunan (a Coffee and Cocoa Research Journal), 32(2), pp.138-148.
Assfaw, A.M., 2018. Evaluation of the Financial Growth and Performance of Tepi Coffee Producer Farmers Cooperatives Union, Sheka Zone, South West Ethiopia. Global Journal of Management And Business Research.
Bekaert, G. and Hodrick, R., 2017. International financial management. Cambridge University Press.
Berry, B., 2017. Sharing fixed costs in a single establishment: combining a brewpub and coffee house (Doctoral dissertation).
Chou, Y.C., Kuo, C.J., Chen, T.T., Horng, G.J., Pai, M.Y., Wu, M.E., Lin, Y.C., Hung, M.H., Su, W.T., Chen, Y.C. and Wang, D.C., 2019. Deep-learning-based defective bean inspection with GAN-structured automated labeled data augmentation in coffee industry. Applied Sciences, 9(19), p.4166.
Cristea, G., Mitan, A. and Zbuchea, A., 2018. Branding Successful Start-ups: Insights from the Romanian Coffee Shop Industry. COCREATING RESPONSIBLE FUTURES IN THE DIGITAL AGE: Exploring new paths towards economic, p.100.
Cuong, D.X. and Toan, N.Q., 2016. Derivatives as the Price Fluctuation Risk Management for Vietnamese Coffee Exporters.
Dierberger, G., McIntosh, M. and Johnson, N., 2016. Java Plus Coffee: A Case Study in Economic Sustainability in a Non-Profit Organization.
Douglas, J., Douglas, A., Cano, M. and Moyes, D., 2019, September. FACTORIAL STRUCTURE FOR INDEPENDENT COFFEE SHOPS AND CAFES’SUCCESS FACTORS: A UK STUDY. In The 22nd Excellence in Services International Conference (pp. 219-235).
Duicela-Guambi, L.A., Martínez-Soto, M.E., Loor-Solórzano, R.G. and Rodríguez-Monroy, C., 2019. Knowledge management and organizational innovation based on the government-company-academy-producers alliance to reactivate the robusta coffee chain, in ecuador. Proceedings in Food System Dynamics, pp.244-259.
Ferreira, J. and Ferreira, C., 2020. From the grounds up: the coffee shop industry and the circular economy.
Grant, S.G., 2019. Café Creatives Coffee Entrepreneurs in Việt Nam. Education About ASIA, 24(2).
Haight, C.E., 2016. Of Coffee, Cartels and Communism. The Journal of Social, Political, and Economic Studies, 42(3/4), pp.368-389.
Hartatri, D.F.S., Aklimawati, L. and Neilson, J., 2019. Analysis of Specialty Coffee Business Performances: Focus on Management of Farmer Organizations in Indonesia. Pelita Perkebunan (a Coffee and Cocoa Research Journal), 35(2), pp.140-155.
Higdon, B., 2016. Strategies independent coffee shop owners require to survive beyond five years.
Karyani, T., Djuwendah, E., Kusno, K. and Hermita, A.S., 2019, October. Value Chain Financing in Coffee Agribusines (the Case of a Cooperative in Pangalengan, West Java, Indonesia). In IOP Conference Series: Earth and Environmental Science (Vol. 334, No. 1, p. 012057). IOP Publishing.
Mbowa, S., Nkandu, J. and Nakazi, F., 2017. Looming Long-term Economic Effect of Climate Change on Uganda’s Coffee Industry.
Mulugeta, A., 2018. The Determinants of the Export Competitiveness of the Coffee Industry in Ethiopia (Doctoral dissertation, Addis Ababa University).
Mwangi, R.W., Mwenda, L.K.M., Wachira, A.W. and Mburu, D.K., 2017. Effect of Primary Processing Practices Carried out by the Coffee Cooperative Societies on the Sustainability of the Coffee Industry in Kenya.
Nuševa, D., Mijić, K. and Jakšić, D., 2017. The performances of coffee processors and coffee market in the Republic of Serbia. Economics of Agriculture, 64(1), pp.307-322.
Pasa, A.R., Agustania, W.A. and Iqbal, T.M.R., 2020. Towards Smart Coffee Industry: Designing IS/IT Portfolio for Sustainable Coffee Cooperative in Indonesia. Review of Integrative Business and Economics Research, 9, pp.380-389.
Paseto, L., de Alcantara, M.R. and Patino, M.T.O., 2018. Quality and competitiveness of coffee exports: the influence of cooperatives. International Journal of Development Research, 8(09), pp.22835-22841.
Rana, R., K’Aol, G. and Kirubi, M., 2019. Influence of directive and achievement oriented path-goal leadership styles on employee performance of coffee trading companies in Kenya.
Regmi, B., 2018. A STUDY ON FINLAND AS A TARGET MARKET FOR VIETNAMESE COFFEE: The Finnish Coffee Market.
Samper, L.F. and Quiñones-Ruiz, X.F., 2017. Towards a balanced sustainability vision for the coffee industry. Resources, 6(2), p.17.
Sengere, R.W., Curry, G.N. and Koczberski, G., 2019. Forging alliances: Coffee grower and chain leader partnerships to improve productivity and coffee quality in Papua New Guinea. Asia Pacific Viewpoint, 60(2), pp.220-235.
Smith, G.T., 2017. The Impact of Socially Conscious Initiative Announcements on Coffee Company Stock Values.
Suhardi, A.R., Amalia, S., Oktafien, S., Adiyanti, S., Komariah, S. and Rohendra, T., 2019. Time Series Analysis to Predicting Demand of Roasted Coffee Production. International Journal of Financial Research, 10(5).
Tognetti, F. and Nguyet Nguyen, H.T., 2018. Sustainable Business Practices and Customers’ Engagement in the Swedish Coffee Industry: A case study of Löfbergs.
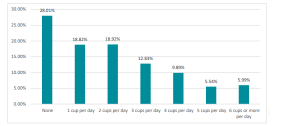
Figure 1: Coffee consumption in UK
(Source: Chou, 2019)
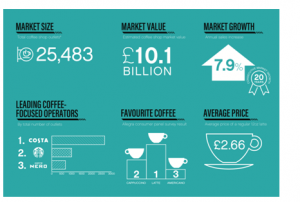
Figure 2: Top coffee industries in UK
(Source: Chou, 2019)
| Revenue | 2,534.00 |
| Gross Profit | 544.00 |
| Gross profit ratio | 21% |
| Revenue | 2,534.00 |
| Operating Profit | 127.00 |
| Operating Profit ratio | 5% |
| Revenue | 2,534.00 |
| Net Profit After Interest and Tax | 81.00 |
| Net Profit ratio | 3% |
Table 1: Profitability Ratios in 2018
(Source: created by learner)
| Particulars | 2017 |
| Revenue | 2,022.00 |
| Gross Profit | 517.00 |
| Gross profit ratio | 26% |
| Revenue | 2,022.00 |
| Operating Profit | 51.00 |
| Operating Profit ratio | 3% |
| Revenue | 2,022.00 |
| Net Profit After Interest and Tax | 36.00 |
| Net Profit ratio | 2% |
Table 2: Profitability Ratios in 2017
(Source: created by learner)
| Particulars | 2018 |
| Current Assets | 447.00 |
| Current Liabilities | 308.00 |
| Current Ratio | 1.45 |
| Current Assets | 447.00 |
| Inventory | 299.00 |
| Current Assets less Inventory | 148.00 |
| Current Liabilities | 308.00 |
| Acid Test Ratio | 0.48 |
Table 3: Liquidity Ratios in 2018
(Source: created by learner)
| Particulars | 2017 |
| Current Assets | 347.00 |
| Current Liabilities | 138.00 |
| Current Ratio | 2.51 |
| Current Assets | 347.00 |
| Inventory | 120.00 |
| Current Assets less Inventory | 227.00 |
| Current Liabilities | 138.00 |
| Acid Test Ratio | 1.64 |
Table 4: Liquidity Ratios in 2017
(Source: created by learner)
| Particulars | 2018 |
| Total Debt | 583.00 |
| Total Equity | 860.00 |
| Total Debt and Equity | 1,443.00 |
| Capital Gearing | 40% |
| Total Debt | 583.00 |
| Total Equity | 860.00 |
| Debt/Equity Ratio | 68% |
Table 5: Gearing Ratios in 2018
(Source: created by learner)
| Particulars | 2017 |
| Total Debt | 238.00 |
| Total Equity | 779.00 |
| Total Debt and Equity | 1,017.00 |
| Capital Gearing | 23% |
| Total Debt | 238.00 |
| Total Equity | 779.00 |
| Debt/Equity Ratio | 31% |
Table 6: Gearing Ratios in 2017
(Source: created by learner)
| Particulars | 2018 |
| Inventory | 299.00 |
| Cost of Sales | 1,990.00 |
| Inventory days | 55 |
| Trade receivables | 148.00 |
| Revenue | 2,534.00 |
| Receivable days | 21 |
| Trade payables | 235.00 |
| Cost of Sales | 1,990.00 |
| Payable days | 43 |
| Inventory days | 55 |
| Receivable days | 21 |
| Payable days | 43 |
| Operating Cycle | 33 |
Table 7: Operating Cash Cycle in 2018
(Source: created by learner)
| Particulars | 2017 |
| Inventory | 120.00 |
| Cost of Sales | 1,505.00 |
| Inventory days | 29 |
| Trade receivables | 93.00 |
| Revenue | 2,022.00 |
| Receivable days | 17 |
| Trade payables | 138.00 |
| Cost of Sales | 1,505.00 |
| Payable days | 33 |
| Inventory days | 29 |
| Receivable days | 17 |
| Payable days | 33 |
| Operating Cycle | 12 |
Table 8: Operating Cash Cycle in 2017
(Source: created by learner)
Graph 1: Operating Cash Cycle
(Source: created by learner)
| Year | Cash Flow | Cum CF |
| 0 | (500) | (500) |
| 1 | 60 | (440) |
| 2 | 112 | (328) |
| 3 | 148 | (180) |
| 4 | 180 | – |
| 5 | 224 | 224 |
| PBP | 4 Years | |
Table 9: PBP calculation
(Source: created by learner)
| Year | Net Cash Flow | DCF (5%) | PV |
| 0 | (500) | 1.000 | (500) |
| 1 | 60 | 0.952 | 57 |
| 2 | 112 | 0.907 | 102 |
| 3 | 148 | 0.864 | 128 |
| 4 | 180 | 0.823 | 148 |
| 5 | 224 | 0.784 | 176 |
| NPV | 110 | ||
Table 10: NPV calculation
(Source: created by learner)
