
Financial Management
1) Presentation of the company:
Vodafone Group Plc is a multinational communication company based on the Britain. It is a public limited company, which headquarter is in London. Typically, it provides mobile network service approx overall world including Asia, Africa, Europe and Oceania. Vodafone is known as the second largest telecommunication company after China Mobile.

The company has more the 435.9 million customers as of 2014. Along with this, Vodafone is fifth largest company according to revenue rank. The name of Vodafone is come from the Voice Data Fone that is selected to solve the customers’ problem regarding the phone and data (Brigham & Ehrhardt, 2013).
- Activity:
- Products and services offered
Vodafone has a wide range of product and services. The List of the Vodafone products and services includes the voice, data, messaging and line solutions and devices to help the customers. The services and products of the Vodafone are totally based on the communication needs of the peoples.
http://www.vodafone.com/content/annualreport/annual_report10/business/products-and-services.html
Major geographical markets covered
Names of current CEO and other key managers (if available).
In the current time, Chief executive officer of Vodafone is Vittorio Colao is since the July 2008. It is forth CEO of the company after Sir Gerald Whent, Sir Christopher Gent and Arun Sarin.
- Brief history of the company.
Vodafone was launched o January 1985 with the new name Racal-Vodafone. On 16 September 1991, it was become Vodafone group. Once again the name of th company has changed and now company become Vodafone group plc. In the current scenario company is known with this name.
- Any recent meaningful development in the company
- Industry:
- Other major players in the industry. Which is your benchmark company?
Three UK
In the same industry, Three UK is also a well known company that is special list in the 3G and 4G mobiles phone plan. It also provides the broad band services plans with dongles and SIM cards or portable WIFI devices.
O2
O2 is also a major player in the telecommunication industry. It provides landline, mobile network and broadband services. Even though. O2 is depended on the various companies and produces.
Virgin
Virgin is also competitor in the telecommunication industry. It provides telecommunication services and broadband services in the telecommunication industry.
- Is the industry very concentrated of fragmented? Explain.
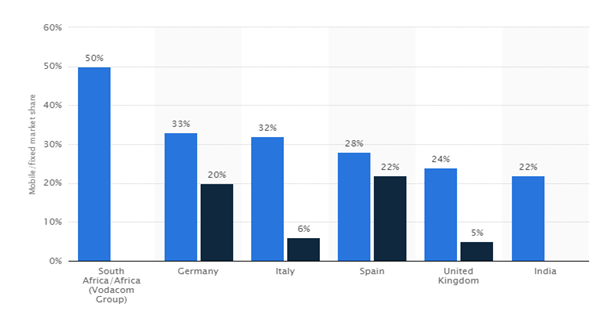
iii. Approximate market share of the company.
The below graph shows that market share of Vodafone in the different market inducing Africa, Germany, Italy, Spain U K and India.
- Major recent changes in the industry (e.g., technology, regulatory environment)
Ratio analysis is a significant technique of measuring the financial performance of the company. It is a kind of quantitative analysis that contains the information and data from the balance sheet, income statement and cash flow statement. It is useful to evaluate the operational and financial efficiency of the organisation.
In the other words, ratio analysis is financial analysis that helps to quick indication of the financial situation of the company in the various areas (Higgins, 2012).
It is most used technique to analyse the financial performance of any organisation. Financial or accounting ratio is helpful for judging the efficiency of the company in the term of the operation efficiency. It is also used to identify the strengths weakness of the company.
By the help of the ratio analysis, management prepares further strategy and plan to run the organisation. Along with this, it is also essential for the organisations to know how well it operation over the years and as compared to the other firms.
Ratio analysis allows users to compare the financial performance of the two companies. The technique of the financial ratio is based on formulas and methods. Typically, the ratio analysis can be divided into some categories such as iquidity, solvency, efficiency, profitability, market prospect, investment leverage, and coverage (Chandra, 2011).
In this,
- Liquidity ratios:
- Current Ratio
- Quick Ratio
| Ratio | Formula | 2016 | 2015 | 2014 | O2 |
| Liquidity ratios | |||||
| Current ratio | (Current Assets/Current Liabilities) | 0.84 | 0.69 | 0.99 | 0.71 |
| Current Assets | 28144 | 19847 | 24722 | 11235 | |
| Current Liabilities | 33395 | 28897 | 25039 | 15801 | |
| Quick ratio | (Quick Assets/Current Liabilities) | 0.74 | 0.66 | 0.94 | 0.67 |
| Quick assets | 24688 | 19065 | 23597 | 10611 | |
| Current Liabilities | 33395 | 28897 | 25039 | 15801 |
- Asset Management ratios:
- Days Sales Outstanding (DSO) (or Average Collection Period)
- Days Inventory (or Average Inventory Period).
iii. Days Payable.
- Total Asset Turnover (TATO)
| Ratio | Formula | 2016 | 2015 | 2014 | O2 |
| Assets management ratio | |||||
| Average collection period | Avg. account receivable / sales revenue * 365 | 76.58 | 77.28 | 84.58 | 62.59 |
| Average account receivable | 8597 | 8941 | 8886 | 6434 | |
| Sales revenue | 40973 | 42227 | 38346 | 37522 | |
| Days inventory | Inventory /cost of sales * 365 | 6.78 | 5.7 | 5.76 | 15.9 |
| Inventory | 565 | 482 | 441 | 624 | |
| Cost of sales | 30435 | 30882 | 27942 | 14323 | |
| Days payable | Account payable / purchase * 365 | 17.95 | 14.9 | 17.44 | 179.6 |
| account payable | 1501 | 1264 | 1339 | 8254 | |
| purchase | 30435 | 30882 | 27942 | 16729 | |
| Total asset turnover | Net sales / average total assets | 0.31 | 0.34 | 0.31 | 1.13 |
| Net sales | 40973 | 42227 | 38346 | 37522 | |
| Average total assets | 133713 | 122573 | 121840 | 33306 |
- Debt Management ratios:
- Debt ratio.
- Times Interest Earned (TIE)
| Ratio | Formula | 2016 | 2015 | 2014 | O2 |
| Debt management ratio | |||||
| Debt ratio | Total liabilities / total assets | 0.5 | 0.45 | 0.41 | 0.47 |
| Total liabilities | 66396 | 54840 | 50059 | 15801 | |
| Total assets | 133713 | 122573 | 121840 | 33306 | |
| Times interest earned | EBIT / annual interest expense | 8.19 | 7.2 | 5.48 | 139.35 |
| EBIT | 10538 | 11345 | 10404 | 10451 | |
| Annual interest expense | 1287 | 1576 | 1897 | 75 |
- Profitability ratios:
- Gross Margin (if appropriate).
- Operating Margin.
iii. Net Profit Margin.
- Basic Earning Power (BEP).
- Return on Asset (ROA).
- Return on Equity (ROE).
| Ratio | Formula | 2016 | 2015 | 2014 | O2 |
| Profitability ratio | |||||
| Gross margin | Gross profit / net sales | 0.26 | 0.27 | 0.3 | 0.38 |
| Gross profit | 10538 | 11345 | 11404 | 14323 | |
| Net sales | 40973 | 42227 | 38346 | 37522 | |
| Operating margin | Operating income / net sales | 0.03 | 0.05 | -0.1 | 0.23 |
| Operating income | 1377 | 1967 | -3913 | 8773 | |
| Net sale | 40973 | 42227 | 38346 | 37522 | |
| Net profit margin | Net income / net sales | -0.09 | 0.14 | 1.55 | 0.18 |
| Net income | -3818 | 5917 | 59420 | 6799 | |
| Net sales | 40973 | 42227 | 38346 | 37522 | |
| Basic earning power | EBIT / total assets | 0.08 | 0.09 | 0.09 | 0.31 |
| EBIT | 10538 | 11345 | 10404 | 10451 | |
| Total assets | 133713 | 122573 | 121840 | 33306 | |
| Return on assets | Net income / total assets | -0.03 | 0.05 | 0.49 | 0.2 |
| Net income | -3818 | 5917 | 59420 | 6799 | |
| Total assets | 133713 | 122573 | 121840 | 33306 | |
| Return on equity | Net income / average Shareholder equity | -0.06 | 0.09 | 0.84 | 0.39 |
| Net income | -3818 | 5917 | 59420 | 6799 | |
| Shareholder equity | 65885 | 66145 | 70802 | 17505 |
- Market Value ratios:
- Price/Earnings ratio.
- Price/ EBITDA ratio.
| Ratio | Formula | 2016 | 2015 | 2014 | O2 |
| Market value ratio | |||||
| Price earnings ratio | Net earnings / Number of share | 0 | 0 | 0.01 | 0 |
| Net earning | 15.08 | 21.75 | 223.84 | 3660 | |
| Number of share | 26692 | 26489 | 26472 | 310220067 | |
| Price EBITDA ratio | EBITDA/ Revenue | 0.28 | 0.28 | 0.29 | 0.28 |
| EBITDA | 11612 | 11915 | 11084 | 10451 | |
| Revenue | 40973 | 42227 | 38346 | 37522 |
DuPont Analysis
| Ratio | Formula | 2016 | 2015 | 2014 | O2 |
| Du Pont analysis | Profit margin*total assets turnover * financial leverage | -0.01 | 0.02 | 0.2 | 1.27 |
| Profit margin | -0.09 | 0.14 | 1.55 | 2.37 | |
| Total assets turnover | 0.31 | 0.34 | 0.31 | 1.13 | |
| Financial leverage | 0.5 | 0.45 | 0.41 | 0.47 |
3. WACC
– Define what the WACC is and what it consists of.
– What assumptions are you using to estimate the WACC?
– Use the CAPM model to estimate the company’s cost of equity.
= Risk-Free Rate of Return + Beta of Asset * (Expected Return of the Market – Risk-Free Rate of Return)
where
Risk-Free Rate of Return = 1.08%
Beta of Asset = 0.84
(Expected Return of the Market – Risk-Free Rate of Return) = 6%
Cost of Equity = 1.08% + 0.75 * 6% = 58%
– Estimate the firm’s cost of debt and, if appropriate, the firm’s cost of other capital components.
– Estimate the weights of the firm’s various capital components.
– Calculate the firm’s WACC.
WACC = E / (E + D) * Cost of Equity + D / (E + D) * Cost of Debt *(1 – Tax Rate)
where
w = the respective weight of debt, preferred stock/equity, and equity in the total capital structure
t = tax rate
D = cost of debt
P = cost of preferred stock/equity
E = cost of equity
= 0.6079 * 5.58% + 0.3921 * 3.8431% * (1 – -1213.895%)
= 23.19%
Definition of the free cash flow
Calculation of free cash flow
Free cash Flow = Operating cash flow – Capital expenditure
Calculation for 2016
Operating cash flow = 10,481000000
Capital expenditure = 8600000000
Free cash flow = 10,481000000 – 8600000000
= 1,88,10,00,000
Calculation for 2015
Operating cash flow = 9,715000000
Capital expenditure = 9200000000
Free cash flow = 9,715000000 – 9200000000
= 515000000
Calculation for 2014
Operating cash flow = 6227000000
Capital expenditure = 7100000000
Free cash flow = 6227000000 – 7100000000
= -873000000
6. Conclusion and Recommendation
Brigham, E. F., & Ehrhardt, M. C. (2013). Financial management: Theory & practice. UK: Cengage Learning.
Higgins, R. C. (2012). Analysis for financial management. USA: McGraw-Hill.
Chandra, P. (2011). Financial management. USA: McGraw-Hill Education.
Vodafone (2016). Annual report. Retrieved from: http://www.vodafone.com/content/annualreport/annual_report16/downloads/vodafone-full-annual-report-2016.pdf
Vodafone (2015). Annual report. Retrieved from: https://www.vodafone.com/content/annualreport/annualreport15/assets/pdf/full_annual_report_2015.pdf
Vodafone (2014). Annual report. Retrieved from:
http://www.vodafone.com/content/annualreport/annual_report14/downloads/full_annual_report_2014.pdf
