
Financial Management
Introduction
This report aim is to evaluate the financial performance of JB Hi-Fi in the recent years. For this, ratio analysis technique is used. It enhances the knowledge on the different ratios such profitability, liquidity and solvency and market value ratios.
An explanation of your understanding of the purpose of financial accounting statements

Financial accounting statements present the information related to the company to evaluate its financial health. Financial accounting statements include profit/loss account, balance sheet and statement of equity and cash flow statement that reflect the financial performance of the company. Financial accounting statements are useful for the stakeholders to make the concerned decisions (Margheim et. al. 2011). For example, shareholders or investors use the financial accounting statements to make investment decisions by analysing the financial performance of the firm and ability to provide the adequate returns. At the same time, based on the information provided in financial accounting statements, creditors determine the ability of the firm to repay the loan while suppliers determine the efficiency of the firm to pay the amount.
An evaluation of the accounting practices used to produce the JB Hi-Fi annual report
JB Hi-Fi uses appropriate accounting practices to represent its annual results. The company effectively follow principle and guideline of the Accounting standard board and IASB. It helps the company to minimise the issue to repress the financial data and information (Pilbeam, 2010). The company follows the each standard during the each financial transaction and record the transaction in the appropriate account. For this, company has an especial financial department that is responsible to conducing financial activities. It is also responsible to prepare the annual report. The annual report of JB Hi-Fi contains the different statements such balance sheet, income statement, cash flow and equity statement.
An analysis of the annual report using financial ratio tools
Financial Ratio
In the financial management, investors and companies use the ratio analysis technique to evaluate financial performance of the company. It is significant part of the financial management that represents the quick evaluation of the financial performance. It is a quantitative information analysis that evaluates the information from financial statement of the company such balance sheet, income statement and cash flow statement. Ratio analysis technique also allows financial management team and investors of JB Hi-Fi to evaluate the financial performance. (Rezaee & Riley, 2011) Under the ratio analysis, the financial performance of the company can be analysed in the different ratios such as Profitability ratios, Market based ratios, Liquidity ratios and Solvency ratios.
Liquidity Ratios
In the ratio analysis, liquidity ratio determines the liquidity performance of the company. It shows the ability of the company to pays its short term debt. Basically, in order to evaluate the liquidity position of the company, there are various ratio are analysed such as current ratio, quick ratio, cash ratio, receivables turnover ratio and inventory turnover ratio (Rubio et. al. 2012). The below tables highlights the liquidity ratios of for JB Hi-Fi:
| Ratio | Formula | 2017 ($m) | 2016 ($m) |
| Liquidity ratios for JB Hi-Fi | |||
| Current ratio | (Current Assets/Current Liabilities) | 1.32 | 1.57 |
| Current Assets | 1170.7 | 702.4 | |
| Current Liabilities | 885.8 | 446.8 | |
| Quick ratio | (quick Assets/Current Liabilities) | 0.35 | 0.35 |
| Quick assets | 310.8 | 156 | |
| Current Liabilities | 885.8 | 446.8 | |
| Cash Ratio | (Cash +Cash equivalents)/Current Liabilities | 0.082 | 0.116 |
| Cash +Cash equivalents | 72.8 | 51.9 | |
| Current Liabilities | 885.8 | 446.8 | |
| Receivables turnover | Net sales / accounts receivable | 38.21 | 44.09 |
| Average account receivable | 147.3 | 89.7 | |
| Sales revenue | 5628 | 3954.5 | |
| Inventory Turnover | Costs of goods sold/Inventory | 6.78 | 6.78 |
| Inventory | 859.9 | 546.4 | |
| Cost of sales | 4397.5 | 3089.1 | |
On the basis of the above table and graph, it can be determined that current ratio has decreased from last year. In this, it is identified that current ratio of JB Hi-Fi for the financial year 2017 is 1.32 that is declined from the financial year 2016 by 1.57. It means the liquidity performance of the company is declined due to this company can face issue to pay it short term debt. Furthermore, in the reference of the quick ratio is found the performance of the company is constant because there quick ratio is 0.35 for the financial year 2016 and 2017. However, it depicts that performance of the company is low in the context of the quick ratio. The principle of the financial management shows that ideal quick ratio should approx one. But, in this context situation is inverse (Fitzmaurice et. al. 2012). If this situation will be continued then company will not able to arrange cash quickly.
In the context of the cash ratio, it is identified that cash ratios are 0.082 and 0.116 for the financial year 2017 and 2016 respectively. It means that the ability of the company to pay its current liabilities with only cash and cash equivalents has decreased. However, the situation of the company was already low and now it has become worst. Hence, the company should concern to improve this situation. At the same time, in the reference of the receivables turnover ratio, it can be determined that in the financial year 2016, it was 44.09 that declined in 2017 by 38.21. A high and increasing receivables turnover ratio shows that company has effective policy regarding the credit sales. But here, receivables turnover ratio decreased that mean company is not efficient (Fridson and Alvarez, 2011). The last as liquidity ratio, inventory ratio is calculated that shows it has been remained same at 6.78. It shows that company is also not effective to move inventory. The company should improve its inventory turnover ratio.
Profitability Ratio
In the ratio analysis, profitability ratio is also one of the main ratios that review the financial performance of the company in the context of the profitability. Under the profitability ratio, performance of the company is evaluated by the different ratios such as return of assets, return of equity, total assets turnover, financial leverage and earning per share (Margheim et. al. 2011). The profitability performance of JB Hi-Fi can be understood by below table:
| Ratio | Formula | 2017 ($m) | 2016 ($m) |
| Profitability ratios | |||
| Return on Assets | Net income / total assets | 7.03% | 15.34% |
| Net income | 172.4 | 152.2 | |
| Total assets | 2452.3 | 992.3 | |
| Return on Equity | Net income /Shareholder equity | 20.20% | 37.61% |
| Net income | 172.4 | 152.2 | |
| Shareholder equity | 853.5 | 404.7 | |
| Total Asset Turnover | Net sales / total assets | 2.29 | 3.99 |
| Net sales | 5628 | 3954.5 | |
| Total assets | 2452.3 | 992.3 | |
| Financial Leverage | Total liabilities/total assets | 0.6520 | 0.5922 |
| Total Liabilities | 1598.8 | 587.6 | |
| Total Assets | 2452.3 | 992.3 | |
| Earnings Per SHARE | 1.543 | 1.538 | |
The above graph and table shows that return on assets ratio of JB Hi-Fi are 7.03% and b15.34% for the financial year 2017 and 2016. I means that it is decreased in the 2017 that shows the performance of the company has declined in the context of the earning more money from the assets. It also shows the company inefficient to use of its organisational resource (Fitzmaurice et. al. 2012). Moreover, it is determined that return on equity ratio also decreased in the financial year 2017 at 20.20% from the last year 2016 at 37.61%. It means that the ability of the company is also decreased in the context of the earning more money on the invested equity. In the profitability ratio, the next ratio as total assets turnover is analysed (Kleinnijenhuis et. al. 2015). In this, it is identified that asset turnover ratios are 2.29 and 3.99 for the financial year 2017 and 2016 respectively. The same thing is also analysed that performance of the company declined as generating sales by using total assets. In the context of the financial leverage ratio, it is found that in the financial year 2017 and 2016, financial leverage ratio are identified by 0.652 and 0.592 in the given order. Even through, this ratio has increased at the small extent that indicates decreased organisational assets and increase in liabilities of the company. In the reference of earning per share, it is identified that earning per share on JB Hi-Fi are constant. It means that company provided similar earning to its investors (Galariotis et al. 2016) .
Solvency Ratio
The solvency ratio evaluates the ability of the company to pay its long term debt. Under the solvency ratio, performance of JB Hi-Fi is analysed by calculating the Debt-equity ratio, Times interest earned and Cash Coverage Ratio. The below table shows the ability of the company to pay its long term debt:
| Ratio | Formula | 2017 ($m) | 2016 ($m) |
| Solvency Ratios | |||
| Debt-Equity Ratio | Total liabilities/total equity | 1.87 | 1.45 |
| Total Liabilities | 1598.8 | 587.6 | |
| equity | 853.5 | 404.7 | |
| Times Interest earned | EBIT / annual interest expense | 28.63 | 68.77 |
| EBIT | 306.3 | 268.2 | |
| Annual interest expense | 10.7 | 3.9 | |
| Cash Coverage Ratio | (Earnings Before Interest and Taxes + Non-Cash Expenses) ÷ Interest Expense | 28.63 | 68.77 |
| EBIT | 306.3 | 268.2 | |
| Non-cash expenses | 0 | 0 | |
| Annual interest expense | 10.7 | 3.9 | |
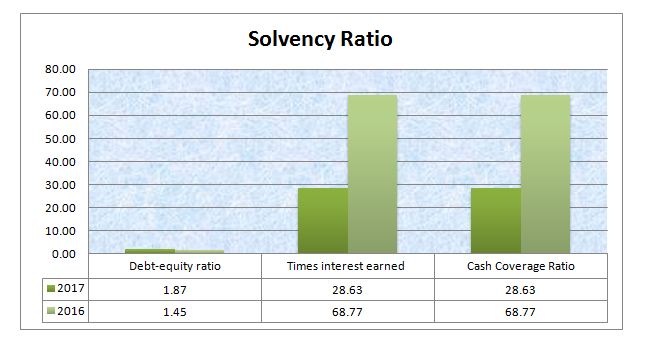
On the behalf of above table and graph, it can be determined that debt equity ratios are 1.87 and 1.45 in the financial year 2017 and 2016. It means that company believe in the debt finance compared to equity finance. It also shows that in the capital structure of the company there is a big part of debt due to this, if company profit decreases in the future then company can face issue to pay interest to debtor. Moreover, time interest earned ratios are 28.63 and 68.77 in the financial year 2017 and 2016. In this, it is found that times interest earned ratio decreased greatly in the one year. It indicates that company performance and ability has decreased in the context of the paying interest with its before tax income (Zhao & Ahmad, 2015). Along with this, cash coverage ratio in the solvency ratio shows that the company ability is also declined as paying its interest expense from the cash availability.
Marketed Based Ratio
In the ratio analysis, the marketed based ratio is used to evaluate company performance in the terms of the stock or share performance. In order to evaluate JB Hi-Fi’s shares performance, Price earnings ratio and Dividend Yield Ratio are calculated. The below tables shows the performance of the company in the context:
| Ratio | Formula | 2017 ($m) | 2016 ($m) |
| Market based ratio | |||
| Price Earnings ratio | Market Price per share/Earnings per share | 14.84 | 18.00 |
| MPS | 22.9 | 27.68 | |
| EPS | 1.543 | 1.538 | |
| Dividend Yield Ratio | DPS/MPS | 5.15% | 3.61% |
| DPS | 1.18 | 1 | |
| MPS | 22.9 | 27.68 | |
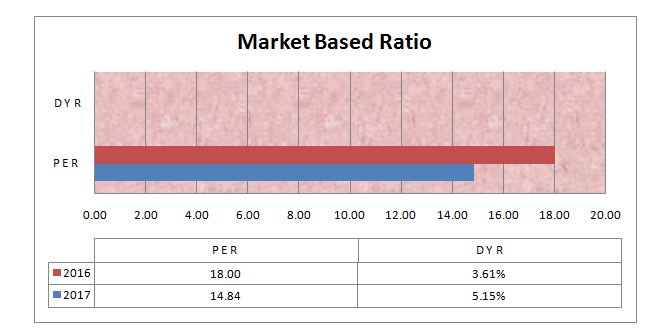
On the basis of the above table and graph, it can be determined that price earnings ratio are 18 and 14.84 in the financial year 2017 and 2016 respectively. It depict that EPS has decreased that mean that profitability of the company decreased in the financial year 2017. Furthermore, in the reference of the dividend yield ratio, it is computed that ratios are 5.15% and 3.61% in the financial year 2017 and 2016. Hence, it indicates the company provide more dividend o from the next year. But, at the same time, profitability of the company is decreasing so that to provide high dividend can be a concerning aspect (Drury, 2013).
Opinion on the future for JB Hi-Fi
On the basis of the above discussion, it can be determined that the financial performance of the company is decreasing that is concerning aspect for the future of the company. It is because a company cannot run more time with decreasing its financial performance. In the context of JB Hi-Fi, it can be said that company liquidity performance is decreasing due to this, company can face issue to pay its current liabilities in the future (Farok et. al. 2015). In the reference of the profitability ratio, it can be determined that performance of the company is also decreasing as generating the profit by using its assets. Due to this, it can be got in financial disaster if this situation will continue in the future. Along with this, it can be also assumed that the situation of JB Hi-Fi is looking risky to pay its long term debt because it has over debt in the capital structure. In additionally, interest paying ability will mitigate in future as looking the current performance. The overall impact of the financial performance will be seen on market value of the company and it will not able to generate the finance for its operations in the future (Festing, 2013).
From the above discussion, it can be concluded that financial position and performance of JB Hi-Fi is declining. The company is not able to utilise organisational resource in the effective manner. At the same time, it can be also summarised that capital structure of the company is also unbalanced. Therefore, management of the company should concern on this and should develop and implement effective strategy to improve the financial performance
References
Drury, C. M. (2013) Management and Cost Accounting. USA: Springer.
Farok, G. M. G. and Garcia, J. A. (2015) Developing Group Leadership and Communication Skills for Monitoring EVM In Project Management. Journal of Mechanical Engineering, 45(1), pp. 53-60.
Festing, M. (2013) Management and International Review: Strategic Issues in International Human Resource Management. USA: Springer Science & Business Media.
Fitzmaurice, G. M., Laird, N. M. and Ware, J. H. (2012) Applied longitudinal analysis. USA: John Wiley & Sons.
Fitzmaurice, G. M., Laird, N. M. and Ware, J. H. (2012) Applied longitudinal analysis. USA: John Wiley & Sons.
Fridson, M. S. and Alvarez, F. (2011) Financial Statement Analysis: A Practitioner’s Guide. USA: John Wiley & Sons.
Galariotis, E. C., Makrichoriti, P., & Spyrou, S. (2016) Sovereign CDS spread determinants and spill-over effects during financial crisis: A panel VAR approach. Journal of Financial Stability, 26, pp. 62-77.
JB Hi-Fi (2017) Annual Report [Online] Available at: https://www.jbhifi.com.au/Documents/2017%20Annual%20Report.pdf (Assessed: 1 November, 2017)
Kleinnijenhuis, J., Schultz, F., & Oegema, D. (2015) Frame complexity and the financial crisis: A comparison of the United States, the United Kingdom, and Germany in the period 2007–2012. Journal of Communication, 65(1), pp. 1-23.
Margheim, L., Kelley, T. and Pattison, D. (2011) An empirical analysis of the effects of auditor time budget pressure and time deadline pressure. Journal of Applied Business Research (JABR), 21(1), pp. 23-36.
Margheim, L., Kelley, T. and Pattison, D. (2011) An empirical analysis of the effects of auditor time budget pressure and time deadline pressure. Journal of Applied Business Research (JABR), 21(1), pp. 23-36.
Pilbeam, K. (2010) Finance and Financial Markets. USA: Palgrave Macmillan.
Rezaee, Z. & Riley, R. (2011) Financial Statement Fraud Defined. USA: John Wiley & Sons.
Rubio, F., Mestre, X. and Palomar, D. P. (2012) Performance analysis and optimal selection of large minimum variance portfolios under estimation risk. Selected Topics in Signal Processing, IEEE Journal of, 6(4), pp. 337-350.
Zhao, Z., & Ahmad, K. (2015) A computational account of investor behaviour in chinese and US market. Int. J. Econ. Behav. Organ, 3(6), pp 78-84.
