Financial Risk Modelling Assignment Sample
DISCOUNTED CASH FLOW MODELING AND SENSITIVITY AND RISK ANALYSIS
1.0 Introduction

The main aim of this report will be to analyze the various risks that will be associated with the establishment of a new business in China. The company that is considered in this scenario is “Blue Corn manufacturing Ltd.”
The company is aiming to open a business in China which will be primarily used for the assembling of various automobile parts. So the role of the analyst will be to develop a plan that may be employed to minimize the risks (Zaroni et al 2019). The calculation will be based on the “discounted Cash flow” and thus the investment may be observed and predicted in a better and efficient manner. The calculation of NPV will also be done with reliable financial data.
The inclusion of the literature review and the methodology will help to make the report more informative and the section for the recommendations is provided so that the readers may develop an idea regarding the necessary steps that may be adopted by the organization to mitigate the associated risks.
2.0 Literature Review
According to Biagi et al 2018, various criteria are being used in working capital to analyze a development, measure profitability, and pass judgment. “Net Present Wealth (NPV)” is regarded as being the most mathematically trustworthy technique since it precisely gauges the development of corporate profits. Though classic “NPV” uniformity is crucial, in the presence of difficulty, an NPV or a return on capital should not be the only variables that affect a conclusion. It is also vital to examine the various risks that have the biggest impact on the optimal solution. The author has demonstrated all these facts with proper data and evaluation. “Sensitivity analysis (SA)” examines the variability of an optimal solution in reaction to changes in the initial input of a simulation, with the goal of finding and evaluating one of most critical risk factors that influence the product.
The analysis of the data was done with accuracy and precision and the data were collected by the author from reliable sources (Choi 2019). The findings section has been demonstrated by the author in a detailed manner and the “Sensitivity Analysis” has been found out (Xu et al 2018). Various derivations on different hypotheses have also been done by the author who enabled the research to be successful.
According to Viviani et al 2019, the main aim of the research was to analyze and discuss on the various models of “discounted cash flow” and the utility of the framework is also discussed by the author. Business loans were exceptionally difficult to get for businesses, particularly someone in the development stage, particularly during the recent recession. Many companies are struggling with a shortage of finance and poor working cash. Small vendors are obligated to accept disadvantageous payment conditions from their consumers, thereby aggravating their fiscal predicament. Additionally, limited or inadequate bank loans decrease these businesses’ liquid assets. As a response, several businesses must halt activities, significantly affecting the entire system.
To properly account for the financial performance measures in production schedule, they first replaced the whole operating expense target of reducing with the company’s current financial position aim, which is really the maximizing profit target. The vast fortune is the sum of all cash inflows flows’ “net present value (NPV)”. Thus the topic was covered by the author using suitable sampling techniques and thus the result that was obtained was accurate (Cucchiella et al 2018). The limitation of the research is very difficult to find as the research covered all the necessary areas related to the topic and the “NPV” and “discount cash flow” was discussed and analyzed.
3.0 Methodology
The section will help the readers to observe and understand the source of data that was used by the researcher to perform all the calculations that are necessary for the assignment.
The type of data that is collected is quantitative and the data is collected from reliable websites. The data that were collected were necessary for the calculation of “NPV” and “discounted Cash flow”. The various data that was collected includes “investment cost”, “variable cost” and so on. The data collection was accurate and the data analysis was performed with a suitable data analysis tool.
The analysis technique that was employed in this research is “primary data analysis technique”. The calculations were performed and the suitable results were obtained (Ellabban et al 2019). The results that are obtained will be discussed in detail in the upcoming section and the readers will be able to understand the concept in detail. The approach that was selected is “deductive approach”. The data analysis was the most important sector of the overall report and the application of suitable data analysis tools have helped to achieve the result in an efficient manner.
So the methodology that was adopted proved to be beneficial for the report and the overall work. The next section will be allotted for the discussion on the results and clear ideas will be developed on the calculation of the financial parameters.
4.0 Analysis of Result
This section discusses the analysis of results of Blue Corn Manufacturing Ltd.
This case study analysis discounted Cash Flow Modeling and Sensitivity and Risk Analysis of “Blue Corn Manufacturing Ltd” for 10 years. This analysis shows various financial data about these companies.
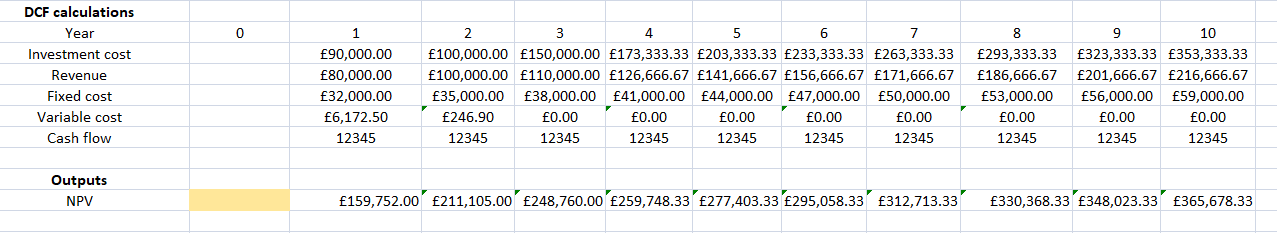
Figure 1: Discounted cash flows
Figure 1 show these companies discounted cash flows and net present value for risk analysis.
This analysis shows the company’s investment cost, revenue, fixed cost, variable cost and cash flow for ten years. Companies’ investment costs are much lower in the first year than other years (Gabrielli et al 2019). This analysis shows that Companies investment costs are increasing per year. First year to ten years companies’ investment costs are increasing. This analysis shows that Companies revenue is also increasing per year. The company’s fixed cost condition is standard. Companies’ fixed costs are increasing per year (Marchioni et al 2018). Company’s variable costs for year 1 and year 2 are so much. First Year Company’s variable cost is so much and it’s a huge problem for companies that face chances. Company’s cash flows are the same every year. This section shows companies’ overall analysis of discounted cash flows with uncertainty inputs. This analysis provides Companies financial data for ten years. Investment cost calculates with the help of the company’s uncertain inputs previous details (Rizvi et al 2020). Company’s parameter of first year, second year and third year provides companies financial data and with these details based on analysis of fixed cost. Revenue calculation with the help of the last three parameters value are for the first three years and others years assuming data (Saługa et al 2020). Annual fixed cost calculation for the last three parameters of fixed for three years and others seven years data are assumed. Variable cost calculation with the help of company’s initial seeds and variable cost percentage, two years calculation describes and others are assuming. Companies cash flows calculation for ten years are companies initial seeds.
Net present value (NPV) shows that companies risk chance measurement. This analysis shows companies net present value for ten years (Wieczorek et al 2019). This analysis shows that companies’ net present values are increasing every year. Companies net present value calculation formula is = NPV ((B3, C20:L20) +C16. This analysis shows companies’ ten years net present values and this data helps to find companies risk chances.
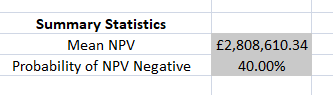
Figure 2: Reviews of analysis
(Source: Ms-Excel)
This section discusses companies’ various financial analyses. Figure 2 shows companies mean NPV and probability of NPV negative. Net present value analysis mainly for Measurement Company’s risks chances (Montiel et al 2018). This analysis provides lots of data about companies’ risk chances. Companies mean Net present value condition is standard situation. Company’s net present value probability is 40% and this probability is not good for any companies.
5.0 Conclusion and Recommendation
This section concludes the financial analysis of Blue Corn Manufacturing Ltd. In this case study discusses lots of financial analysis and results. This section mainly focuses on recommendation with the basis of discounted cash flows and risk analysis Net present value. Investment cost and fixed cost are increasing every year and this is not good for any companies. I suggest that in that situation companies mainly focus on their fixed and investment expenses, companies try to reduce their fixed and investment expenses. Companies need strategies and planning for this and focus in their expenses section. Companies’ revenue is increasing every year. Revenue is an essential part for any company. Company’s revenue is increasing and this is good for this companies. I suggest that companies try to increase their revenue more because company expenses also increase along with revenue. That’s why companies try to increase their revenue more. The company’s variable cost is so high in the first year and second year condition is standard. I suggest for this situation that companies try to focus in the first year because first year company’s variable cost is so high, companies need to reduce their variable cost quickly. Companies try to reduce their expenses, careful about their variable expenses and after reducing try to monitor variable expenses movements. Second year variable cost for the company needs more revenue and tries to balance. This analysis provides companies net present values. Companies net present value for ten years. Companies net present values shows that companies net present values are increasing every year and that is a threat for any companies. Net present calculation is mainly for measurement of companies risk chances. This case study analysis shows that these companies’ net present values increase every year and test the main reason company risk chances also increase. I suggest for this situation company mainly focus on their expenses part because company’s expenses are so higher than company’s revenue. Colonies try to reduce their expenses and also try to increase company’s revenues. Companies mean net present value is for ten years total net present value, this is so much higher than expectation so companies try to focus on their expenses and revenue. The company’s net present value probability is 40%. This is not good for these companies. I suggest for this situation companies try to focus on their net present analysis and reduce their expenses, try to increase their revenue. Companies try to need monitoring in their expenses after reduction. Companies’ main focus is balancing between revenue and their expenses. Companies try to increase their revenue rather than expenses to deny risk chances. Finally, this case study successfully concludes and recommends based on analysis results of the companies.
Reference
Journal
Choi, T.M., 2021. Risk analysis in logistics systems: A research agenda during and after the COVID-19 pandemic. Transportation Research Part E: Logistics and Transportation Review, 145, p.102190.
Ellabban, O. and Alessi, A., 2019. Integrated Economic Adoption Model for residential grid-connected photovoltaic systems: An Australian case study. Energy Reports, 5, pp.310-326.
Gabrielle , L. and Ruggeri, A.G., 2019. Developing a model for energy retrofit in large building portfolios: Energy assessment, optimization and uncertainty. Energy and Buildings, 202, p.109356.
Marchione, A. and Magni, C.A., 2018. Investment decisions and sensitivity analysis: NPV-consistency of rates of return. European Journal of Operational Research, 268(1), pp.361-372.
Montiel, L. and Dimitrakopoulos, R., 2018. Simultaneous stochastic. Mining engineering, 70(12), pp.48-56.
Rizvi, S.K.A., Yarovaya, L., Mirza, N. and Naqvi, B., 2020. The impact of COVID-19 on valuations of non-financial European firms. Available at SSRN 3705462.
Saługa, P.W., Szczepańska-Woszczyna, K., Miśkiewicz, R. and Chłąd, M., 2020. Cost of equity of coal-fired power generation projects in Poland: Its importance for the management of decision-making process. Energies, 13(18), p.4833.
Wieczorek, D., Plebankiewicz, E. and Zima, K., 2019. Model estimation of the whole life cost of a building with respect to risk factors. Technological and Economic Development of Economy, 25(1), pp.20-38.
Xu, X., Wang, J., Li, C.Z., Huang, W. and Xia, N., 2018. Schedule risk analysis of infrastructure projects: A hybrid dynamic approach. Automation in Construction, 95, pp.20-34.
Zaroni, H., Maciel, L.B., Carvalho, D.B. and Pamplona, E.D.O., 2019. Monte Carlo Simulation approach for economic risk analysis of an emergency energy generation system. Energy, 172, pp.498-508.
………………………………………………………………………………………………………………………..
Know more about UniqueSubmission’s other writing services:
