INTERNATIONAL FINANCE
1. Introduction
The international finance environment or IFE can be evaluated as maintaining monetary regulation and international market policies of a multinational organization. The IFE has taken effective responsibility in order to develop trade and economic development with higher employability. Besides that, sources of finance and dividend policies can be described by including monetary regulations to obtain viability. Moreover, the reduction of the impact of inclusion and risks of environmental issues have been evaluated inside the multinational stock exchange organizations.
2. Two recent development in the international financial environment
COVID-19 pandemic circumstances and the Brexit situation have been discussed as the most recent critical developments in the international financial environment. The market economic situation and financial environment have been changed due to the harsh impact of these two developments.
- COVID-19 developments in the financial market
The financial market of Unilever Plc has been distorted with the hit of the COVID-19 pandemic situation. The supply of raw materials has been reduced by 6.8% and due to less production in pandemic situations, the financial situation has become insatiable (Unilever.com, 2021). Due to less financial stability, the number of stakeholders has been reduced, however, in post-pandemic situations investors have reinvested their money based on past experiences. Besides that, due to the increment in goods price, sales have been reduced 0.1% with a 0.3% volume decrement (Unilever.com, 2021). However, the effective improvement in higher demand of consumers of necessary items has become a critical challenge for higher executives of Unilever Plc. Moreover, the percentage of debt ratio has become higher after the COVID pandemic than in the past few years and companies are unable to make more profit due to less productivity (Sarkodie and Owusu, 2021).

COVID and lockdown circumstances have affected the financial sustainability of Unilever and other retail industries of the UK. Including these pandemic circumstances, the globalization strategy has been impacted and the management of this company has focused on changing its strategy. As argued by Mell and Whitten (2021), the COVID pandemic outbreak did not distort the financial stability of Unilever, they managed by delivering products. However, due to the high reputation and business expansion of Unilever, the internationalization strategy has not affected severely as other companies. Due to less financial sustainability, Unilever plc has been forced to reconstruct its capital structure.
- Effect of Brexit on financial market
Focusing on the development of the Brexit situation, the expenses of raw materials have become higher in the last few years. Moreover, the supply chain of Unilever plc has declined by 0.76-1% due to the Brexit situation (Unilever.com, 2021). Brexit has negatively affected the financial situation of the London stock exchange market in the UK. Besides that, less engagement of shareholders and production has severely impacted the international financial environment of the UK (Fuller, 2021). Due to the Brexit situation, the economic balance of Unilever Plc has been tilted and market degradation has occurred of 1% from 2016.
Besides that, due to these unavoidable circumstances, this organization has become unable to obtain revenue from EU countries. As opined by Allan et al. (2020), Brexit has changed the financial environment of the London stock exchange market. However, this company has made a strategic step in order to improve overall sales growth of 1.9% with focusing on improvement of 4.5% in-home care and 1.2-1.4% in foods and personal care in 2020 (Business-standard.com, 2021).
2.1. Impacts of two recent developments on the company in future
- Impact of COVID-19 on the company in future
The productivity of the London stock exchange has taken effective responsibility to improve the business activities of Unilever. As opined by Alam, Alam and Chavali (2020), proper organizational improvement can be a fruitful step to control business development in pandemic circumstances. Including various changes and distortions in the business market, this organization has faced a critical challenge of controlling market position to obtain long term opportunities. Higher authorities of Unilever have declared this organization will not be able to upgrade the payment level of senior managers and leaders (Debata, Patnaik and Mishra, 2020). However, this company has proposed a 100 million pound amount for employee protection in the Covid pandemic situation.
- Impact of Brexit situation on the company in future
Due to the Brexit situation, the globalization procedure of Unilever Plc has slightly affected expanding organizational activities (Kalaitzake, 2021). Higher executives should maintain a proper business strategy to keep their business secure from further pandemic issues. Besides that, Unilever plc should make a good relationship with countries of the EU committee in order to gather effective revenue for business globalization in the upcoming future. According to Tatlow-Golden and Parker (2020), Unilever has focused on expanding food and refreshment products in the Brexit situation to EU organizations to gather help. Unilever has made a good bond with hospitality sector company OYO to achieve financial stability and create various opportunities for global trading.
3. Key elements and risk management strategy
The effective evaluation of financial risks is a key part of Unilever Plc risk management policy. The risk management unit should pile up risk factors, issues and include proper beneficial strategies in order to navigate those key risk issues.
3.1. Source of finance
Capital structure is a beneficial combination of the proper amount of debt and equity value, moreover, it has been used in obtaining beneficial ideas focusing on long-term financial sources. According to Nguyen (2020), this capital structure can be evaluated as the balance of debt and equity valuation. The valuation of the total liabilities of Unilever has reduced in 2020, in 2019 the value was 50,920 and it will become 50,004 million euros in 2020. On the other hand, the equity valuation was 13,192 and it has improved to 15,266 million euros in 2020.
Theory of capital structure
Focusing on the theory of capital structure, the Net income approach theory has been obtained in order to focus on financial sources. According to this theory of capital, structure organizations are capable of decreasing the expenses due to operational activities and the extra cost of higher production (Cappa, Cetrini and Oriani, 2020). Unilever plc should implement this strategic method in order to decrease expenses due to operational activities in order to maintain financial stability in the post-Brexit and COVID pandemic situation.
Moreover, this net income approach theory has helped the organization in order to enhance the value market precisely and have a good share in obtaining financial stability. Additionally, this approach has become helpful for Unilever plc to reduce capital expenses, debt value and maintain a flexible debt to equity proportion (Azizuddin and Alwahidin, 2020). Apart from this, the procedure has maintained various assumptions by lowering capital debt expense from equity and valuation of taxation should be excluded in the calculation of the capital structure.
3.2. Dividend policy
Dividend policy is a key strategic method to provide dividends to the shareholders and focused on dividend policy the organization has provided the retained profit value in a consistent frequency. Unilever Plc has provided 1.1163 GBP per share in 2021, however, it has been reduced from last year, it was 1.4530 GBP per share in 2020 (Fidelity.co.uk, 2021).
Miller and Modigliani theory
Focusing on the Miller and Modigliani dividend policy theory, the dividend has no effect on business share price and it has guided to improve investment to upgrade share value of the company. Besides that, investors have become happier in obtaining a higher amount of return value after the maturity period (Husain and Sunardi, 2020). Unilever Plc should include this M&M dividend policy strategy in becoming flexible to deliver proper dividend amounts and able to decrease the variance between dividends and capital. Additionally, this strategy has described that stakeholder will be capable of obtaining their earnings from the net capital dividend amount. This M&M Theory has guided Unilever plc to reduce the deviation between dividends and capital amounts. However, this strategy of dividend policy has maintained various assumptions which are such,
- The capital market of a company has to be perfect and investors will not impact the financial stability of the organization.
- Dividend and capital cost should maintain equal rate taxation, discrimination should be mitigated to reduce financial risks (Rochmah and Ardianto, 2020). Investment of all projects should be conducted by sustaining an equal rate of maturity value.
- Constant investment strategy should be followed by the organization; therefore, the market position and risk of return would not change.
- Uncertainty in the financial environment should be resolved to upgrade the profit ratio in future years. According to Nguyen et al. (2020), M&M Theory has helped to reduce cash flow volatility inside the company.
4. Financial performance
Profitability ratio
- Net profit margin
Net profit margin is the key proportion that describes the ability to generate net income from the percentage of turnover. According to Nariswari and Nugraha (2020), it can be generated by dividing net profit by turnover and describing the ability to make a profit through various years. According to financial analysis, the net profit margin has been calculated for two consecutive years. The net profit margin was 11.97% in 2020, whereas in the previous year the value was 11.59%. The net profit has been developed; however, turnover has been reduced from 51,980 million euro to 50,724 million euro in the year 2020. Therefore, it can be stated that Unilever plc has a stable net profit margin in 2020 as they can convert profit into sales amount in 2020 (Unilever.com, 2021).
| Profitability Ratios | 2020 | 2019 |
| Net profit | 6,073 | 6,026 |
| Turnover | 50,724 | 51,980 |
| Net profit margin (%) | 11.97% | 11.59% |
| Formula: Net profit / Turnover | ||
Table 1: Net profit margin
(Source: MS Excel)

Figure 1: Net profit margin
(Source: MS Excel)
- Return on assets
Return on assets has helped to describe the capability of making income after delivering expenses in various years. Based on financial ratio analysis, this can be calculated by dividing net profit from total assets. According to Mahdi and Khaddafi (2020), from a return on assets organizations are able to reduce risk percentage on return. The return on assets value was 8.98% in 2020 and in the year 2019, the value was 9.30%. The total amount of assets were 67,659 million euro and 64,806 million euro in 2020 and 2019 respectively. Therefore, it can be stated that Unilever plc is unable to return more in 2020 and it indicates the presence of higher risk (Unilever.com, 2021).
| Profitability Ratios | 2020 | 2019 |
| Net Profit | 6,073 | 6,026 |
| Total Assets | 67,659 | 64,806 |
| Return on Assets | 8.98% | 9.30% |
| Formula: Net Profit / Total Assets | ||
Table 2: Return on assets
(Source: MS Excel)

Figure 2: Return on assets
(Source: MS Excel)
Liquidity ratio
- Current ratio
The current ratio is one of the key financial factors that has described the capability of an organization to deliver obligations in a limited period. It can be evaluated by measuring current assets to current liabilities to monitor the ability of an organization (Nuryani and Sunarsi, 2020). Based on financial analysis, it can be stated that Unilever has managed to sustain an equal current ratio of 0.78 in both the 2020 and 2019 financial periods. Thus, this organization has made 16,157 million euros in 2020 and 16,430 million euros in 2019. It can be stated that in both years this organization has become capable of paying its obligation in a limited period (Unilever.com, 2021).
| Liquidity Ratios | 2020 | 2019 |
| Current Assets | 16,157 | 16,430 |
| Current Liabilities | 20,592 | 20,978 |
| Current Ratio | 0.78 | 0.78 |
| Formula: Current Assets / Current liabilities | ||
Table 3: Current ratio
(Source: MS Excel)

Figure 3: Current ratio
(Source: MS Excel)
- Quick ratio
The quick ratio has described the ability to pay current liabilities without selling the inventories. Besides that, a quick ratio can be calculated by dividing current liabilities and the difference between assets and inventories (Suwantari, Ariana and Suprapto, 2020). Based on the financial analysis, it can be discussed that Unilever has made 0.57 and 0.58 as a quick ratio in the respective years of 2019 and 2020. Moreover, the inventory amount of Unilever is 4,462 and 4,164 million euros in two consecutive years (Unilever.com, 2021).
| Liquidity Ratios | 2020 | 2019 |
| Current Assets | 16,157 | 16,430 |
| Inventories | 4,462 | 4,164 |
| Current Assets – Inventories | 11,695 | 12,266 |
| Current Liabilities | 20,592 | 20,978 |
| Quick Ratio | 0.57 | 0.58 |
| Formula: Current liabilities / Current Asset – Inventory | ||
Table 4: Quick ratio
(Source: MS Excel)
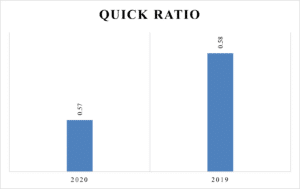
Figure 4: Quick ratio
(Source: MS Excel)
Efficiency ratio
- Trade payable days
Accounts payable days can be stated as the payable days to deliver trade amounts to shareholders. The trade payable amount is 14,132 and 14,768 in consecutive two years of 2020 and 2019. Based on their cost of goods sold and trade payables amount, Unilever has become able to pay trade amounts in 122 and 125 days in 2020 and 2019 respectively (Unilever.com, 2021).
| Efficiency Ratios | 2020 | 2019 |
| Trade payables | 14,132 | 14,768 |
| Cost of Goods Sold | 42,421 | 43,272 |
| Trade Payable Days | 122 | 125 |
| Formula: Trade Payable / Cost of Goods sold *365 | ||
Table 5: Trade payable days
(Source: MS Excel)

Figure 5: Trade payable days
(Source: MS Excel)
- Account receivable days
Account receivable days are the financial ratios which show the company’s capability to take in an account to collect invoices from their customers. As per the view of Saifudin et al. (2019), stable account receivable days are considered to be a lower number of days that indicates a company’s financial health can be measured by this. It can be calculated as dividing by account receivable days to its sales through the year. In this report, Unilever Plc was taking 36 days to collect their cash from customers in 2020 and in 2019 it took 47 days which was greater than 2020. Therefore, it has stated that in 2019 they did not have skilled workers to collect their cash from customers as compared to 2020. In 2020 the company has a lower number of days to collect invoices from their customers.
| Efficiency Ratios | 2020 | 2019 |
| Trade receivables | 4,939 | 6,695 |
| Turnover | 50,724 | 51,980 |
| Accounts Receivable Days | 36 | 47 |
| Formula: Trade receivable / Turnover*365 | ||
Table 6: Account receivable days
(Source: MS Excel)

Figure 6: Account receivable days
(Source: MS Excel)
Investment ratio
- Earnings per share (EPS)
Earnings per share is defining a company’s ability to gain profit through selling their shares in a given period. As per the view of Sausan et al. (2020), a stable investment ratio is considered to be high for measuring financial health for an organization. Therefore, it can be measured as dividing by earnings after tax to their ordinary shares in a specific year. In this context Unilever had 64.97p in 2020 and 79.99p in 2019 which was higher than 2020. It has stated that the company has faced a high profit through the shares as compared to 2020. Therefore, Unilever Plc had greater profitability in 2019 according to the earnings per share as compared to 2020.
| Investment ratio | 2020 | 2019 |
| Earnings after tax | 9,919 | 10,552 |
| Number of ordinary shares | 15,266 | 13,192 |
| Earnings Per Share (EPS) (in cents) | 64.97 | 79.99 |
| Formula: Earning after tax / Number of ordinary shares *100 | ||
Table 7: Earning per share (EPS)
(Source: MS Excel)

Figure 7: Earning per share (EPS)
(Source: MS Excel)
- Dividend per share (DPS)
Dividend per share is a summation of dividends that is generated by an organization for the number of ordinary shares in a given year. As per the view of Arsal (2021), for a stability of investment ratio the dividend per share should be higher to measure financial condition for a company. It can be estimated by dividing the total equity per share to their number of ordinary shares in a given year. In this report, Unilever Plc had 115.65p in 2020 and 105.26p in 2019 which was lower as compared to 2020. It can be stated that in 2020 the company has faced a higher dividend share as they have distributed their earnings per share to the shareholders effectively.
| Investment ratio | 2020 | 2019 |
| Total Equity dividend paid | 17,655 | 13,886 |
| Number of equity shares | 15,266 | 13,192 |
| Dividend per Ordinary Share (DPS) (in cents) | 115.65 | 105.26 |
| Formula: total Equity dividend paid / Number of equity shares *100 | ||
Table 8: Dividend per share (DPS)
(Source: MS Excel)

Figure 8: Dividend per share (DPS)
(Source: MS Excel)
5. Conclusion
Based on this report analysis, Unilever plc has shown their ability to obtain a huge profit in both of the years of 2020 and 2019. Focusing on overall evaluation, this organization has performed well in the recent 2020 year and maintains a stable situation. The organization has sustained their dividend policy and sources of finance during the COVID pandemic and Brexit situation.
Reference
Alam, M.N., Alam, M.S. and Chavali, K., 2020. Stock market response during COVID-19 lockdown period in India: An event study. The Journal of Asian Finance, Economics, and Business, 7(7), pp.131-137. Available at: https://www.koreascience.or.kr/article/JAKO202020952022430.pdf
Allan, G., Comerford, D., Connolly, K., McGregor, P. and Ross, A.G., 2020. The economic and environmental impacts of UK offshore wind development: The importance of local content. Energy, 199, p.117436. Available at: https://strathprints.strath.ac.uk/71936/1/Comerford_etal_Energy_2020_The_economic_and_environmental_impacts_of_UK_offshore.pdf
Arsal, M., 2021. Impact of earnings per share and dividend per share on firm value. ATESTASI: Jurnal Ilmiah Akuntansi, 4(1), pp.11-18. Available at: http://jurnal.fe.umi.ac.id/index.php/ATESTASI/article/download/594/478
Azizuddin, I. and Alwahidin, A., 2020. The Effect Of Financial Ratio To Net Income For The Period 2013-2017: Study At PT. Bank Syariah Mandiri Indonesia. At-Tahdzib: Jurnal Studi Islam Dan Muamalah, 8(2), pp.21-32. Available at: http://ejournal.kopertais4.or.id/mataraman/index.php/tahdzib/article/download/3992/3006
Cappa, F., Cetrini, G. and Oriani, R., 2020. The impact of corporate strategy on capital structure: evidence from Italian listed firms. The Quarterly Review of Economics and Finance, 76, pp.379-385. Available at: https://fardapaper.ir/mohavaha/uploads/2020/01/Fardapaper-The-impact-of-corporate-strategy-on-capital-structure-evidence-from-Italian-listed-firms.pdf
Debata, B., Patnaik, P. and Mishra, A., 2020. COVID‐19 pandemic! It’s impact on people, economy, and environment. Journal of Public Affairs, 20(4), p.e2372. Available at: https://www.researchgate.net/profile/Pooja-Patnaik/publication/344086255_COVID-19_pandemic_It’s_impact_on_people_economy_and_environment/links/5ff2ba55299bf140886c6ce7/COVID-19-pandemic-Its-impact-on-people-economy-and-environment.pdf
Fuller, C., 2021. Understanding the impact of Brexit: The case of foreign software corporations in Scotland and South East England. European Urban and Regional Studies, 28(2), pp.173-191. Available at: http://orca.cf.ac.uk/137392/1/C%20Fuller%202021%20Understanding%20the%20impact%20of%20brexit%20postprint.pdf
Husain, T. and Sunardi, N., 2020. Firm’s Value Prediction Based on Profitability Ratios and Dividend Policy. Finance & Economics Review, 2(2), pp.13-26. Available at: https://riiopenjournals.com/index.php/finance-economics-review/article/download/102/53
Kalaitzake, M., 2021. Brexit for finance? Structural interdependence as a source of financial political power within UK-EU withdrawal negotiations. Review of International Political Economy, 28(3), pp.479-504. Available at: https://www.tandfonline.com/doi/pdf/10.1080/09692290.2020.1734856
Mahdi, M. and Khaddafi, M., 2020. The Influence of Gross Profit Margin, Operating Profit Margin and Net Profit Margin on the Stock Price of Consumer Good Industry in the Indonesia Stock Exchange on 2012-2014. International Journal of Business, Economics, and Social Development, 1(3), pp.153-163. Available at: http://journal.rescollacomm.com/index.php/ijbesd/article/download/53/55
Mell, I. and Whitten, M., 2021. Access to nature in a post Covid-19 world: Opportunities for green infrastructure financing, distribution and equitability in urban planning. International Journal of Environmental Research and Public Health, 18(4), p.1527. Available at: https://www.mdpi.com/1660-4601/18/4/1527/pdf
Nariswari, T.N. and Nugraha, N.M., 2020. Profit Growth: Impact of Net Profit Margin, Gross Profit Margin and Total Assests Turnover. International Journal of Finance & Banking Studies (2147-4486), 9(4), pp.87-96. Available at: http://ssbfnet.com/ojs/index.php/ijfbs/article/download/937/712
Nguyen, T., Nguyen, H., Tran, Q. and Le, Q., 2020. Dividend policy and share price volatility: empirical evidence from Vietnam. Accounting, 6(2), pp.67-78. Available at: http://m.growingscience.com/ac/Vol6/ac_2019_25.pdf
Nguyen, V., 2020. Human capital, capital structure choice and firm profitability in developing countries: An empirical study in Vietnam. Accounting, 6(2), pp.127-136. Available at: http://m.growingscience.com/ac/Vol6/ac_2019_19.pdf
Nuryani, Y. and Sunarsi, D., 2020. The Effect of Current Ratio and Debt to Equity Ratio on Deviding Growth. JASa (Jurnal Akuntansi, Audit dan Sistem Informasi Akuntansi), 4(2), pp.304-312. Available at: https://journalfeb.unla.ac.id/index.php/jasa/article/download/1378/885
Rochmah, H.N. and Ardianto, A., 2020. Catering dividend: Dividend premium and free cash flow on dividend policy. Cogent Business & Management, 7(1), p.1812927. Available at: https://www.tandfonline.com/doi/pdf/10.1080/23311975.2020.1812927
Saifudin, S. and Sa’adah, M., 2019. THE EVALUATION OF BUSINESS RECEIVABLES USING COSO, RECEIVABLE TURNOVER (RTO), AVERAGE COLLECTION PERIOD (ACP), AND AGING OF ACCOUNT RECEIVABLE (AAR) INTERNAL CONTROL APPROACH MODELS (Case Study at PT Voltech Pratama Semarang). Economics and Business Solutions Journal, 3(1), pp.19-29. Available at: https://journals2.usm.ac.id/index.php/ebsj/article/download/1477/952
Sarkodie, S.A. and Owusu, P.A., 2021. Global assessment of environment, health and economic impact of the novel coronavirus (COVID-19). Environment, Development and Sustainability, 23, pp.5005-5015. Available at: https://link.springer.com/content/pdf/10.1007/s10668-020-00801-2.pdf
Sausan, Fakhri Rana, Lardin Korawijayanti, and Arum Febriyanti Ciptaningtias.2020 “The Effect of Return on Asset (ROA), Debt to Equity Ratio (DER), Earning per Share (EPS), Total Asset Turnover (TATO) and Exchange Rate on Stock Return of Property and Real Estate Companies at Indonesia Stock Exchange Period 2012-2017.” Ilomata International Journal of Tax and Accounting 1, no. 2. 103-114. Available at: https://www.ilomata.org/index.php/ijtc/article/download/66/59
Suwantari, N.P., Ariana, I.M. and Suprapto, P.A., 2020. Accounting Analysis in Accounts Receivable Management to Minimize the Risk of Uncollectible Receivables at ALS Hotel and Resort. Journal of Applied Sciences in Accounting, Finance, and Tax, 3(2), pp.117-124. Available at: http://ojs.pnb.ac.id/index.php/JASAFINT/article/download/2133/1488
Tatlow-Golden, M. and Parker, D., 2020. The Devil Is in the Detail: Challenging the UK Government’s 2019 Impact Assessment of the Extent of Online Marketing of Unhealthy Foods to Children. International Journal of Environmental Research and Public Health, 17(19), p.7231. Available at: https://www.mdpi.com/1660-4601/17/19/7231/pdf
Website
Business-standard.com, 2021, a phenomenal market for Unilever, second only to US: Alan Jope, https://www.business-standard.com/article/companies/india-a-phenomenal-market-for-unilever-second-only-to-us-alan-jope-121020401699_1.html, [Accessed on: 27.07.2021]
Fidelity.co.uk, 2021, Unilever PLC (ULVR), https://www.fidelity.co.uk/factsheet-data/factsheet/GB00B10RZP78-unilever-plc/dividends, [Accessed on: 27.07.2021]
Unilever.com, 2021, 2020 FIRST HALF YEAR RESULTS, https://www.unilever.com/Images/ir-q2-2020-full-announcement_tcm244-553393_en.pdf, [Accessed on: 27.07.2021]
Unilever.com, 2021, Annual Report and Accounts 2020, https://www.unilever.com/Images/annual-report-and-accounts-2020_tcm244-559824_en.pdf, [Accessed on: 27.07.2021]
Unilever.com, 2021, Annual report of Unilever Plc. https://www.unilever.com/investor-relations/annual-report-and-accounts/archive-of-annual-report-and-accounts/ [Accessed on- 27.07.2021]
Unilever.com, 2021, Q1 results: flat sales reflect unprecedented impact of Covid-19, https://www.unilever.com/news/press-releases/2020/q1-results-flat-sales-reflect-unprecedented-impact-of-covid-19.html, [Accessed on: 27.07.2021]
Appendices
Appendix1: Financial performance for Unilever Plc
| Unilever | ||
| Profitability Ratios | 2020 | 2019 |
| Net profit | 6,073 | 6,026 |
| Turnover | 50,724 | 51,980 |
| Net profit margin (%) | 11.97% | 11.59% |
| Formula: Net profit / Turnover | ||
| Profitability Ratios | 2020 | 2019 |
| Net Profit | 6,073 | 6,026 |
| Total Assets | 67,659 | 64,806 |
| Return on Assets | 8.98% | 9.30% |
| Formula: Net Profit / Total Assets | ||
| Liquidity Ratios | 2020 | 2019 |
| Current Assets | 16,157 | 16,430 |
| Current Liabilities | 20,592 | 20,978 |
| Current Ratio | 0.78 | 0.78 |
| Formula: Current Assets / Current liabilities | ||
| Liquidity Ratios | 2020 | 2019 |
| Current Assets | 16,157 | 16,430 |
| Inventories | 4,462 | 4,164 |
| Current Assets – Inventories | 11,695 | 12,266 |
| Current Liabilities | 20,592 | 20,978 |
| Quick Ratio | 0.57 | 0.58 |
| Formula: Current liabilities / Current Asset – Inventory | ||
| Efficiency Ratios | 2020 | 2019 |
| Trade payables | 14,132 | 14,768 |
| Cost of Goods Sold | 42,421 | 43,272 |
| Accounts Payable Days | 122 | 125 |
| Formula: Trade Payable / Cost of Good sold *365 | ||
| Efficiency Ratios | 2020 | 2021 |
| Trade receivables | 4,939 | 6,695 |
| Turnover | 50,724 | 51,980 |
| Accounts Receivable Days | 36 | 47 |
| Formula: Trade recievable / Turnover*365 | ||
| Investment ratio | 2020 | 2019 |
| Earnings after tax | 9,919 | 10,552 |
| Number of ordinary shares | 15,266 | 13,192 |
| Earnings Per Share (EPS) (in cents) | 64.97 | 79.99 |
| Formula: Earning after tax / Number of ordinary shares *100 | ||
| Investment ratio | 2020 | 2019 |
| Total Equity dividend paid | 17,655 | 13,886 |
| Number of equity shares | 15,266 | 13,192 |
| Dividend per Ordinary Share (DPS) (in cents) | 115.65 | 105.26 |
| Formula: total Equity dividend paid / Number of equity shares *100 | ||
(Source: MS Excel)
Know more about UniqueSubmission’s other writing services:
