International Financial Markets And Investment Assignment Sample
Introduction
Decision-making processes play a significant role in increasing return on investment. In order to evaluate various aspects of an investment, it is necessary for an investor to have effective tools and technology. These tools and techniques assist investors to assess profitability of an investment and various risks associated with proposed investment. The following assignment is based on creation of an investment portfolio for investors. While creation of investment portfolio, market risk, company financial performance, its financial statement analysis and difference theory has been used. This study aims to create the most appropriate investment portfolio which has a higher number of profits at low risk.
Discuss investment return and risk objectives and investment strategy
Investment returns and risk objectives
Objective of investment return and risk analysis for the preparation of portfolios is to define different equity and their performances in different indexes so that officials are able to make appropriate investment decisions. Investment return is computed to understand profitability of the investment policy and expected cash flow of a particular company in the upcoming future. An investment may include neutral, loving and adverse effects of investment policy however investment return and risk objective is going to provide a clear overview of equities for investment.
Risk attitude
| Type | Concept | Suitable investment |
| Growth fund | Growth fund is a diversified stock portfolio that focuses on capital appreciation with few dividend payouts. Growth fund is extremely volatile with a sudden rise and drop of stock value. | Growth funds include high risk and high reward policy and this is applicable for the participants who can maintain a high risk and long term horizon of investment. As cited by Lettau and Madhavan (2018), Growth funds are invested in equities, stocks, bonds and real estate investment trust to earn high returns. |
| Constant return fund | As cited by Kigle et al. (2022), constant return forms are interested in different Government bonds that it is comparatively low risk and their return is comparatively lower than growth fund. It is a process of long term investment and investors a consistent return after frequent periods. | This investment policy is for those investors who want a consistent return from their investment without bearing high risk. |
Table 1: Risk attitude

(Source: Kigle et al. 2022)
Strategies of investment
| Passive investment strategy | Active investment strategy |
| Passive investment strategy is a long-run process of building wealth and it focuses on buying securities from stock market indexes to hold them for a long period. As opined by Ennis (2020), investors have to bear a lower risk for investing through passive investment strategy; portfolio or market-weighted indexes are tracked by this strategy that is common in the equity market. Concentric constant tracking market position is expensive in passive investing strategy however it provides a steady return to the organization. | Active investment strategy is a process of selling and buying strategies of stocks in an ongoing market. As opined by Pulpon and Canizares (2020), active investing approach guides investors to reconstruct their strategies in an ongoing marketplace to deal with uncertain situations. This process is flexible and investors can adjust their policies to achieve their predetermined goals that provide an opportunity to foot performance of the index. |
Table 2: Investment strategy analysis
(Source: Ennis, 2020)
Top-down investment strategy
Top-down investment strategy evaluates macro factors of an economy that are interest rate, taxation, gross domestic product and employment before analyzing micro factors of a particular organization. Top-down investing always prioritizes macroeconomic conditions and their fundamentals for investment.
Bottom-up investment strategy
Microeconomic factors are prioritized in the bottom-up investing approach before consideration of macroeconomic factors. This investing strategy is focused on analyzing financially the health and key indicators of the organization to understand its upcoming profitability.
Requirements from investment and recommendations
| Investor country | UK |
| Investment market | London Stock Exchange, New York Stock Exchange, and Nigeria Stock Exchange |
| Funds | £1,000,000 |
| Investment period | 10 years |
| Expected Return on Investment | Around 14% |
| Risk attitude | Constant return Fund |
| Strategies of investment | Active investment strategy |
| Investment approach | Bottom-up investment strategy |
Table 3: Requirement and recommended investment model
(Source: Self-created)
Construction of investment portfolio and selected shares and evaluation of methods
Rationale for investing in London Stock Exchange, New York Stock Exchange, and Nigeria Stock Exchange
| Particulars | London Stock Exchange | New York Stock Exchange | Nigeria Stock Exchange |
| Transparency | European Union regulated market security does not provide transparency of the trading system before trading. In order to make investment regarding decision it is necessary for business to evaluate transparency in business. | New York stock exchange provides a fair environment of trading that allows potential investors for trading efficiently in a transparent manner. | Transparency is from a market in the capital market of Nigeria stock exchange to reconstituted investor protection that can maintain their profitability with an appropriate decision. |
| Liquidity | Design liquidity of the London stock exchange is focused on maximizing liquidity of every investor through electronically operated order-driven services. It has influenced investors to share brief knowledge about stocks and they are able to purchase and sell those shares and stocks without any complications | Supplemental liquidity providers are included in the New York stock exchange that maintains a bid-offer of every assigned security at least around 10% for every trading day (Nyse.com, 2022). | Increasing trade ratio by 1% causes reduction of GDP by 3.4 % and that results in manipulation in inflated liquidity. Based in this, it can be said that performance of company is enhanced due to increases in liquidity position. |
| Growth | London stock exchange revenue growth around 20% revenue growths in the last 3 year period (Londonstockexchange.com, 2022). | Average growth of the New York stock exchange in the last 30 years is around 8.29 per cent after adjusting for inflation effects. | Average growth of Nigeria’s stock exchange is around 19.46% in the year 2017 (Ngxgroup.com, 2022). |
| Returns | Average annual return price of the London stock exchange is around 7.8%. The median of total return from 1984 to 2019 is around 103% favour in this stock market (Londonstockexchange.com, 2022). | Average return from stocks is around 10% in the New York stock exchange however investors’ mail rules around 2% to 3% due to inflation effects (Nyse.com, 2022). | Average value of return from Nigeria’s stock exchange is around 13.82% has decreased to around 7.1 % in the year 2020 (Ngxgroup.com, 2022). |
Table 4: Rationale of investing in a different stock exchange
(Source: Londonstockexchange.com, 2022)
Rationale for choosing Equities
Criteria for choosing equities are going to be based on current profitability of that equity and its projected profitability in the upcoming 10 years. Utilization of assets and maximizing health infrastructure is necessary to invest in particular equity. Conservative structure of maintaining capital is going to be undertaken to prepare an investment portfolio. Market value of particular equity and its profitability momentum is going to be considered to define its future profitability.
Fundamental Analysis
Microanalysis
Microanalysis is the factor that has a direct impact on the financial performance of a business. As argued by Kopsidas (2019), while making investment retained decisions it is quite not analyzed the detailed information of micro factors which has internally affected the performance of a business. This study as there are mainly three-country stock exchanges has covered detailed discussion on microenvironment factors allowed to analyse what are the impact of micro factors such as competitors, stakeholder engagement and other factors through which performance of common can be analyzed in a systematic way. Through analysis of Barclay’s income from the internet, it has been noted that 12596 million pounds have been generated through income. Moreover, an analysis of shell companies has noted that revenue of the shell incurred around 190051 million pounds in the financial years 2021. Analysis of Tesco revenue has noted that Tesco generated around 12731 million pounds of revenue in the year 2021 which shows its ability to generate revenue during the years. As higher revenue shows a higher amount of return on investment, this company that has a higher amount of revenue is suitable for investing as it ensures a high rate of return.
Macro analysis
Macro analysis factors are also considered as significant factors which have a direct impact on profitability of an investment. Macro factors include technology factors, environmental factors and societal factors which have directly associated with the rate of return on investment. Political factors have control on the rate of foreign exchange rate and business policy is being affected by these activities (Christodoulou and Cullinane, 2019.). In this situation analysis of this aspect of a business is necessary, for example, UK political factors are quite beneficial for business and organization as compared to companies in Nigeria. Other than this, technology factor is also a significant aspect as the UK has advanced in technology as compared to Nigeria thus, investors are more accessible to its company’s financial performance rather than Nigeria.
Barclays
Income from interest of Barclays is around 12596 million GBP in the year 2021 and its income growth is around 5.59 per cent. This company acquired a total asset of 1384285 million GBP in the year 2021 and its growth rate of assets is around 2.58 % (Wsj.com, 2022). Return on asset is around 0.47 %. This organization utilizes its available assets efficiently and its return on total equity is around 11.4 3% in the year 2021. Ratio of equity to an asset is around 0.04 of Barclays in the year 2021 and shareholders’ equity to total assets ratio is 4.1 %. Liquidity of the organization is efficient and it utilizes its available resources to generate profit consistently. Earnings per share of Barclay are around 0.37 and its growth is approximately 323 per cent.
Shell
Revenue of shell is around 190051 million GBP in the year 2021 and its sales growth is around 43.38%. Average growth of total assets is around 7.61 % in the year 2021 and its equity to asset ratio is 42.5 3% has maintained its fixed resources effectively. Current ratio of this company is also highlighted in this study which shows its operational efficiency in market. Current ratio is 1.35 and cash ratio is 0.39 and shell has maintained liabilities to asset ratio are 56.64 % (Wsj.com, 2022).
Tesco
Revenue from sales is around 12731 million US dollars in Tesco PLC and sales growth is around 19%. Balance sheet of Tesco is highlighted in this study which highlight that shows operational efficacy of business in market and analysis of balance sheet provide detailed information about performance of company is beneficial for making decision regarding investment.

Figure: Balance sheet of Tesco
(Source: Tescoplc.com, 2021)
Analysis of balance sheet of Tesco from the London stock exchange it has been noted that the company has a higher liquidity ratio which is beneficial for investment as it seems more effective in managing day to day business activity. Earning procedure of this company is around 8.61 and growth of EPS is around 35%. It has an effective asset management infrastructure and it has maintained equity to total asset ratio of around 23% and average growth of assets is 22% (Wsj.com, 2022). Liquidity is comparatively good in this organization that is 1.57 % off current ratio.
AstraZeneca
Net income growth is negative 1:00 33% in the year 2021 and earnings per share is around 0.06. Profit equity ratio of AstraZeneca is around 445 and its profit margin before tax is approximately -0.5 3% (Wsj.com, 2022). Current ratio of this organization is around 1.16 and it faces several complex cases during executive operational activities.
London Stock exchange Group
Revenue of the London stock exchange group is around 2444 million GBP in the year 2020 and its sales growth is around 5%. Earnings per share are approximately 1.02 and its growth is more than 0.68 %. Based on this information growth of this company can be highlighted. Shareholders’ equity to asset ratio is approximately 0.4 % and return on total equity is more than 11 % in this organization. Growth of acid around 6% and it has maintained consistent profitability through years.
Apple
Revenue of Apple is around 365817 million US dollars in the year 2021 and its sales growth is around 33.4 %. Earnings per share are approximately 5.61 and growth of EPS is more than 71% in Apple (Wsj.com, 2022). This organization has maintained an effective balance of current assets and liabilities which has executed a current ratio of 1.06 and a quick ratio of 1.02. Equity to total assets is around 7.97 per cent why liabilities to a set are 82 % in the year 2021 of Apple.
Tesla
Revenue is approximately 53800 million US dollars in Tesla and its sales growth is approximately 70%. Tesla has consistently maintained its growth in its equity and its earnings per share is around 4.89 with basic growth of 667 per cent (Wsj.com, 2022). Current ratio of this organization is approximately 1.38 and equity to an asset is more than 48%.
Coca Cola
Sales growth of coca-cola in the year 2021 is around 18% and it has made approximately 38726 million US dollars of revenue from sales. Earnings per share of Coca-Cola is approximately 2.25 and growth is around 25.6 4% (Wsj.com, 2022). Equity to total assets of Coca-Cola is approximately 24% and it has maintained a current ratio of 1.13. Growth of assets in the year 2021 is approximately 8% in Coca-Cola.
Microsoft
Annual revenue of Microsoft in the year 2021 is approximately 1608088 million US dollars with a growth rate of 17%. Gross profit margin of Microsoft is approximately 68% and its earnings per share are around 8.05 however its growth in EPS is more than 39 % in the year 2021. Microsoft has maintained equity to total assets of more than 42% with a current ratio of 2 (Wsj.com, 2022). This organization never face a financial crisis because it has a well-maintained infrastructure of working capital
Nvidia
Nvidia has executed sales growth in the year 2022 is around 61% and maintained a share of 3.85 (Wsj.com, 2022). Based on this it can be said that increase in revenue ensure high performance in market. Other than this, growth in sale is quite preferable fir decision regarding investment
MTN Nigeria Communications Plc
Sales revenue of MTN Nigeria communication PLC is approximately 179361 million ZAR in the year 2020 with a growth of 18 % (Wsj.com, 2022). Earnings per share are more than 9 with a growth of 86.9 per cent in this Company. Liquidity is balanced in this organization because it has maintained a ratio of approximately 1 shareholder to total assets of approximately 28%.
Nestle Foods Plc
Annual sales are approximately 87000 CHF million in the year 2021 in Nestle with approximate growth of 3.25% (Wsj.com, 2022). Net income growth is 13 8% in 2021 with earnings per share of 6.06.
Seplat Petroleum Development Company Plc
This organization faces loss in the year 2020 and sales growth has decreased by 24.3 7% causing financial loss by 14% in this organization (Wsj.com, 2022). Earning per has decreased by 0.10 in this organization in the year 2021 due to covid-19 pendant situation.
Dangote Cement
Dangote Cement is one of the largest cement companies in the world and its annual sales are approximately 1034196 million NGN in the year 2020 with a sales growth of 15.9 8% (Wsj.com, 2022). Average earning per share is approximately 16 and its growth rate is more than 37 % in 2021.
Zenith Bank
Zenith Bank has maintained interest income growth is approximately 1.89 % in the year 2020 and its earnings per share are around 7.34.
Computation and explanations of intrinsic value
DDM
Dividend discount model is used to predict the price of a company’s stock and it is necessary to forecast the dividend based on the current situation. As cited by Huy and Hang (2021), DDM method is used when stocks have a high growth rate and are unable to issue dividends.
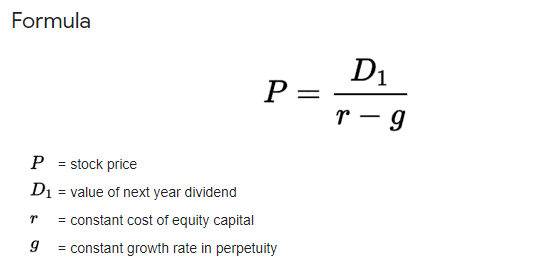
Figure 1: DDM formula
(Source: Huy and Hang, 2021)
CAPM
Capital asset pricing model describes a relationship between expected return and systematic risk of asset of a particular stock (Xu et al. 2019). This method has to identify growth of capital stocks and provides guidance to make appropriate decisions for investment portfolios.
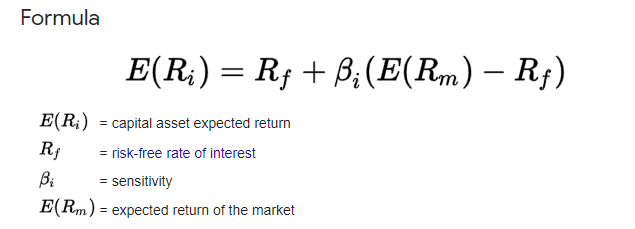
Figure 2: CAPM formula
(Source: Xu et al. 2019)
Technical Analysis
Trend and growth of an organization are identified through technical analysis; it represents graphs of different companies in different metrics. Technological analysis of different companies of different stock exchanges has been analyzed below.
Risk management of investment portfolio
Risk portfolio refers to failing to meet financial objectives through investment in assets and units. Each investment has its own investment risk in terms of financial and non-financial. In this project investment of £1,000,000 for a minimum of 10 years with a minimum 14% return on investment. As argued by Chandrinos et al. (2018), thus it is required to develop an effective strategy to manage risks that exist in investment. Besides that, the investment may be made in three different “global stock exchanges”. The risk management should be considered below discussed strategy to minimise risk.
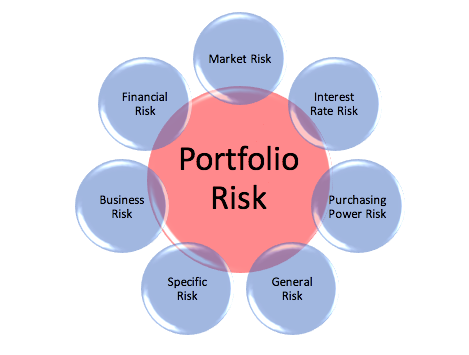
Figure 6: portfolio risks
(Source: Chandrinos et al. 2018)
“Markowitz Portfolio Theory”
Investors should use “Markowitz Portfolio Theory” to manage investment risk along with acquiring more return on their investment. In this theory, five steps should be followed to minimise portfolio risk. That is started with proper allocation of investment that means investors should select the best performing organisation among 15 global companies that are listed in three stock markets. After that, evaluate expected return and standard deviation of that investment that is necessary to perform the next step of readjustment of risk using Sharpe ratio. As opined by Thistlethwaite and Wood (2018), investors may select Treynor ratio instead of sharpe ratio nevertheless, both ratios assist to observe different types of risk in investment and minimise risk through suggesting other investment sources.
Diversification of investment in different sectors and areas
An investor must make their investment through the proper location of investment. As the investor has £1,000,000 to invest. The investment may be made in different sectors such as retail, food and IT industry of three main global stock exchange markets. As argued by Fang and Tan (2019), the investment should be made in the “London Stock Exchange” where different global growing organisations are listed such as “Tesco and AstraZeneca”. Further, the4 investors should consider other business organisations such as “Barclays, Shell and the London Stock Exchange Group”. Nevertheless, these organisations are not well performed as compared with the two mentioned organisations. Besides that, the second stock market may be “New York Stock Exchange”in that market “Apple and Tesla” are the main listed organisations and “Coca Cola, Microsoft and Nvidia” are also listed in this stock market. “Nigeria Stock Exchange” may also be selected to make investments.
Investors should observe the stock market’s best performing organisations like Tesla and Tesco. The investor should overview “MTN Nigeria Communications Plc, Nestle Foods Plc, Seplat Petroleum Development Company Plc, Dangote Cement, Zenith Bank”. As stated by Akhtaruzzaman and Sensoy (2020), the above-mentioned business organisation belongs to different sectors thus investors invest in that business which may acquire a better position in the future business market. Besides that, investment should be considered the market condition of the three stock markets. These steps assist investors to develop effective strategies to invest that investment amount.
Expected return is nothing but an assumed return rate that is calculated based on past returns or the performance of the organisation. Any investor invests their money through a willingness to acquire better return from investment as compared with other sources of investment. As opined by Huy et al. (2021), for this purpose investors have considered top global organisations and growing projects to make investments and asset expected rate on organisation past performance to complete previous projects. In this aspect, investors have assumed that they may get a 14% return on their investment. This return has assisted to monitor investment regularly and taking steps to avoid risk in investment.
Necessity of Measuring Standard Deviations of estimated returns
Analysis of different companies from different stock exchanges highlights that performance of selected companies is competitive in the situation to find the most appropriate investment portfolio. It is necessary for investors to measure the standard deviation of estimated return through which a detailed and in-depth analysis of company performance can be possible (Alfaro et al. 2020). As a measurement of the standard deviation of estimate retains highlight various market volatility which ensures detail underside about performance of a company in market. It also spreads the price of assets to the average price which is essential for higher performance in business.
Risk adjustment performance measures using Sharpe
Sharpe ratio is an additional risk measurement technique that is used to measure extra risk on investment. An organisation should consider this technique to ensure their investment in different sectors. This indicates actual returns on investment after consideration of risk exists in that investment and using standard deviation. As argued by Mishchenko et al. (2018), the higher Sharpe ratio indicates a higher portfolio return on investment or project. As the investors want to acquire a minimum 14% return thus they should consider a sharper ratio before investing. As investors may be investing in three main global markets, they should observe fluctuations in the market share index that assist investors to calculate beta for the investment process. Besides that, investors should calculate risk-free returns through observing past returns on that stock and investment where they want to invest.
Minimise risk through use Treynor ratio
Treynor ratio is a risk adjustment technique that is used to minimise risk and indicate an investment how much return in future after investing in that field. Here the main factor is beta and standard deviation because these two factors indicate how an index in the market moves and fluctuates. As argued by Mishchenko et al. (2018), when an investor invests in multiple projects along with an organisation, they are required to calculate portfolio return that is 14% and “risk-free rate”. The Treynor ratio of investment is calculated through expected portfolio return minus risk-free return and divides the results with portfolio beta.
Portfolio covariance and Investment correlation
Covariance is a measurement and compares mathematical technique that assists an investor to compare two investment securities along with suggesting bet investment among both investments. As investors have considered 15 organisations to make investments thus investors have to compare the expected return of each organisation. As opined by Platanakis and Urquhart (2019), in this aspect, investors are required to observe covariance of investment in that negative results reflect that investment does not give much return whereas result zero when two investments are not related to each other. Besides that, positive results are respected that investment is more preferable to make an investment. Investment correlation is a statistical operation that is used to identify different related factors of investment. This is the last and final volatility discussion that reflects relation through using covariance and ensures their investment at low risk.
Evaluation of the impact of investment risk and exchange rate volatility of a chosen portfolio
Impact of exchange rate
Impact of exchange rate is a direct influence on the investment decision making strategy. Exchange rate shows the relation of the pierce of one country to another country. In order to assess profitability of any investment process, it is critical for the investors to consider the exchange rate in an effective way. In order to show the influence of exchange rate and its impact on investment various risks such as transaction risk, economic risk and translation risk have been highlighted.
Transaction risk in exchange rate generally highlights risk associated with cash flow from investment. The exchange rate fluctuates due to changes in its various factors. As stated by Avdjiev et al. (2019), this leads to an increase in the amount of risk during transactions such as buying, selling or investing. An increase and decrease in exchange rate affected the value of return 0on investment directly. For example, if the value of domestic country of the value of an investment which is made in the foreign country decreases on the date of truncation occurred the total value of return from investment is dressed. On the other hand, economic risks are those risks that are caused due to macroeconomic factors of business such as government policies, exchange rate, political stability, technology factors and social factors.
On analysis of its impact on an investment portfolio, it has been noted that it is a significant risk in a foreign transaction. As the risk is caused due to macroeconomic factors, it has been noted that these factors have a direct impact on the exchange rate of any country. Exchange rate of any country depends on these factors which have an impact on return on investment. In order to compete in the global market, many countries have fixed their exchange rate to boost their financial health and economic stability. In this situation expected return on investment is being affected. As cited by Heroja (2022), this signifies a change in the exchange rate due to external factors of business effect on the profitability of an investment. Transaction risk of another type of economic risk that has a direct impact on return on investment that needs to be considered before making an investment regarding a decision. Due to rapid change in exchange rate difference between the value of investment portfolio and reported figure occurred which affected the return on any investment.
Market risk and its impact
It is a kind of systematic risk that has an impact on the entire market performance. Market risk consists of various kinds of risks such as interest risk, stock price risk and asset price risk and foreign exchange risk. As it has been noted that interest rate is flexible in nature due to this fluctuation in its rate has been recorded. Under these circumstances, it has been analyzed that due to this change return in investment is affected. Interest rate is fixed by the central bank of any country to control monetary policies. In order to minimize market risk and enhance performance in business through better investment strategy it is necessary for business to have a detailed market research and trend line of the company. Based on this strategy a higher rate of return on investment and increasing profitability can be possible. Other than this, as this analysis includes performance analysis of three stock exchanges and its company performance thus, detailed marketing research analysis various risks such as transaction risk and foreign exchange risk through which better risk management can be ensured. As stated by Koijen and Yogo (2018), a change in interest rate has a direct impact on fixed income security such as bonds. Moreover, currency risk and commodity risk has an impact on return on investment and bond.
Commodity risk is a risk that is related to goods services such as crude oil and corn. As per the view of Ngoc Huy (2019), changing price of this commodity has a direct impact on return on investment. On analysis of this risk, it has been noted that these market risks such as interest risk, exchange risk are occurring due to changes in business macro-environment such as geopolitical stability, exchange rate and economic condition of the country.
Foreign exchange risk
Foreign exchange risk is the risk that arises due to fluctuation in currency. As the value of money changes from time to time, Return on investment depends on the value of a currency. Thus, investment value may decrease due to a change in the relative value of a currency. As argued by Sabirov et al. (2021), this kind of rise arises when a country invests an amount other than its domestic country. As it has been noted that the exchange rate fluctuates due to changes in the factors on which it varies, in this situation if the exchange rate is going against the country in which investment has been made, it reduces the amount of return. In this situation, it has been noted that change in the foreign exchange rate influences the value of an investment and its return (Thalassinos and Thalassinos, 2018). Thus it is necessary for investors to have an effective foreign exchange rate on which these risks can be minimized and better returns can be expected.
Conclusion
Based on a whole study of detailed discussion on various companies and their financial performance or has been concluded that various company and their financial position allow assessing a various aspect of business such as profitability and expected return on investment. Analysis of financial performance and various investment risks assist in evaluation and selection of the most appropriate investment portfolio. As this portfolio covers various risks and other aspects such as profitability, it has been further concluded that the portfolio ensures an increase in financial performance of investors. As this study is based on three countries and their stock exchange, a detailed discussion of various countries’ political stability and other macro environments has been considered which allows creating the most profitable investment portfolio.
References
Journals
Akhtaruzzaman, M., Sensoy, A. and Corbet, S., 2020. The influence of bitcoin on portfolio diversification and design. Finance Research Letters, 37, p.101344. Available at: http://yoksis.bilkent.edu.tr/pdf/files/14367.pdf
Avdjiev, S., Bruno, V., Koch, C. and Shin, H.S., 2019. The dollar exchange rate as a global risk factor: evidence from investment. IMF Economic Review, 67(1), pp.151-173. Available at: https://www.bis.org/publ/work695.pdf
Chandrinos, S.K., Sakkas, G. and Lagaros, N.D., 2018. AIRMS: A risk management tool using machine learning. Expert Systems with Applications, 105, pp.34-48. Available at: https://www.researchgate.net/profile/Nikos-Lagaros/publication/324037223_AIRMS_A_risk_management_tool_using_machine_learning/links/5af2a900aca272bf4259e336/AIRMS-A-risk-management-tool-using-machine-learning.pdf
Ennis, R.M., 2020. Institutional Investment Strategy and Manager Choice: A Critique. The Journal of Portfolio Management, 46(5), pp.104-117.Available at: https://jpm.pm-research.com/content/46/5/104.short
Fang, M., Tan, K.S. and Wirjanto, T.S., 2019. Sustainable portfolio management under climate change. Journal of Sustainable Finance & Investment, 9(1), pp.45-67. Available at: https://www.researchgate.net/profile/Mingyu-Fang/publication/327800337_Sustainable_portfolio_management_under_climate_change/links/5bc0b753458515a7a9e32024/Sustainable-portfolio-management-under-climate-change.pdf
Heroja, A., 2022. Exchange Rate Effects on Foreign Direct Investment Decision. . Available at: https://aaltodoc.aalto.fi/bitstream/handle/123456789/112995/bachelor_Heroja_Arttu_2022.pdf?sequence=1&isAllowed=y
Huy, D.T.N. and Hang, N.T., 2021. Factors that affect Stock Price and Beta CAPM of Vietnam Banks and Enhancing Management Information System–Case of Asia Commercial Bank. REVISTA Geintec-Gestao Inovacao E Tecnologias, 11(2), pp.302-308.Available at: http://www.revistageintec.net/index.php/revista/article/view/1667
Huy, D.T.N., Thach, N.N., Chuyen, B.M., Nhung, P.T.H., Tran, D.T. and Tran, T.A., 2021. Enhancing risk management culture for sustainable growth of Asia commercial bank-ACB in Vietnam under mixed effects of macro factors. Entrepreneurship and Sustainability Issues, 8(3), p.291. Available at: https://journals.sagepub.com/doi/pdf/10.1177/1548512917699724b
Kigle, S., Ebner, M. and Guminski, A., 2022. Greenhouse Gas Abatement in EUROPE—A Scenario-Based, Bottom-Up Analysis Showing the Effect of Deep Emission Mitigation on the European Energy System. Energies, 15(4), p.1334.Available at: https://www.mdpi.com/1496122
Koijen, R. and Yogo, M., 2018. The fragility of market risk insurance (No. w24182). National Bureau of Economic Research. Available at: Koijen, R. and Yogo, M., 2018. The fragility of market risk insurance (No. w24182). National Bureau of Economic Research. Available at: https://www.nber.org/system/files/working_papers/w24182/w24182.pdf
Lettau, M. and Madhavan, A., 2018. Exchange-traded funds 101 for economists. Journal of Economic Perspectives, 32(1), pp.135-54.Available at: https://www.aeaweb.org/articles?id=10.1257/jep.32.1.135
Mishchenko, V., Naumenkova, S., Ivanov, V. and Tishchenko, I., 2018. Special aspects of using hybrid financial tools for project risk management in Ukraine. Investment Management and Financial Innovations, 15(2), pp.257-266. Available at: http://www.irbis-nbuv.gov.ua/cgi-bin/irbis_nbuv/cgiirbis_64.exe?C21COM=2&I21DBN=UJRN&P21DBN=UJRN&IMAGE_FILE_DOWNLOAD=1&Image_file_name=PDF/imfi_2018_15_2_25.pdf
Ngoc Huy, D.T., 2019. The Volatility of Market Risk of Viet Nam Stock Investment Industry after the Low Inflation Period 2015-2017. Sch J ApplSci Res, 2, pp.19-25. Available at:https://m.ccnaonline.com/articles/SJASR/SJASR-1-247.pdf
Platanakis, E. and Urquhart, A., 2019. Portfolio management with cryptocurrencies: The role of estimation risk. Economics Letters, 177, pp.76-80. Available at: https://centaur.reading.ac.uk/81734/1/ELs-Blind.Submission.R%26R%5B1%5D.pdf
Reference
Ruiz Pulpon, A.R. and Canizares Ruiz, M.D.C., 2020. Enhancing the territorial heritage of declining rural areas in Spain: Towards integrating top-down and bottom-up approaches. Land, 9(7), p.216.Available at: https://www.mdpi.com/760176
Sabirov, O.S., Berdiyarov, B.T., Yusupov, A.S., Absalamov, A.T. and Berdibekov, A.I.U., 2021. Improving Ways to Increase the Attitude of the Investment Environment. REVISTA GEINTEC-GESTAO INOVACAO E TECNOLOGIAS, 11(2), pp.1961-1975. Available at:https://www.sciencedirect.com/science/article/am/pii/S0040162520310878
Thalassinos, E.I. and Thalassinos, Y., 2018. Financial Crises and e-Commerce: How Are They Related. Available at SSRN 3330169. Available at: https://www.researchgate.net/profile/Eleftherios-Thalassinos/publication/348574718_How_to_Avoid_Financial_Crises/links/6011843ea6fdcc071b95904f/How-to-Avoid-Financial-Crises.pdf
Thistlethwaite, J. and Wood, M.O., 2018. Insurance and climate change risk management: rescaling to look beyond the horizon. British Journal of Management, 29(2), pp.279-298. Available at: https://web.actuaries.ie/sites/default/files/erm-resources/02_Insurance%20and%20Climate%20Change%20Risk%20Management.pdf
Xu, R., Ramachandran, G.S., Chen, Y. and Krishnamachari, B., 2019, October. Blendsm-ddm: Blockchain-enabled secure microservices for decentralized data marketplaces. In 2019 IEEE international smart cities conference (ISC2) (pp. 14-17). IEEE.Available at: https://ieeexplore.ieee.org/abstract/document/9071766/
Kopsidas, O., 2019. From Macro to Micro Economic Analysis in Education of Management of Environmental Goods. Available at SSRN 3501485. Available at: https://www.researchgate.net/profile/Odysseas-Kopsidas/publication/322064971_From_Macro_to_Micro_Economic_Analysis_in_Education_of_Management_of_Environmental_Goods/links/5a420a01aca272d29456fd21/From-Macro-to-Micro-Economic-Analysis-in-Education-of-Management-of-Environmental-Goods.pdf
Christodoulou, A. and Cullinane, K., 2019. Identifying the main opportunities and challenges from the implementation of a port energy management system: A SWOT/PESTLE analysis. Sustainability, 11(21), p.6046.Available at: https://www.mdpi.com/2071-1050/11/21/6046/pdf
Alfaro, L., Chari, A., Greenland, A.N. and Schott, P.K., 2020. Aggregate and firm-level stock returns during pandemics, in real time (No. w26950). National Bureau of Economic Research. Available at: https://www.nber.org/system/files/working_papers/w26950/w26950.pdf
Websites
Londonstockexchange.com, (2022), LIVE-INDEX. Available at: https://www.londonstockexchange.com/ [Accessed on 26th February 2022]
Ngxgroup.com, (2022), LIVE-INDEX. Available at: https://ngxgroup.com/ [Accessed on 26th February 2022]
Nyse.com, (2022), LIVE-INDEX. Available at: https://www.nyse.com/ [Accessed on 26th February 2022]
Wsj.com, (2022), COMPANY PROFILE. Available at: https://www.wsj.com/ [Accessed on 26th February 2022]
tescoplc.com , 2021 annual report Available at: https://www.tescoplc.com/media/757589/tesco_annual_report_2021.pdf [Accessed on 20th march 2022]
………………………………………………………………………………………………………………………..
Know more about UniqueSubmission’s other writing services:
