KL7010 Principles of Data Science Assignment
Introduction
The primary objective of this assignment is to understand the different concepts and foundation of the data science and gain the knowledge and understanding of the different fundamental methods which will be helpful in various statistical methods which helps in analyzing the data or can be said statistical data for the research purposes and which can be done by using various mathematical formulas, by creating different models and by applying the proper techniques for evaluating any given particular data. Different applications of data science will be also evaluated by critically assessing the data by selecting a particular data, summarizing, sorting the data, cleaning the redundancy or any unused information, and then visualizing the data after the development of the statistical data. Various tasks like predicting, decision making, visualizing will also be learned in the assignment. In the R studio, the data set will be imported and linear regression, logistic regression, and the descriptive method will be applied to find out the different prediction and coefficient and correlation of the data.
Foundation of Data science
Data science
The science deals with the huge chunk of data and analyzes and evaluate the data using the latest tools and modern techniques to find out the different hidden patterns in the data, extracting out the information from the unorganized data that makes sense, and helping out the different organizations, and company, institutions to take the correct decisions that helps company to grow their market and earn profits or to any research for finding out the results for particular problems (Zelst et al 2019). It uses the complex algorithms of machine learning to create different models for predicting any particular object. The main objective of data science is to create insights for the different sectors of business and research by analyzing and producing statistical data.
Principle of data science and collection
- Identifying the information that needs to be collected and obtaining the collected data.

Behavioral data
The data shows the behavioral interaction of the customer when they react with the organization and the company. This type of data helps in measuring and analyzing the clients or customer reciprocity communication and improves the overall perforation of the company if the proper methods are applied for it.
Identity data
The data consist of the various demographics of the customers that assist in developing the profile of the customers and play an important role in improving the existing market strategies.
Descriptive data
The data mainly consists of the private information of the individuals that excludes any identifiable data and helps to analyze the client at a base level and develop suitable strategies focusing on providing the appropriate offerings of products and services.
- Evaluating the data for any errors and minimizing the errors from it.
There is always a probability of errors and incorrect information as the data is collected through different sources and it’s very important to have accurate data for creating any planning and strategies.
- Checking the authentication of the origin of the data
To obtain the correct data a proper source is needed that should be considered authentic and has no flaws and that can be done by various techniques like using the analytical tools for the websites, by forming the online surveys and then collective data from there, taking manual feedbacks from the customers by taking interview face to face, data can be also collected by having engagements on the various social media platforms.
- Data collected should be updated and latest.
Data deteriorates over the duration, resulting in inaccurate and wrong conclusions. User information such as email, contact numbers, organizations, professions, and residences change over time (Radensky et al 2018). Even tastes and activities are subject to change over time of circumstances like age, marital status, age, and so on. It is critical at this point to make sure the data acquired is current and relevant.
Lifecycle of data science
Capture: Information Gathering, Data Capture, Signal Processing, and Data Retrieval are all steps in the data acquisition process. This stage entails collecting semi-structured and unstructured data in its raw state.
Maintain: Data Storage, Information Cleansing, Data Management, Data Analysis, and Information Architecture are all points to bear in mind. This stage entails taking the raw data and converting it into a usable format.
Process: Data mining, correlation-based data process, data modeling, and data synthesis are all steps in the process. Data analysts assess the produced data for patterns, patterns, and biases and see if it will be helpful in forecasting.
Analyzation: Exploration of data, Prediction, and Evaluation, Linear regression, Text Analysis, Subjective Analysis are some of the methods that are used to analyze data. This is when the lifespan gets compelling. This stage entails executing a variety of data analytics.
Communicate: Data Accounting, Visualization Of Data, Business Analytics, and Decisions are all things that need to be conveyed. Researchers present the results in readily legible formats such as charts, different diagrams, and presentations in the final step of the results.
Prerequisites
Dealing with data science needs some essential skills that are required for performing different tasks and operations with data and information and for that some concepts should have to be obtained.
Machine Learning
It is considered the backbone support for data science, and for dealing with data an individual needs to have a hold on machine learning and its algorithms and also need to have an idea of statistics.
Modeling
It is an important part of machine learning and assists in forecasting the already known data and it also helps in selecting the appropriate algorithms for testing and training the models for solving the particular problems.
Programming
It is also a vital part of data science and an important requirement for successfully executing projects related to data science. Commonly used programming languages include R, C++, and Python (Crane et al 2018). Python is preferred by most of data analysts for its efficiency and easy learning curve and supports almost all the supporting libraries of machine learning and data science.
Databases
A data analyst needs to have a strong knowledge of database management and should know all the techniques for extracting the data.
Methods and Techniques In Data Science
Statistical methods
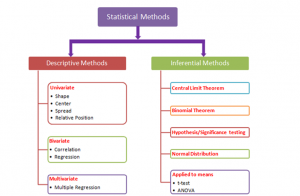
Figure 2: Statistical methods
(Source: https://i.pinimg.com/originals/9e/ab/a1/9eaba16aafe270fe7155549fe1063111.png)
The method of statistical analysis includes various mathematical formulas, various models and the required techniques that are used in the statistical evaluation of the raw data provided for the research. The main objective is to extract important information from the unorganized research data and provide robust results obtaining output from the research results using the various statistical methods (Zecchina et al 2017). There are generally two types of methods used in the extraction and evaluation of the research data; one is Descriptive Statistics and the Inferential Statistics.
Descriptive Statistics
This model of statistical method assists in brief coefficients and summarizing the given set of data and providing the results by representing it in the forms of various graphs and diagrams and help to understand the various functions of the specific information data. The descriptive methods are then divided into two parts which are “Measures of central tendency” which include the function of averaging the data into the “mean, median, and mode”, and the other part is “measures of variability” which uses the standard deviation, maximum and minimum variable, variance and the kurtosis, skewness and describe the diffusion of information data within given set.
Inferential Statistics
Inferential Statistics creates conclusions and predictions about large and huge data by taking into consideration the specimen data from the original source of the data. The method uses the “probability” to reach the actual conclusions. The task of reasoning the various insights from the raw specimen data is called Inferential Statistics (Raschka et al 2018). To work with this statistics method an analyst must have a great grasp on probability and need to understand the definition, multiplication rule, addition rule, and combination. The tools used in this method are hypothesis test, regression analysis, and confidence intervals and very close to the results of the descriptive methods.
The important tools and techniques that are used in data science are:
- Linear Regression
- Non-linear Regression
- “Supported Vector Machines”
- Pattern recognition
- Resampling
- Bootstrapping
- Clustering
- Visualization
- Random forest
Applications of data science in real world
Present-day data science is used everywhere and there is not a single corner where it doesn’t help in various organizations, institutions, IT Companies, research labs and also other various platforms. The applications are
Scam awareness and Risk detection
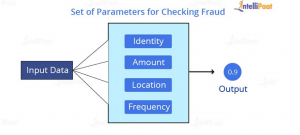
Figure 3: Checking Fraud
(Source: https://intellipaat.com/blog/wp-content/uploads/2019/09/Fraud-Detection-05-05.jpg)
The earliest use of data science was in the banking sector in which it was used to reduce the risk of any bad debts and minimize the loss that was incurred every year. The number of raw data collected in the finance sector was huge and a data analyst was then appointed for analyzing the whole data and using the various machine learning algorithms, they were able to protect the bank from any loan frauds and also it was used to detect the various risks in decision making for investment on various assets (Jablonka et al 2020). In present day it’s also used in detecting fraud in banking medical insurance as the increase in the transaction mostly done online and increase in online frauds, organizations are forced to adapt the data sciences methods for reducing any chance of the scams and frauds. Security uses various authentication systems which are programmed using machine learning and very efficient in detecting any frauds. Common Algorithms used in fraud detection and risk management are Rule-based Approach, Supervised Learning and Unsupervised Learning.
Application in Healthcare
Data science has played an important role in the Healthcare sector and provided various analysis and benefits like:
- Image Analysis
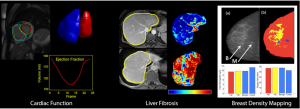
Figure 4: Medical Image Analysis
(Source: https://medicalimaging.medicine.arizona.edu/sites/default/files/image_processing_header_0.jpg)
It analyzes the various medical image and assist in finding different disease in human bodies like finding tumors, organ depiction for finding out using the framework of Mapreduce to detect and analyze the various parameter to find the lung texture and find any irregularity in it by applying methods of machine learning like SVM which is “Support Vector Machines” indexing of the image based algorithms, and also wavelet analysis used reveal the various frequency components received from the signal and “solid texture classification” is also used in various image analysis in three-dimensional textures.
- Drug Development
The process of drug discovery is quite complicated and entails a wide range of professions. The innovative minds are frequently circumscribed by tens of billions in research, as well as significant money and commitments (Calvo-Morata et al 2019). A formal application takes approximately twelve years.
From the first screening of therapeutic compounds through the prediction of the rate of success refers to the biological parameters, machine learning applications and machine learning techniques streamline and simplify this method, bringing a new viewpoint to each step. Instead of “scientific experiments,” these algorithms can predict how the substance will operate in the body using extensive computational models and simulations. The drug discovery and development is quite complex and entails a wide range of professions. The best ideas are frequently circumscribed by billions of dollars in testing, as well as significant money and time commitments.
Targeted Advertising
The advertisements that we see all around the websites, applications and other social media platforms are targeted by analyzing the usage of an individual person and evaluate the interest of a particular person and post the ads on the website or application that we use and also in the offline market. The digital banners, billboards, and other advertisement tools are all decided by the machine learning algorithm.
Internet Search
The backbone of the available search engine at present days is all machine learning and artificial intelligence which helps in finding the results searched by any keywords from the individual. It crawls all over the internet and analyzes the content of the websites available on the website and compares it with the searched keyword and gives output in the form of search results. If there was no data science available, there would be no possibility of the existence of search engines available currently.
Speech Recognition
As it can be seen in the boom in the digital assistance in various platforms and devices that all are powered with machine learning and are products of Artificial intelligence. The algorithms provides ability of recognizing the voice and convert into the language into the language that machines understand provide the desired results
There are also various applications that are powered by data science and most common are Website Recommendations, Route Planning, Gaming, Image recognition, and augmented reality, prediction of weather, disease etc.
Data Collection
This is a process of collecting the data and evaluating the quality of the data by using various standard techniques for validations and the collection of data plays a vital role and important initial step for any research for the different organizations, institutions and companies (Vershynin et al 2018). The collected data can be then evaluated by the data analyst using the hypothesis in most of the cases. The approaches and methods are different for the various fields of research and fully depend on the required data information. There are various methods used for the data collection and that includes the Internet surveys – mail surveys, social media surveys, web surveys. Manual surveys- phone surveys, physical interviews, and multi-mode surveys are used.
Data cleaning
As the data is collected from multiple sources, there is a possibility of the errors and inaccurate information available. It is very important to have correct data for achieving the accuracy in decision making and planning various strategy, any mistake in this can cause huge loss to any individual companies, organization or any individual in their business and it can be extremely dangerous if the data is for medical research and also cause life loss if faulty information is used to conduct the research (Palamuttam et al 2018). This is why the cleaning of the data is very important and the process of data cleaning involves the detection of errors and correcting inaccurate records or any other corrupted information. It also identifies any incorrect, irrelevant or incomplete data and then restores, editing and deleting any redundant data available in the coarse data.
Steps Involved in the cleaning the data:
- Removing any duplicate, irrelevant data and unwanted observation.
- Fixing any structural errors like strange names, incorrect formatting, or any kind of typos are removed.
- Finding the missing data and handling it by putting the correct information.
- Removing any improper data or any other unwanted outliers which helps in increasing the performance of the collected data.
- Validating the data and assuring the quality by removing any dirty data that does not make any sense in the context and the standard should be maintained.
Data Visualization
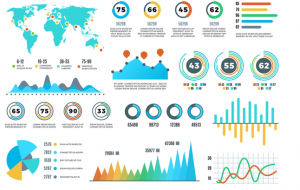
Figure 5: Data visualization tools
(Source: https://neilpatel.com/wp-content/uploads/2021/03/Data-Visualization_Featured-Image-1.png)
It is the digital visualization of data and information in the form of graphical representation using various visual tools like charts, maps, graphs and gives access to the analyst to understand the different patterns, trends and outliers available in the given data. Data visualization is the biggest tool for evaluating and analyzing big chunks of data and helps to make strategies, plans and decisions based on the data . Taking advantage of the various graphs and plotting the patterns of the given data helps us to quickly identify the visuals which are represented by colors (Gui et al 2021). The message can be easily understandable by watching the colorful representation in the graph in which different objects have different colors representing the different aspects of the information. It helps in discovering the various trends in the data, due to its interactiveness any individual can interact with any visual graphs as compared to the traditional table-based data. It also provides the perspective on the given data by displaying its meaning in a much broader aspect and that very easy to explain the whole data process in the visualization.
The data visualization are categorized into 5 types
- Temporal data visualization
- Network data visualization
- Hierarchical data visualization
- Multidimensional data visualization
- Geospatial data visualization
The data can be visualized in the form of charts, graphs, tables, dashboard, infographics and maps.
Statistical inference
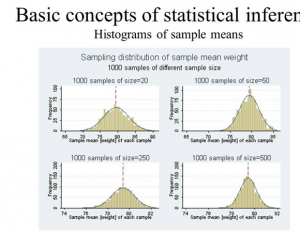
Figure 6: Concepts of Statistical Inference
(Source: https://i.ytimg.com/vi/wxngy12Wg1A/maxresdefault.jpg)
This inference deals with analysis, presentation, collection and the numerical presentation of the data, it is often termed as the “collection of quantitative data”. The main objective of this statistic is to develop an accurate and strong conclusion by taking help of the supplied samples and also helps in forecasting (Keegan et al 2020). Statistical inference is defined as the process of evaluating the output result and creating conclusions from given data subject variation of data randomization. The application of this inference is hypothesis testing as well as confidence interval. The components required for building the this statistics are :
- Flexibility in the specimen sample.
- Sample volume and size.
- Difference observed regarding the size.
“Types of Statistical Inference”
- Hypothesis testing
- Confidence Interval
- ANOVA or T-test
- Pearson Correlation
- Multivariate regression
- “Chi-square statistics and contingency table”
- Bi-variate regression
Predictive modeling
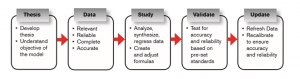
Figure 7: Stages of predicting models
(Source: https://www.rgare.com/images/default-source/kc-article-images/predictive_schematic.png?sfvrsn=170fa088_0)
It is a technique of statistics for forecasting future behavior and mostly used in data analysis. By recognizing the historical and current information of the data then analyzing it develops a model to predict the outcomes of the future. The formulated statistical model is created by collecting the data and the model is generated, the complex information is portrayed by combining different information into the demographic form for achieving the accuracy (Paterson et al 2018). Time series algorithms are used for predicting the time based data and regression algorithms are used to predict the variables that are continuous and available in the data set.
Decision making
Statistical analysis helps in the processing of the collected data and analyzing the given sample data that help in recovering patterns and various trends that assist in predicting the outcomes of the future by which decision making is done and those are considered scientific decisions. Statistical analysis evaluates the data and reports the output results using 5 key steps which are
- Describing the categories of the data that need to be analyzed
- Finding the relation and exploring the data for the primary population.
- Building a model for understanding the underlying population data relationship.
- Validating the model by objectictifying or approving.
- Generate the scenarios for predicting analytics.
Analysis of given Scenario
In the given dataset for the students grades which includes the properties like school, sex age, free time, study time, go out time data related to failures, passing, absence etc, the descriptive method is used to analyze, predict and summarize the data and for finding out various properties the linear regression and logistic regression is applied to the dataset (Bühler et al 2018).
Descriptive method applied on the dataset :
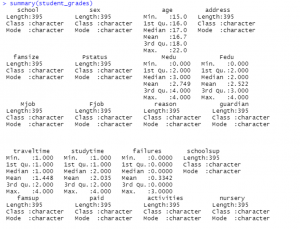
Figure 8: Summary of student’s grades
(Source: Self created in the R studio)
Using the descriptive method the summary of the dataset is created as it can be seen in the figure 8 and 8_1 and its shows the value of length, class, min, median, mode, and also calculated the data of first quadrant and third quadrant which helps in analyzing the data for the decision making. The above data has been extracted from the data set using R studio.
Figure 8_1: Summary of student’s grades
(Source: Self created in the R studio)
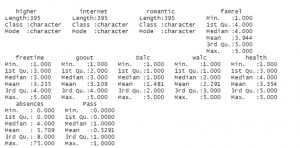
Figure 9: Basic stats of data
(Source: Self created in the R studio)
In the above image it can be seen that it’s showing the basic descriptive statistics of column travel time, study time and free time. It shows the number of observations, missing values and the “Measures of central tendency” is used for calculating the mean, media, mode, LCL Mean and UCL mean. Skewness shows the value of distortion in the dataset, and kurtosis calculates the degree of the cluster in the data.
For plotting the data jitter has been used for analyzing the data and representing it into the form of graphs as you can see in the figures below.
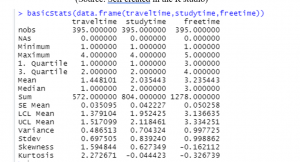
Figure 10: Plotting the travel time
(Source: Self created in the R studio)
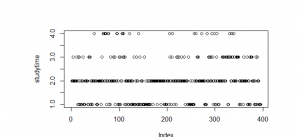
Figure 10: Plotting the study time data
(Source: Self created in the R studio)
Linear regression applied on the dataset:
Linear Regression
In linear regression is a supervised learning model which uses the “least square method” for calculating the regression which are called residuals and errors and drawn in a graph and shown as a dotted plot, which shows the distance between the data points (Kłosowski et al 2019). The dataset is divided into ‘x’ which is an independent variable and ‘y’ is a dependent variable or an output variable. In the data set study time is independent variable and failure us dependable variables
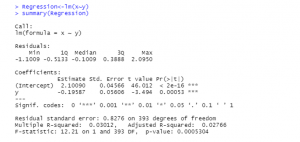
Figure 11: Linear Regression summary
(Source: Self created in the R studio)
Figure 11 shows the analysis of the linear regression of the by using the formula of lm(formula = x~y), it gives output of residuals which have values of mean median max and first quadrant and third quadrant. And also shows the coefficients of the values (Murphy et al 2021). The independent variable is study time shows the prediction of failure rate, and in the estimate it can be seen that the chance of failure is very low if compared to the study time and the negative set of the dependent variable shows the failure estimate. The residential standard error shows the estimated correlation of practical value of change of variable and for the more collection of data is needed for the analysis as the value is significantly low.
By using various plots it will be important
to understand the statististics that have been generated by applying linear regression in the dataset.
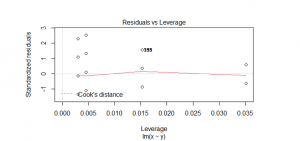
Figure 11_1: Linear Regression residual vs leverage plot
(Source: Self created in the R studio)
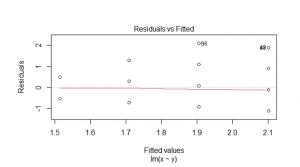
Figure 11_2: Linear Regression residual vs fitted plot
(Source: Self created in the R studio)
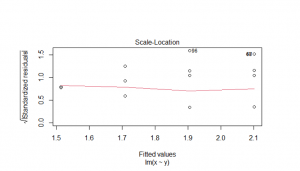
Figure 11_3: Linear Regression scale-location plot
(Source: Self created in the R studio)
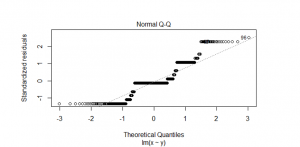
Figure 11_4: Linear Regression Normal Q-Q plot
(Source: Self created in the R studio)
Logistic regression applied on the dataset :
Logistic Regression is applied to determine the relationship between the independent variable which is sex and dependendable variable which is age and by using the equation of the logistic regression. It is applied in the dataset to predict the age gap according to the gender and forecast the likelihood even for making the choice.
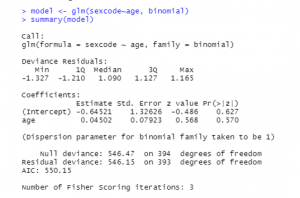
Figure 12: Summary of the model
(Source: Self created in the R studio)
In the above figure it can be seen the summary of the model is listed, the model is created by splitting the two variables one is independent and one is dependent, it shows the calculation for coefficients, With the help of data visualization it will be very helpful to understand all these values.
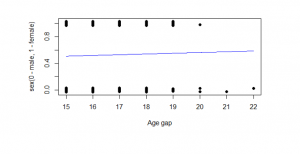
Figure 13: Age gap plot
(Source: Self created in the R studio)
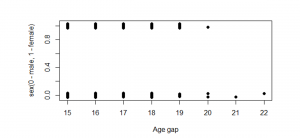
Figure 13_1: Age difference plot
(Source: Self created in the R studio)
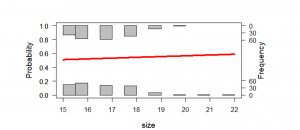
Figure 13_2: Probablity plot
(Source: Self created in the R studio)
Ethical Issues
Basically, there are three major ethical provocations which are related to data science as well as data: the reinforcement of peoples basis, unfair discrimination and lack of transparency. The ethical challenges are briefly describes as follows;
Unfair discrimination
If the data reflects the social biases which are unfair against the sensitive attributes like gender or race, then the intrusion from the data which might be based on the bias which are said.
Lack of transparency
In this section there are two locations that require transparency. In addition, the primary step is the process of step by step, parameters and its models by which a prediction is built. Additionally, depending on the used model this can become very hard as the functioning for extracting certain models such as the “neural network” is still not clear. As well, the other one is it remains not clear which data is being applied in prediction making. Additionally, the statistics models cannot differentiate among the power predictive of particular variables and that bunch of variables.
Reinforcement of human bias
This type of problem may make an appearance when different types of computer models are worn in the process of prediction making inb areas including financial loans, insurance, and policing. As well, if the members of an unquestionable racial team have historically been more parallel to the default or have been convicted of a violation.
Reference
Journals
Alonso-Fernandez, C., Calvo-Morata, A., Freire, M., Martinez-Ortiz, I. and Fernández-Manjón, B., 2019. Applications of data science to game learning analytics data: A systematic literature review. Computers & Education, 141, p.103612.
Archibald, M.M., Ambagtsheer, R.C., Casey, M.G. and Lawless, M., 2019. Using zoom videoconferencing for qualitative data collection: perceptions and experiences of researchers and participants. International Journal of Qualitative Methods, 18, p.1609406919874596.
Berti, A., van Zelst, S.J. and van der Aalst, W., 2019. Process mining for python (PM4Py): bridging the gap between process-and data science. arXiv preprint arXiv:1905.06169.
Crane, H., 2018. The Fundamental Principle of Data Science.
Fiesler, C., Beard, N. and Keegan, B.C., 2020, May. No robots, spiders, or scrapers: Legal and ethical regulation of data collection methods in social media terms of service. In Proceedings of the international AAAI conference on web and social media (Vol. 14, pp. 187-196).
Gui, J., Sun, Z., Wen, Y., Tao, D. and Ye, J., 2021. A review on generative adversarial networks: Algorithms, theory, and applications. IEEE Transactions on Knowledge and Data Engineering.
Jablonka, K.M., Ongari, D., Moosavi, S.M. and Smit, B., 2020. Big-data science in porous materials: materials genomics and machine learning. Chemical reviews, 120(16), pp.8066-8129.
Karpatne, A., Atluri, G., Faghmous, J.H., Steinbach, M., Banerjee, A., Ganguly, A., Shekhar, S., Samatova, N. and Kumar, V., 2017. Theory-guided data science: A new paradigm for scientific discovery from data. IEEE Transactions on knowledge and data engineering, 29(10), pp.2318-2331.
Kery, M.B., Radensky, M., Arya, M., John, B.E. and Myers, B.A., 2018, April. The story in the notebook: Exploratory data science using a literate programming tool. In Proceedings of the 2018 CHI Conference on Human Factors in Computing Systems (pp. 1-11).
Lawonn, K., Smit, N.N., Bühler, K. and Preim, B., 2018, February. A survey on multimodal medical data visualization. In Computer Graphics Forum (Vol. 37, No. 1, pp. 413-438).
Loomis, D.K. and Paterson, S., 2018. A comparison of data collection methods: Mail versus online surveys. Journal of Leisure Research, 49(2), pp.133-149.
Mehta, R., Sahni, J. and Khanna, K., 2018. Internet of things: Vision, applications and challenges. Procedia computer science, 132, pp.1263-1269.
Murphy, K.R., 2021. In praise of table 1: The importance of making better use of descriptive statistics. Industrial and Organizational Psychology, 14(4), pp.461-477.
Nguyen, H.C., Zecchina, R. and Berg, J., 2017. Inverse statistical problems: from the inverse Ising problem to data science. Advances in Physics, 66(3), pp.197-261.
Palkar, S., Thomas, J., Narayanan, D., Thaker, P., Palamuttam, R., Negi, P., Shanbhag, A., Schwarzkopf, M., Pirk, H., Amarasinghe, S. and Madden, S., 2018. Evaluating end-to-end optimization for data analytics applications in weld. Proceedings of the VLDB Endowment, 11(9), pp.1002-1015.
Raschka, S., 2018. MLxtend: Providing machine learning and data science utilities and extensions to Python’s scientific computing stack. Journal of open source software, 3(24), p.638.
Romaniuk, A.V., Romaniuk, V.A., Sparavalo, M.K., Lysenko, O.I. and Zhuk, O.V., 2020. Synthesis of data collection methods by telecommunication airplatforms in wireless sensors networks.
Rymarczyk, T., Kozłowski, E., Kłosowski, G. and Niderla, K., 2019. Logistic regression for machine learning in process tomography. Sensors, 19(15), p.3400.
Schmidt, A.F. and Finan, C., 2018. Linear regression and the normality assumption. Journal of clinical epidemiology, 98, pp.146-151.
Vaswani, N., Chi, Y. and Bouwmans, T., 2018. Rethinking PCA for modern data sets: Theory, algorithms, and applications [scanning the issue]. Proceedings of the IEEE, 106(8), pp.1274-1276.
Vershynin, R., 2018. High-dimensional probability: An introduction with applications in data science (Vol. 47). Cambridge university press.
Wang, Z., Sundin, L., Murray-Rust, D. and Bach, B., 2020, April. Cheat sheets for data visualization techniques. In Proceedings of the 2020 CHI Conference on Human Factors in Computing Systems (pp. 1-13).
Know more about UniqueSubmission’s other writing services:
