LD7084 Assignment Sample – Database and Analytics Principles 2022
Section-1
1. Designing a logical data model
There are number of architectures used for designing a data model like entity relationship diagram and Data matrix etc. The entity relationship Diagram is one of the famous models which is used widely (Y. Hiyane., 2020). This ERD model contains number of shapes and symbols for providing details of model. The entities, attributes and the relationship between the entities are represented using various symbols. The Entity Relationship Model has number of relationship such as
- One to One
- One to Many
- Many to Many
These relationships are represented using various symbols for better understanding. There are more number of rows and columns in the table. The entity in ERD model represents a place, person and any other objects which is going to collect and store multiple instances of the data. This entity also contains identifier which is used to make unique identification of the entity.
The relationship of the ERD model can be represented using Cardinality and Modality Indicators. These indicators are used to provide the business rules of a relationship (Bernhard Möller., 2015). The cardinality is used to indicate the maximum number of times an instance in one particular entity can be associated with the instance in the other entity.
Modality is used to specify the number of times an instance in one entity can be associated with one instance that can be associated with the instance in the related entity. The crow’s foot notation symbols are used to represent the cardinality which are
One and Only One
One or many
Zero or One or many
Zero or One
The following symbols are used to provide the relationships
This symbol is used to represent the One and Only One relationship for entities.
This symbol is used to represent the One or Many relationship for the entities.
This is used to specify the Zero or One or More relationship between or among the entities.
This is used to represent the Zero or One relationship using crow’s foot notation.
The logical model is used to provide the detail explanation about the process using diagram. Each component in ERD model can be represented with some specified symbols. The relationships are mentioned using this Crow’s foot notation where the user can get better understanding about the data flow and the process.
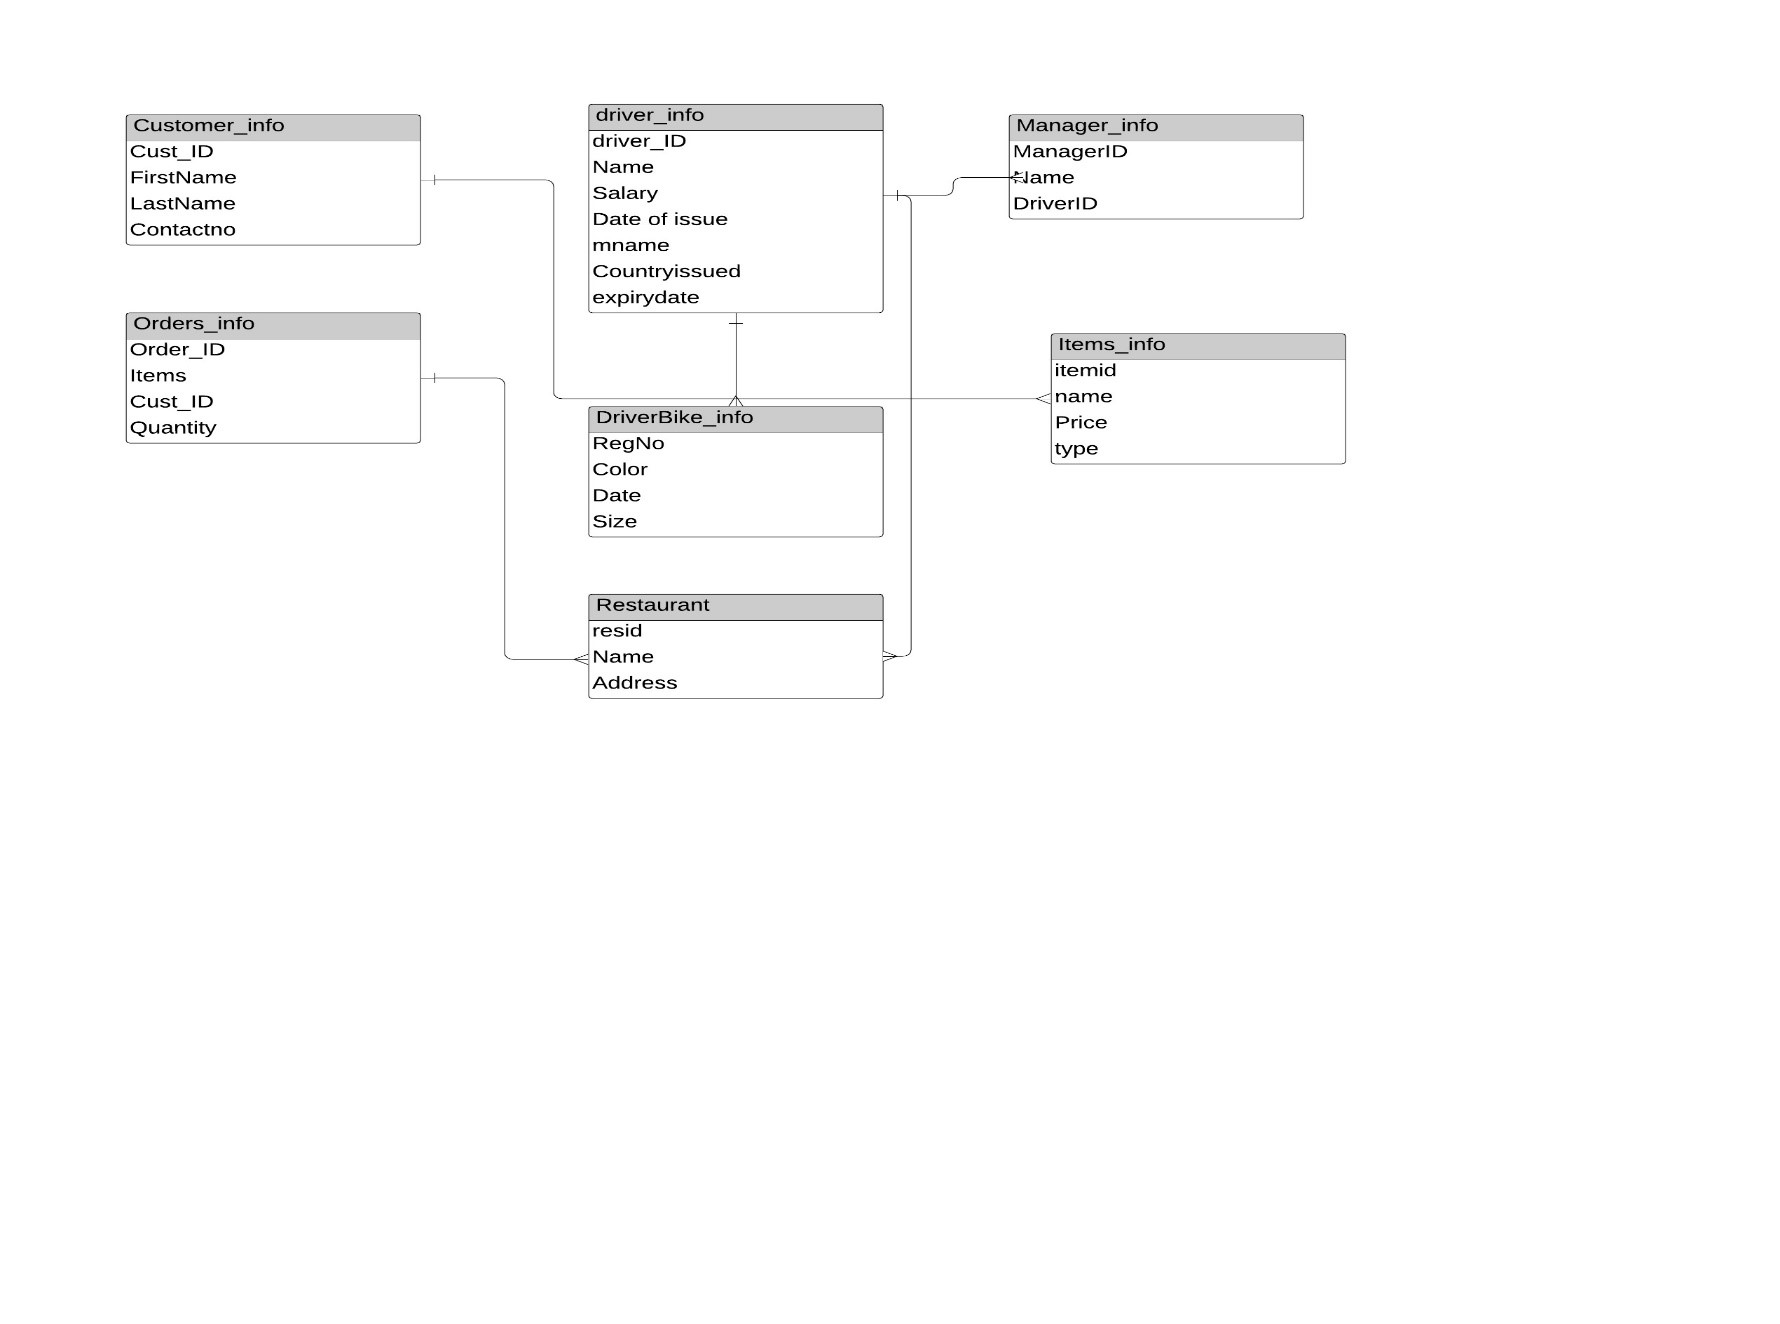 Fig No:1.1 Logical Data Model for WeDeliver
This diagram represents the Entity Relationship diagram for WeDeliver App. The entities involved in this process are Customer, Order, restaurant, driver, driver bike, manager and items.
2.a) DDL commands in SQL
The SQL supports the Data Definition Language which are used to provide various commands to process with database (Hasan Ali Idhaim., 2019). This DDL provides the following commands like
CREATE
DROP
ALTER
TRUNCATE
RENAME
All these commands are used to create and modify the database with flexible manner. Each command has some specified syntax which helps to make the changes in the database.
The CREATE command is a common one which helps to create the new database. The DROP command is helped to delete the specified object. This object may represent the table or database. The ALTER command is used to alter the existing structure of a database. The TRUNCATE command is used to remove the particular record from the database. The RENAME command is used for renaming the objects in database.
Creation of Tables for WeDeliver Databases
- Creation of customer table
CREATE TABLE customer (
customerno INT(10) UNSIGNED AUTO_INCREMENT PRIMARY KEY,
firstname VARCHAR(30) NOT NULL,
lastname VARCHAR(30) NOT NULL,
email VARCHAR(50),
phoneno INT(10) NOT NULL
)
Table structure for table customer
Column Type Null Default
Customerno int(10) No
firstname varchar(30) No
lastname varchar(30) No
email varchar(50) Yes NULL
phoneno int(10) No
- Creation of Driver Table
CREATE TABLE driver(
name varchar(25) NOT NULL,
salary INT(6),
email varchar(30),
mname varchar(25),
DLicenseNo int(10) NOT NULL,
issuedate date,
issuecountry varchar(20),
expirydate date)
The above table has been altered to add driverid.
ALTER TABLE driver ADD driverid int(10) PRIMARY KEY
- Creation of Driver motor bike details
CREATE TABLE Dmotorbike(
Regno int(15) PRIMARY KEY,
color CHARACTER(10),
purchasedate date,
size varchar(10))
- Creation of manager table
CREATE TABLE manager(
mid INT(10) PRIMARY KEY,
mname varchar(25),
driverid int(10),
FOREIGN KEY(driverid) REFERENCES driver(driverid))
- Creation of orders table
CREATE TABLE Orders (
OrderID int NOT NULL PRIMARY KEY,
Orderdate date,
items varchar(20),
customerid int(10),
quantity int(10),
FOREIGN KEY (customerid) REFERENCES customer(customerid)
);
- Creation of item table
CREATE table items (
itemid int(10) PRIMARY KEY,
name varchar(20),
type varchar(20),
price int(10));
- Creation of Restaurant Table
CREATE table restaurant (
resid INT(10) PRIMARY KEY,
name varchar(20),
address varchar(50));
2.B)DML COMMANDS
The DML stands for Data Manipulation language which contains common SQL statements like SELECT, INSERT, UPDATE and DELETE. The DML commands are used to provide various advantages like storing data, modifying data, deleting data and retrieving data. These commands are used to make changes in the databases. For each command, there is a specific syntax for implement the changes. Every command in SQL has the specific functional process. Those are
SELECT command is used to fetch the data which is stored in the databases
INSERT command is used to add new values to the databases
UPDATE command is used to update the existing data with present data which is inside the database
DELETE command is used to remove the values from the databases
MERGE command is used to join two or more tables
Population of Tables using Insert statements
Bike Information
Registrationno colour dateofpurchase enginesize
12345689 blue 2020-12-15 120cc
25425467 blue 2020-09-08 120cc
234785683 green 2020-02-12 100cc
352794959 black 2020-05-13 100cc
1234858254 black 2020-05-13 150cc
1421235671 black 2020-07-14 110cc
Manager Table
SELECT * FROM `manager`
mid mname driverid
12344 Catherine 567444766
13245 Andrew 456476675
124124 philip 567444763
214144 catherine 567444766
214412 Andrew 132184689
Items table
Table structure for table items
Column Type Null Default
itemid int(10) No
name varchar(20) Yes NULL
type varchar(20) Yes NULL
price int(10) Yes NULL
Orders Table
SELECT * FROM `orders`
OrderID Orderdate items customerid quantity
12367 2021-03-09 Iccream,Mushroomdry 6 2
23675 2021-03-08 Garlic Bread 3 1
123145 2021-03-08 Garlic Bread 1 2
123345 2021-02-08 Iccream,Ginger Bread 10 2
123467 2021-04-01 MushroomDry 5 1
127.0.0.1/wedeliverdb/restaurant/ http://localhost/phpMyAdmin/sql.php?server=1&db=wedeliverdb&table=restaurant&pos=0
5 rows affected.
Showing rows 0 – 4 (5 total, Query took 0.0017 seconds.)
UPDATE `restaurant` SET `address` = ’32/1B, TNagar’ WHERE `restaurant`.`resid` = 123123; UPDATE `restaurant` SET `address` = ’45 Gerscgt Spot’ WHERE `restaurant`.`resid` = 123141; UPDATE `restaurant` SET `resname` = ‘Yellow Hut’, `address` = ’29, Andrew Road’ WHERE `restaurant`.`resid` = 343434; UPDATE `restaurant` SET `resname` = ‘Kurinchi’, `address` = ‘342 Renga Street’ WHERE `restaurant`.`resid` = 1231243; UPDATE `restaurant` SET `resname` = ‘Hot Spot’, `address` = ’45 flory road’ WHERE `restaurant`.`resid` = 12837547;
SELECT * FROM `restaurant`
resid name address
123123 Tony Guy 32/1B, TNagar
123141 NIce Spot 45 Gerscgt Spot
343434 Yellow Hut 29, Andrew Road
1231243 Kurinchi 342 Renga Street
12837547 Hot Spot 45 flory road
3) 5 DML Statement for providing valuable insights from WeDeliver using SQL Queries
a. A statement involving a self-join.
Ans: SELECT s.itemid, s.type FROM items AS s, items ss WHERE s.itemid=ss.itemid
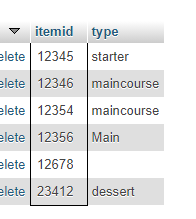
b. A statement involving an equi-join
Ans: SELECT * FROM `orders` WHERE OrderID=123345

- A statement involving at least one group function
Ans: SELECT SUM(quantity) FROM `orders`
c.A statement involving at least one subquery.
SELECT itemid,price from items WHERE itemid=(SELECT itemid FROM items where itemid=’12345′)

d.A statement involving null values.
Ans: SELECT * FROM `items` where price IS null

Section 2
1. Data warehouse Modeling
Data warehouse is providing support for managing the data using data management system. The data in warehouse is used for analytics. The large data can be used for analyzing the and producing the useful insights from the data bases. The SQL commands are used to extract the required information from the database. There are number of technologies used to extract the information from data warehouse. The warehouse provides supports to store all the historical data which are required for decision making.
Kimball’s four step process
The Kimball’s four step modeling is used for data modeling. This modeling methods are useful for business process to get the business values in a speed manner. This provides the normalization concept for providing better information with more accuracy. The high performance can be reached by using this Kimball’s four step process. those are
Step-1: Selecting a Business process to model
Step-2: Decide on the grain
Step-3: Find the Dimensions
Step-4: Find the facts
Selecting the business process to model
This is the initial step of data modeling for business. This includes all the business functioning for business. All the processes are noted and data can be collected for further analysis. The business organization can have more number of functions where huge amount of data is produced.
Decide on the Grain
This is used to decide the level of data which is stored in fact table. The atomic level is mostly preferred. This can split the data into more smaller parts. All the data which are collected from business functioning is stored using this atomic level type.
Find the Dimension
This is used to provide the information by analyzing the data which is stored in databases.
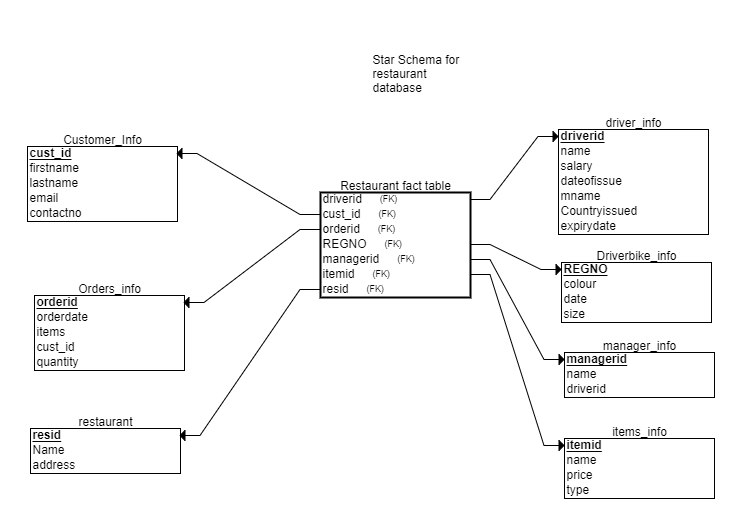
Fig No: 2.1 Star Schema for WeDeliver
This picture provides the star schema for WeDeliver. The star schema is known as database schema This provides the facts and the relationships. This is the simple style which helps to develop the data warehouse and dimensional data mart. This is used for providing results with better performances. This is used to remove the bottlenecks of normalized data, improves the query speed and provides the results based on that. This star schema is used to represent the multi-dimensional data model. This process is useful to separate the business process data from facts.
This diagram specifies the restaurant fact table as the center of star schema. This fact table includes the following attributes like primary keys of all the tables involved in this WeDeliver process. There are number of tables uses in this schema such as customer details, order information, restaurant, items info, manager, driver info and driver bike details.
Section 3
Data Mining
Data mining methods are used for extracting useful insights from the large dataset. The methods of data mining is broadly classified into two types (Priyanka H U., 2019). Those are supervised learning methods and unsupervised learning methods. The supervised learning methods are trained with the dataset for accurate prediction. The powerful methods of supervised classification is used for heart failure prediction which is mentioned in this section. Those methods are
- Logistic Regression
- K Neighbors Classifier
- SVM
These methods are supervised learning methods which consist both classification and regression methods for classifying the data. The difference between the classification and regression is simple that the categorical data classification is done by using the classification algorithms where the numerical data is classified using regression methods (Wayne C. Levy., 2014).
The above algorithms are used for analysis of given dataset.
- Reading the dataset

This picture provides the details of reading the heart failure dataset. The data in the dataset is stored in CSV file format. All the values in this dataset is separated using comma. The python code provides the support for dataset loading process.
- Information about dataset
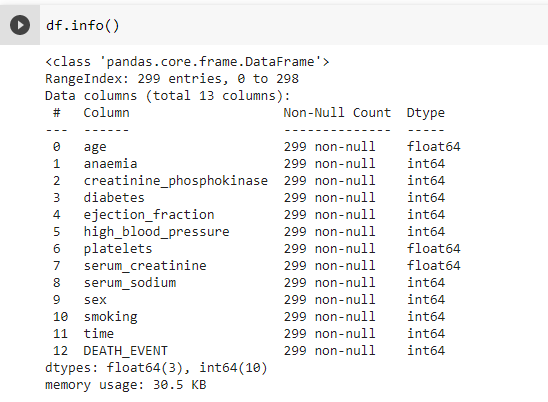
This picture is used to provide the details of dataset. The provided details are used to collect the data and store it in dataset. This heart failure dataset contains 12 attributes.
- Checking for missing values
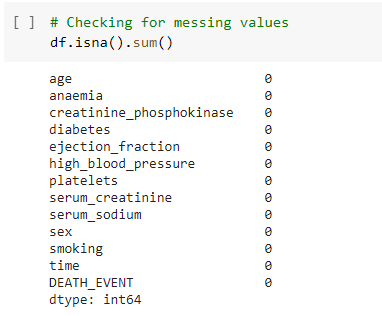
This is the next step of machine learning process. This represent the data preprocessing methods which are used to enhance the data. this process is used to find the missing values in the dataset. The objective of using data pre-processing is providing good results in this prediction. The impure data and the missing values can affect the prediction percentage. To imporve the accuracy, the missing data values can be deleted from this dataset.
Dimensions of dataset

This command is used to provide the dimensions of dataset which is used for this prediction process. The results showed that there are 203 death records ad 96 normal records are in the heart failure dataset.
- View of categorical values
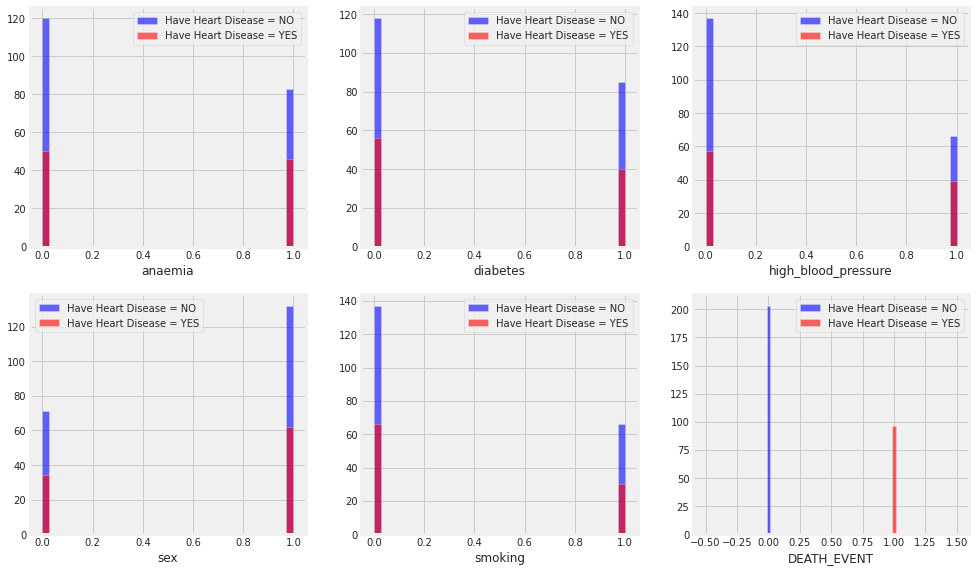
Fig No:3.1 view of categorical data in heart failure dataset
This picture provides the graphical representation of dataset. The main attribute in this dataset are taken for this graphical representation. From 12 attributes, the anemia, diabetes, high blood pressure, sex, smoking and death event attributes are considered for prediction analysis. These values are consisting data values in categorical format which means these attributes are having yes and no values.
- View of continuous Variables
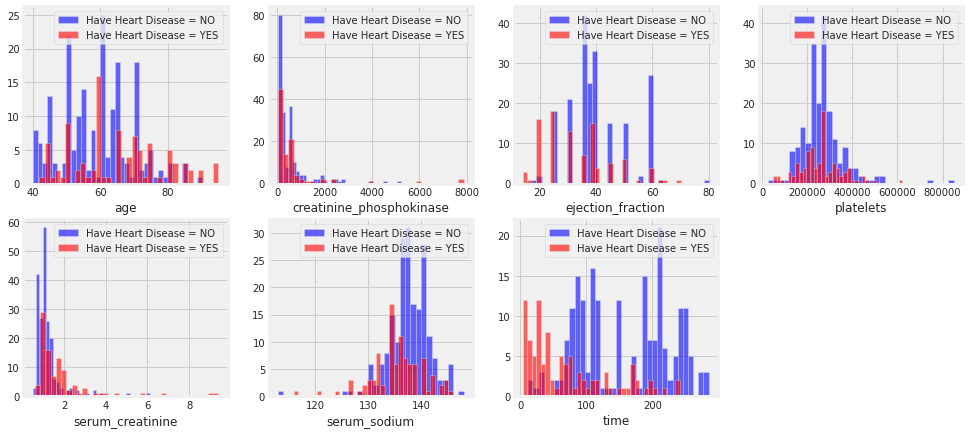
Fig No: 3.2 View of Numerical data variables in heart failure dataset
This picture provides the numerical value attributes which are in the heart failure dataset. This dataset contains both categorical and numerical dataset. The age, creatinine_phosphokinase, ejection_fraction, platelets, serum_creatinine, serum_sodium and time attributes contain numerical values for analysis.
- Target class visualization
The prediction methods of machine learning are used to analyze the dataset using two different processes. Those are training and testing. The classification methods are used for prediction analyses which are trained with dataset with class label. The logistic regression, K-Nearest Neighbour and support vector machine method is used for classifying the data records based on the class label. The logistic regression is the classification method which is used for handling the numerical values for classification. The N-Nearest Neighbour is the classification method which is used to predict the Neighbour values based on k-value. The support vector machine method is used to
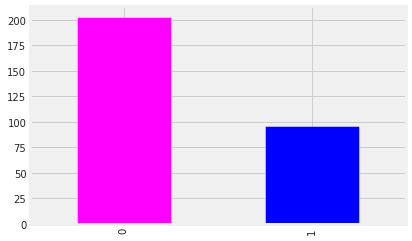
Fig No: 3.3 Visualization of target Class
- 0-No Death
- 1-Indicates Death Event
This bar chart represents the death and no death event of heart failure dataset.
- Correlation Matrix of all variables
The correlation matrix provides the table which represents the coefficient between variables. Every cell in the correlation matrix table provides the relationship between the two variables. This method is useful for summarizing data. This also helps to make advanced analysis using data and provide better prediction using that. each cell represents the liner relationship between the variables. This table can be views as the scatter plotter which consists of rows and columns.
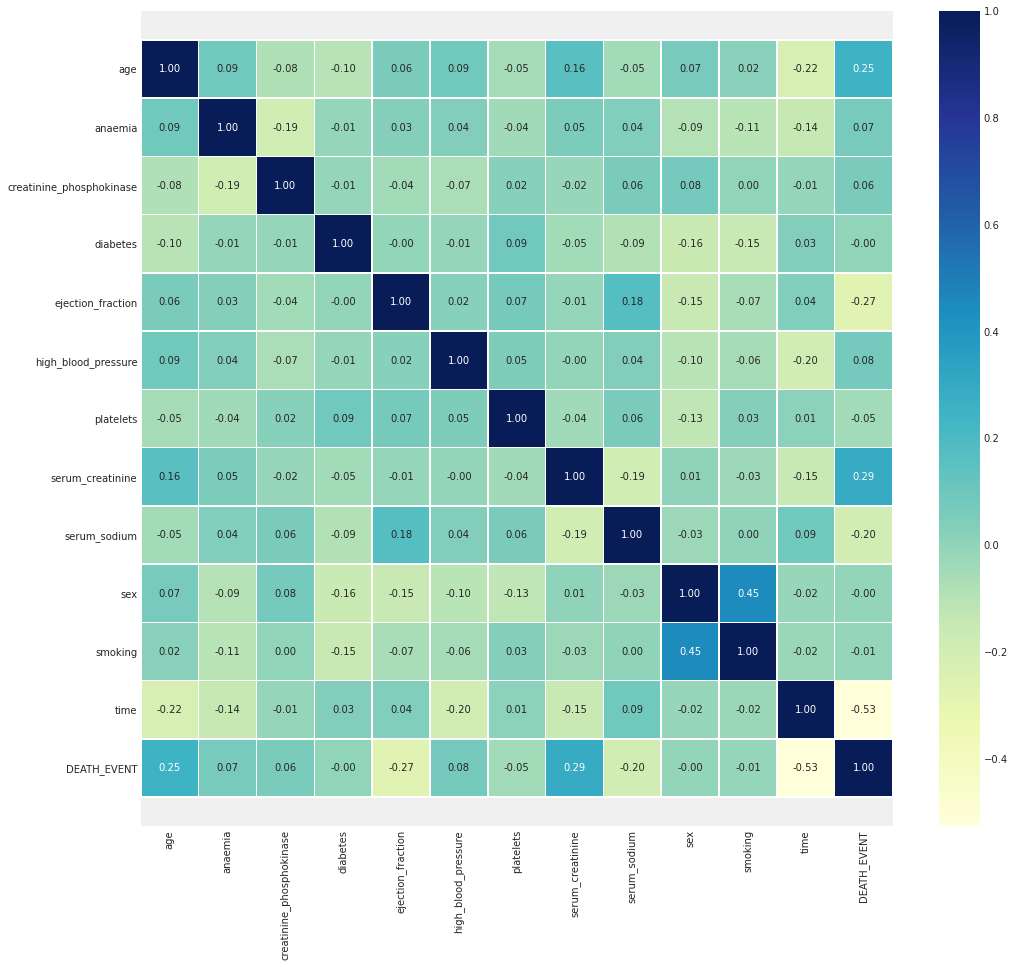
Fig No: 3.4 Correlation matrix of all variables in dataset
This is the correlation matrix table which includes all the 12 attributes in the heart failure dataset.
- Correlation with target variables
This correlation with target variables is using measure of extend to which the variables are related with each other. This can be predicted using the correlation analysis. If the change in one variable reflects the changes of other variable is known as correlation. If the impact is high, then they have high correlation values. If they have small impact then the correlation values are also less.
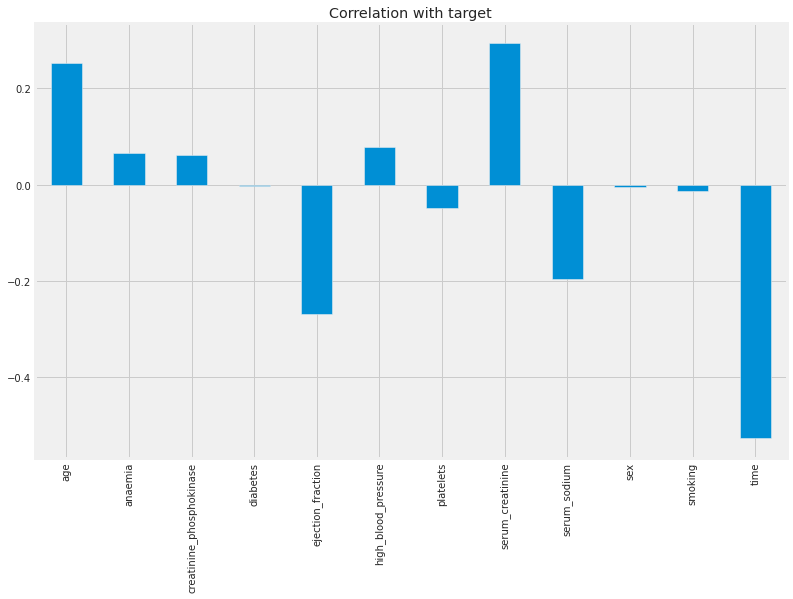
Fig no: 3.5 Correlation with target values
This picture represents the correlation of target values in the heart failure prediction using machine learning methods. In this analysis age and serum_creatinine have the high correlation values in the correlation matrix table.
- Model Results
The comparative analysis is done for analyzing the performance of three different classification methods in the prediction of heart failure. The evaluation is based on two metric like training accuracy and testing accuracy.

The classification methods are need be trained with dataset. so the total dataset is splitted into two part. The ratio of splitting the dataset is 8:2. This represents that 80% of data is used for training process. Then the remaining 20% of data is used for testing the model efficiency (V. Poornima., 2018). The selected classification methods are involved in the training process and their prediction accuracy is noted.
The logistic regression method achieved 87.08% of accuracy, K-Nearest Neighbour Method achieved 77.03% of accuracy and support vector machine method reached 100% training accuracy. The testing accuracy os used to provide the efficiency of classification model. In testing process, the logistic regression reached 75.56% accuracy, K-Nearest Neighbour method reached 55.56% accuracy and support vector machine achieved 58.89% of accuracy. From this analysis it is proved that the logistic regression method reached highest accuracy among others.
Section-4
Business Intelligence
1. Data integrity checks
Data Interpreter in tableau helps to clean the data. It detect things such as header, footer, notes, empty cells so on, omits them and identifies the actual values and fields in the dataset.
2. Warranty End Data
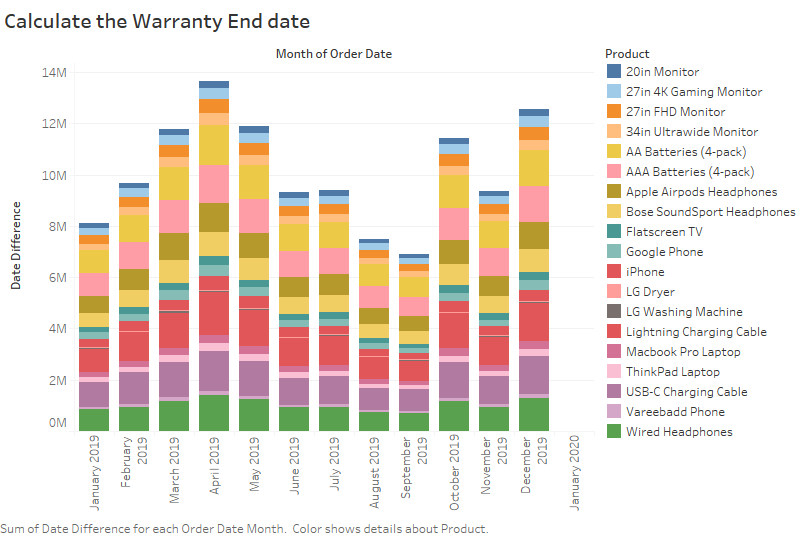
Fig No: Warranty End Date
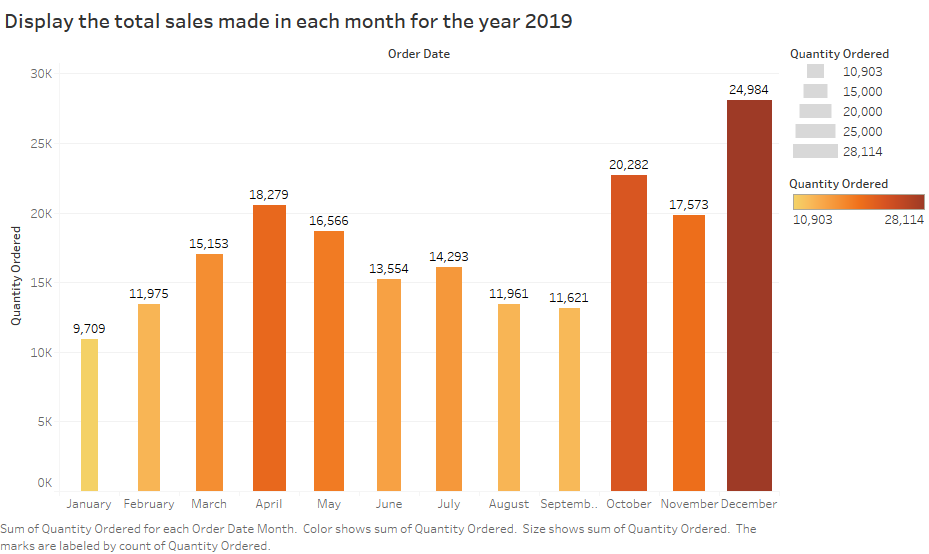
3. City with highest sales

Fig No: Result-City with highest sales value
4. All the cities which generated sales more than $3000000 in the year 2019

5. Displaying the top selling products for the year 2019

6. Total sales in the year 2019
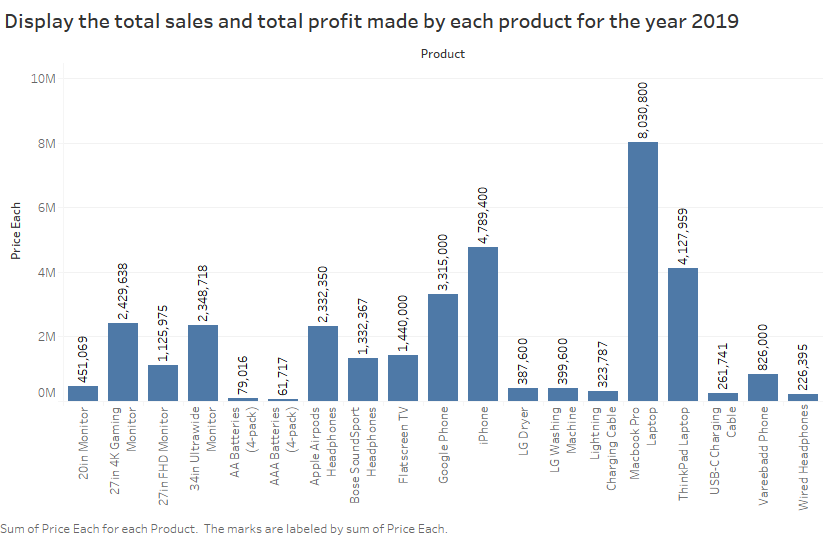
7. Total sales and total profit of each product in the year 2019
8. Maximum sales generated in Boston, Los Angles, Seattle and New york

9. Dashboard of Results

Section-5
NoSQL database
For a startup company, the suggestion of database method is using NoSQL. This supports the semi-structured and unstructured data, agile database schema and Distributed process. This NoSQL provides high availability and scalability. The NoSQL database handles indexing of unstructured text for analysis. The traditional methods of database are supporting the storage of structured data.
But the modern technologies support the storage of different data like text, images, videos and audio. This NoSQL supports the better analysis which covers all kind of data and the outcome of this analysis is helpful for business organization in decision making.
This NoSQL has the ability to handle the change over time. In case the structure of data is changed, the NoSQL supports the adaptation of new structure to store the data. This will be more helpful for business organizations to adapt new technologies to store all kind of data. SQL is the powerful language which supports the query processing in RDBMS.
Advantages of NoSQL
The NoSQL provides more advantage in data storage and data retrieval process. Those are
- Schema with schemaless database
- Dynamic Schema
- Nested Objects Structure
Increment procedures - Index able Array characteristics
- Scaling out
- Less management
- Flexible data models
- Summarization of data
- Financial benefit
- Language support
These are the main benefits of selecting the NoSQL for business organization. The complex multi table joining in SQL is more difficult in DBMS. The business Intelligence tools are used to support the access of unstructured data. The NoSQL has its own language to handle the database. This NoSQL has the ability to scale the horizontal on commodity hardware.
The data in database servers are partitioning into several servers in NoSQL. The horizontal scaling is useful to connect the database servers in less expensive method. The Relational database management system is using the vertical scaling process which is more expensive than the horizontal scaling.
This NoSQL provides durability and high availability feat8res for the database users. The NoSQL uses four core types such as key-value, columnar, document and triple stores. Based on these types the user can find the required database type for the organization. The relational database management system supports simple data storage.
But the business organizations are having complex data with large volume. The interrelated values with complex data can be stored suing NoSQL methods. This NoSQL supports to handle simple binary values, lists, maps, and strings to use the key-value stores in NoSQL. The column features support to store the related information values within clones of Bigtable.
The document data structure is used to store the high complex data which includes parent-child hierarchical structures (Dmitriy BUY., 2013). The triple stores supports to store the web interrelated information. This also helps to store the graph values for analysis.
Based on the features of NoSQL, most of the business organizations are using this database method. When compared with relational database management system, the NoSQL provides more benefits with less expensive. The main reason for choosing this NoSQL for Startup Company based on three main features such as financial reasons, Demand reasons and workload reasons.
This NoSQL is open source and providing attractive advantages to the organization. The demand is considered based on web scale. This supports for the workload by providing simple storage and retrieving process (Evgeny Vasilievich Tsviashchenko., 2016).
Maintenance is the one more complexity in relational database management system. The employees in organization are facing more complexities in database maintenance. The NoSQL provides advantage of easy handling and flexible management of databases. This is simpler to distribute the data, auto-repair and model simplification.
References:
Bibliography
Bernhard Möller., P. R., 2015. An algebra of database preferences. Journal of Logical and Algebraic Methods in Programming, pp. Vol-84, issue-3, pp 456- 481.
Dmitriy BUY., S. P. I. H., 2013. Formal Specification of the NoSQL Document-Oriented Data Model. Acta Electrotechnica et Informatica, pp. Vol-13, issue-4, pp 26- 31.
Evgeny Vasilievich Tsviashchenko., 2016. Adequacy analysis the model of strong replicas agreement in NoSQL databases. Computer Research and Modeling, pp. Vol-8, issue-1, pp 101- 112.
Hasan Ali Idhaim., 2019. Selecting and tuning the optimal query form of different SQL commands. International Journal of Business Information Systems, pp. Vol-30, issue-1, .
Priyanka H U., V. R., 2019. Multi Model Data Mining Approach for Heart Failure Prediction. International Journal of Data Mining & Knowledge Management Process, pp. Vol-6, issue-5, pp 31-37.
- Poornima., D., 2018. Analysis and Prediction of Heart Disease Aid of Various Data Mining Techniques: A Survey. International Journal of Business Intelligence and Data Mining, pp. Vol-1, issue-1.
Wayne C. Levy., I. S. A., 2014. Heart Failure Risk Prediction Models. JACC: Heart Failure, pp. Vol-2, issue-5, pp 437- 439.
- Hiyane., A. B. A. M., 2020. Storing Data in A Document-oriented Database and Implemented from A Structured Nesting Logical Model. International Journal of Database Management Systems, pp. Vol-12, issue-2, pp 17- 23.
Know more about UniqueSubmission’s other writing services:


