
Local Air Quality Report
Introduction to the pollutant
Nitrogen dioxide is recognised to be a major gaseous pollutant which includes oxides of nitrogen. This air pollutant has significant impact on health of humans, flora and fauna and on environment. It is a primary pollutant as its presence as nitrogen oxide (NOx) is a precursor and modifier of pollutant such as particulate matter and secondary pollutant such as ozone (Seinfeld and Pandis, 2016). It also facilitates the formation of photochemical smog and acid rain.
Sources of NO2 pollutant: The primary sources for oxides of nitrogen or nitrogen oxide are majorly from motor vehicle exhaust such as emissions from trucks buses, cars, burning of fossil fuels (coal, gas, oil) emission from power generation. The secondary sources are manufacturing industries such as petrol, metal refining, power stations, food processing and from stoves and kerosene heaters.

The annual mean concentrations for this pollutant in the urban sites are mostly in the range of 20-90 µgm-3 which is around 10 to 45 parts per billion (). However, the concentration level for the nitrogen oxide pollutant presents variation during the daytime and the peaklevel of concentration are dependent upon the traffic hours and high level of industrial combustible process.
The maximum and hourly can reach upto 400 µgm-3 as well as in some cases upto 1200 µgm-3 under moderate to high air pollution level which denotes 200 and 600 parts per billion which have significant impact on human health, vegetation and ecosystem.
Site under investigation – United Kingdom
Many cities in the United Kingdom have continued presence of high levels of NO2 pollution. UK is a major hotspot source for this pollutant owing to road transport. The country has second highest number of deaths from the NO2 pollutant in Europe.
In 2012, the numbers of deaths were 14,100 and in 2013 were 11,940 from this toxic gas pollutant in the UK reported by European Environment Agency (The Guardian, 2016). Also in London (Oxford Street, Marylebone Road), the concentrations of annual mean levels of NO2 were above the legal EU air standard limit in 2016.
The Northern Ireland part of UK has reported to have most terrible pollution level. There have been breach in EU limits since 2015 in areas such as Armagh, Belfast, etc.
Thus, the nitrogen dioxide presents an ongoing threat to public health and environment from last two decades owing to the use of diesel-powered vehicles and from combustion processes. The National Atmospheric Emission Inventory (NAEI) reports largest source of NOx in UK is from road transport that contributes to one third of country emission (Vaughan et al., 2016).
This is leading to high road concentration and in inner cities and detrimental to health posing a need for the local, regional and national authorities to control the diesel-run vehicles, vehicle (Car) standards and a robust air quality plan. Apart from road transport, the industrial combustion and power plants also contributes to this pollutant emission in the country.
Thus, in UK, the poor air quality pose a elevated environmental risk to the public health which has high probability to intensify the pre-existing health circumstances in elders, older, children and infants related to respiratory infection/disease and cardio-vascular illnesses.
Monitoring data for NO2 pollutant concentration in the UK
The Automatic Urban and Rural Network (AURN) is the largest monitoring network for gaseous pollutants in the country. The measurement technique for NO2/NOx concentration as per EU directive is by chemiluminescence (Kumar et al., 2015).
The Nitrogen dioxide pollutant data was obtained from the Department for Environment Food and Rural Affairs (DEFRA) through data selector tool monitored by AURN. The below data type shown in figure 2 is for daily max range for year 2018 (from 1st January to 23rd March) for six sites in Northern Ireland, UK.
The sites are Armagh Roadside, Ballymena Antrim Road, Ballymena Ballykeel, Belfast Centre, Belfast Stockman’s Lane and Derry Rosemount. It can be analysed that the site of Belfast Stockman’s Lane has maximum high daily max range of more than 100 N ugm-3 and reached 206 N ugm-3 in January 2018.
This is followed by Armagh Roadside site which also has 174 N ugm-3 in February 2018. On the other hand, the Derry Rosemount site has shown daily max range of less than 100 N ugm-3 in the studied time period. In particular, for 23rd March 2018, the daily maximum value for the pollutant is shown in figure 1 which highlight highest in Belfast Stockman’s Lane.
The Defra statistics foe the Belfast Stockman’s Lane reported an annual average nitrogen dioxide reading of 50 µgm-3 from January to February for year 2017 which is above the 40 microgrammes µgm-3 the legal limit set by the EU (Belfast Telegraph, 2017).
From the below table, the maximum pollutant concentrations data during the last 24 hours (23-24 March, 2018) across the six sites in for hourly mean NO2 in µgm-3 are depicted in below table.
| Monitoring site, Northern Ireland (UK) | Hourly mean Nitrogen dioxide in µgm-3 | Air Quality Index Band |
| Armagh Roadside, | 40 | 0-67 µg/m 3 – Very low |
| Ballymena Antrim Road, | 81 | 68-134 µg/m 3 – Moderately Low |
| Ballymena Ballykeel | 57 | 0-67 µg/m 3– Very low |
| Belfast Centre | 87 | 68-134 µg/m 3 Moderately Low |
| Belfast Stockman’s Lane | 107 | 68-134 µg/m 3 Moderately Low |
| Derry Rosemount | 61 | 0-67 µg/m 3 – Very low |
Figure 1: Nitrogen oxide max daily value for 23 rd March 2018 (Source: self-developed)
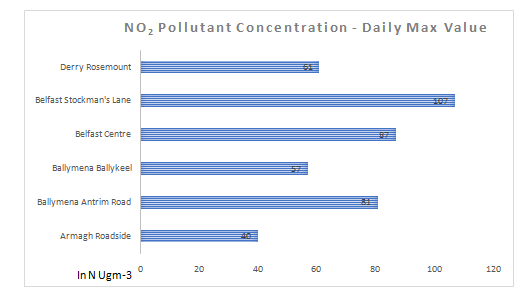
Figure 2: Daily max range of NO2 pollutant in six sites in the UK for year 2018 (DEFRA, 2018)

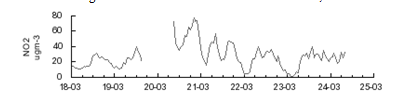
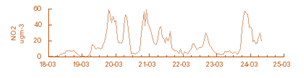
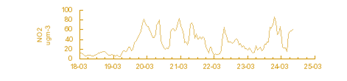
The below graphs highlight the seven days data for the NO2 pollutants in the selected sites in Northern Ireland in UK. The data is obtained for demonstrating the air quality in Northern Ireland from Aqicn.org (2018) and Defra site.
Armagh Roadside from 18th march to 24 March, 2018
Ballymena Antrim Road from 18th march to 24 March, 2018

Ballymena Ballykeel from 18th march to 24 March, 2018
Belfast Centre from 18th march to 24 March, 2018
Belfast Stockman’s Lane from 18th march to 24 March, 2018

Derry Rosemount from18th march to 24 March, 2018

For 2016, for NO2 the annual mean concentrations (darker bars) and hourly exceedance (lighter bars) is shown below for different sites in Northern Ireland.
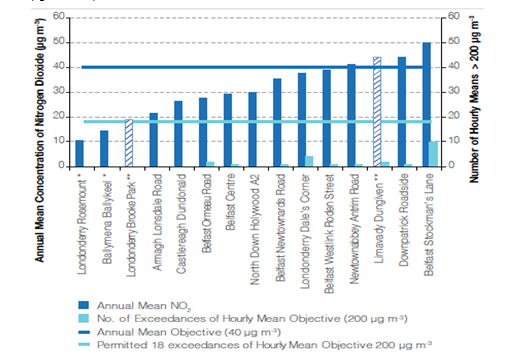
Figure 3: NO2 Concentration for year 2016 In Northern Ireland
Based on the collected data, it can be discussed that nitrogen dioxide pollutant concentration was monitoring using automatic networks for the different sites in 2016-18. In 2016, it can be observed that annual mean NO2 concentration which is 40 μg m-3 was exceeded by sites such as Antrim Road (41 μg m-3) , Belfast Stockman’s Lane (50 μg m-3) , and two others.
These sites are highly crowded buy roads and traffic prone sites but the sites did not exceeded the 200 μg m-3 which was the hourly mean limit value. There was high NO2 concentration of the pollutant when compared to other five sites under study.
Here, it can be conferred that daily and monthly data trend highlight that there will be low air pollution levels falling into the low daily air quality index (1, 2 and 3 band) based on the hourly mean pollutant concentration from 0 to 200 μg m-3. This indicates that for this season the general public as well as individual at risk of asthma and respiratory infections can take pleasure in usual activities in outdoors.
Effect on health due to NO2 concentration in the UK
The high concentration of nitrogen dioxide in the air if inhaled can lead to irritation in the airways. Short duration exposure at high concentration causes wheezing, coughing, cold, flu, troubled breathing, bronchitis (Kim et al., 2015) and continued long exposure can develop and intensify respiratory diseases such as asthma and respiratory infections.
The NO2 concentration in the UK can have a severe effect on the human respiratory system and increase the risk of likelihood of respiratory especially lungs infection and diseases as it affects the lungs lining from its chronic exposure.
In UK, the NO2 concentrations more than 200 µg m-3 of short-range exposure can cause airways inflammation (Cabaneros et al., 2017) and long term exposure respiratory infections and increase susceptibility to allergens in infants and older people, morbidity and mortality.
Impact on environment due to NO2concentrations
The NO2 and other oxides of Nitrogen can react with water, oxygen and atmospheric chemical to form acid rain which is harmful for forests and lakes. It can also make the air hazy and affects visibility.
The summer smog can look reddish brown in colour due to the pollutant which reacts to form secondary pollutant particles. In coastal waters, this pollutant can causes nutrient pollution.
The high NO2 concentration in the UK effects the environment as nitrogen oxides can react with volatile organic compounds in the presence of sunlight to produce photochemical pollutants and ozone. The nitrogen oxides also form secondary nitrate particles in the atmosphere that in high level affect flora.
The concentration of the pollutant of 120 μgm-3 affects vegetation and growth of plants (Kelleghan et al., 2017). It also causes acidification that have a corrosive impact on the building material at high level of concentrations and causes eutrophication that damages the aquatic and terrestrial ecosystems and leads to overall loss of biodiversity.
Management strategies for the air pollutant
The management policies for the NO2 and oxides of nitrogen pollutant in the Northern Ireland is based on EU directives 2008/50/EC and UK Air Quality strategy. These policies for air quality management are incorporated in the national legislation of Northern Ireland under Air quality Standard Regulation, 2010 considering pollutant effect on human health and environment.
Under the UK air quality strategy, it is essential to describe the existing and projected air pollution level, set out health and ecosystem objectives for air pollutants, map out policy for ambient air quality for future, offer best practicable safeguards to human health and natural environment.
In particular, Northern Ireland has adopted a public health strategy for a period of 2013 to 2023 under Making Life Better – A Whole System Framework for Public Health.
The progress report of public health strategy of making life better reports that the annual mean concentration level of Nitrogen Dioxide in 2011 μgm-3 was 22.0 μgm-3 and 35.2 μgm-3 for urban background and urban road sites taken as baseline in Northern Ireland where it raised slightly to 22.6 μgm-3 in 2013 for background and 38.5 μgm-3 roadside at urban sites (GOV.UK., 2015).
The government also initiated and invested £3bn for The UK Plan for Tackling Roadside Nitrogen Dioxide Concentrations in 2017 to accelerate the air quality plans (MacIntyre, 2017). Under this, there will be infrastructure improvement for ultra-low emission vehicles, to lessen transport emissions, strategy for and funds allotted for road Investment, cycling and walking strategy, green bus and clean technology.
In addition to this, the concentration levels of the gaseous pollutant can be managed by restricting on the production quantities of nitrogen dioxide. This can be done by strict implementation of nation standards for fuel quality and vehicle emission standard in the country.
Another policy that needs a proper adherence is to develop and support the use of alternative fuel to reduce the emission level for the road transport system. For short journey, the use of bicycles can also be promoted to manage this pollutant. Also, educating the general public and risk prone older, children and infants with respiratory illness can be also help in dealing with the pollution level to a certain extent.
To sum it up, it was stated that most dominant source of the nitrogen dioxide pollutant is road transport in the UK. The emission form road transport combines with industrial combustion has accounted for the Northern Ireland air pollution level.
This pollutant concentration have been in low index bank of air quality for the monitored data for year 2018 from 1st January to 24th March in six sites in Northern Ireland for the data obtained from automatic monitoring network. This indicates a seasonal trend of NO2 concentration is in the range 0 μgm-3 to 200 μgm-3 daily max values for this pollutant.
The government has been active involved incorporating strategies as an effort to lessen the emission from road transport system, develop air quality plans and reduce overall gaseous pollutants level owing to the impact on human health and ecosystems.
Aqicn.org. 2018. World-wide Air Quality Monitoring Data Coverage. [Online] Available at: https://aqicn.org/sources/ (Accessed: 24 March 2018).
Belfast Telegraph. 2017. Northern Ireland. [Online] Available at: https://www.belfasttelegraph.co.uk/news/northern-ireland/belfast-air-pollution-levels-among-the-worst-in-uk-35636923.html (Accessed: 24 March 2018).
Cabaneros, S.M.S., Calautit, J.K.S. and Hughes, B.R., 2017. Hybrid Artificial Neural Network Models for Effective Prediction and Mitigation of Urban Roadside NO 2 Pollution. Energy Procedia, 142, pp.3524-3530.
Department for Environment Food and Rural Affairs (DEFRA). 2018. Data Archive. [Online] Available at: https://uk-air.defra.gov.uk/data/ (Accessed: 24 March 2018).
GOV.UK. 2015. Making Life Better – strategy and reports. [Online] Available at: https://www.health-ni.gov.uk/publications/making-life-better-strategy-and-reports (Accessed: 24 March 2018).
Kelleghan, D.B., Savian, M., Sutton, M., Dodd, D. and Curran, T.P., 2017. Atmospheric Nitrogen Pollution: Sources, Impacts and Solutions.
Kim, K.H., Kabir, E. and Kabir, S., 2015. A review on the human health impact of airborne particulate matter. Environment international, 74, pp.136-143.
Kumar, P., Morawska, L., Martani, C., Biskos, G., Neophytou, M., Di Sabatino, S., Bell, M., Norford, L. and Britter, R., 2015. The rise of low-cost sensing for managing air pollution in cities. Environment international, 75, pp.199-205.
MacIntyre, S., 2017. 4 Environmental health, environmental protection and their relationship with spatial planning. Planning Law and Practice in Northern Ireland, pp.88.
Seinfeld, J.H. and Pandis, S.N., 2016. Atmospheric chemistry and physics: from air pollution to climate change. US: John Wiley & Sons.
The Guardian. 2016. UK has second-highest number of deaths from NO2 pollution in Europe. [Online] Available at: https://www.theguardian.com/environment/2016/nov/23/uk-has-second-highest-number-of-deaths-from-no2-pollution-in-europe (Accessed: 24 March 2018).
Vaughan, A.R., Lee, J.D., Misztal, P.K., Metzger, S., Shaw, M.D., Lewis, A.C., Purvis, R.M., Carslaw, D.C., Goldstein, A.H., Hewitt, C.N. and Davison, B., 2016. Spatially resolved flux measurements of NO x from London suggest significantly higher emissions than predicted by inventories. Faraday discussions, 189, pp.455-472.
