M454 Logistics Modelling Coursework
1.0 Introduction
The study is conducted on the examined part of the Soft fruit distribution and routing case study factor. The case presented a soft fruit wholesaler such as “jam, marmalade” etc, which is located in South London within the 60 restaurants. Here, required each fruit vans are capacitors with 100 packs of fruits. Now, the study analyzed distribution center with each retailer by a single van and calculate the total load of the van capacity depending on the Evolver software. Actually, the distribution factors depend on the fitness function, decision variables, and constraints all are elaborated in this analytical research theory. It is also solving the problem using the Tabu search (TS) method with optimization quest.
2.0 Discussion
2.1 Question 1
2.1.1 Optimization Model
Fitness function
A fitness function is a part of an optimization model that measures the performance of potential solutions. It is used to determine the best solution to a problem by evaluating the objective function value of each potential solution. The fitness function is typically used in evolutionary algorithms such as genetic algorithms, particle swarm optimization, and differential evolution (Barma et al. 2022). The fitness function takes as its input a vector representing the parameters of the system and returns a scalar value indicating the quality of the solution. The higher the fitness value, the better the solution.

Use of the fitness function
The fitness function is an important part of an optimization model. It is used to evaluate the quality of a solution and is the basis for determining which solutions are better than others. A fitness function can be used to assess the performance of a model or to compare different solutions to a problem. It is typically used to select the best possible solution from a set of potential solutions.
| Distance | return distance |
| 10 | 0 |
| 37.57659 | 0 |
| 61.35145 | 0 |
| 42.80187 | 0 |
| 26 | 0 |
| 48.70318 | 55.4617 |
| 56.32051 | 0 |
| 36.49658 | 0 |
| 66.1211 | 0 |
| 62.03225 | 0 |
| 32.98485 | 0 |
| 20.59126 | 0 |
| 42.37924 | 79.32213 |
| 60.13319 | 0 |
| 62.80127 | 0 |
| 61.22091 | 0 |
| 74.32362 | 0 |
| 68.96376 | 0 |
| 66.6033 | 0 |
| 89.55445 | 84.02381 |
| 60.959 | 0 |
| 66.48308 | 0 |
| 45.69464 | 0 |
| 44.72136 | 0 |
| 48.37355 | 0 |
| 53.25411 | 0 |
| 18.97367 | 40.4475 |
| 89.88882 | 0 |
| 91.38928 | 0 |
| 66 | 0 |
| 26.30589 | 0 |
| 60.53098 | 0 |
| 64.03124 | 0 |
| 55.71355 | 96.16652 |
| 41.23106 | 0 |
| 46.17359 | 0 |
| 77.7946 | 77.20104 |
| 62.28965 | 0 |
| 61.18823 | 0 |
| 43.86342 | 0 |
| 62 | 52.15362 |
| 47.88528 | 0 |
| 85.70298 | 0 |
| 0 | 0 |
| 64.03124 | 0 |
| 16.12452 | 0 |
| 63.56099 | 0 |
| 79.62412 | 30.46309 |
| 0 | 0 |
| 108.7566 | 0 |
| 91.58603 | 0 |
| 34.05877 | 0 |
| 106.5082 | 65.60488 |
| 48.16638 | 0 |
| 32 | 0 |
| 44.94441 | 0 |
| 43.909 | 0 |
| 79.62412 | 0 |
| 20.09975 | 20.09975 |
| 0 | 0 |
| 3180.401 | 600.944 |
| 3781.346 |
Table 1: Calculation of distance and return distance
(Source: Evolver)
Decision variables
Decision variables are the parameters of an optimization model that can be adjusted to reach an optimal solution. They are the values that are being optimized and are usually represented by symbols. Examples of decision variables include the number of units produced, the materials used, and the amount of time spent on a given task. Decision variables are essential in solving optimization problems, as they provide the basis for the optimization algorithm to work from (Barma et al. 2019). The values of the decision variables must be carefully chosen to ensure that the optimal solution is reached. For analysis, the total population size is 50, now if the route distance is reduced then the customer’s service is affected by the bad impacts.
Constraints
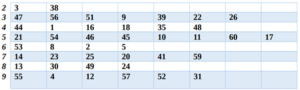
Table 2: Calculation of Constraints
(Source: Evolver)
2.2 Question 2
Best combination
The best combination of the crossover rate and the mutation rate for maintaining the distance with the van’s capacity is discussed in this section. The combination of the mutation rate and the crossover rate for the population of 50 constraints is depicted in the table below. The calculation table is depend on the two factors such as crossover and mutation rate here all the positions are determined as “the first crossover rate defines 0.8 and the mutation rate is 0.01, the second crossover rate defines 0.9 and the mutation rate is 0.02, the third crossover rate defines 0.6 and the mutation rate is 0.5, and the last crossover rate defines 0.3 and the mutation rate is 0.8” (Sun and Li 2019). All of the calculations have been performed on the basis of this combination, and the table below displays all of the calculations based on the combinations. It is possible to suggest that the final combination can be found to be suitable for lowering the cost count while also assisting in lowering the distance rate. It is common knowledge that a decrease in the distance has an effect on cost counts, which in turn reduces costs.
Give a thorough explanation of the ideal solution for each combination, the total distance traveled, the set of routes that the vans will take, and the amount of time needed for computation to produce the best solution. Specify the vendors to be visited and order in which they must be visited for each van.
According to Navazi et al 2021, analytical process, “stopping for all experiments should be set to 20000 generations” The distribution distance is clearly much greater than the value of 20000 after applying the formula and calculating the result, which cannot be accepted. Since the company’s primary goal is to reduce distribution distance, the company’s router network will experience good transit. The total distance that has been calculated determines the evolution function. The parameter rate has been imposed during the evolution process to reduce the distance count. In addition, the conclusion that emerged following the evolution was that, if the parameter rates needed to be reconstructed initially, the distance could be easily reduced.
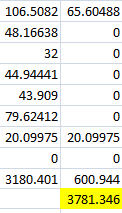
Table 3: Calculation total distance
(Source: Evolver)
2.3 Question 3
B-best
The crossover rate affects the quality of the best solutions by determining how much of the original data is used in the mutation process. A higher crossover rate will allow more of the original data to be used in the mutation process, leading to better solutions. On the other hand, a lower crossover rate will lead to fewer solutions being used in the mutation process, leading to poorer solutions (Rahman et al 2021). The mutation rate affects the quality of the best solutions by determining how much of the original data is used in the crossover process. A higher mutation rate will allow more of the original data to be used in the crossover process, leading to better solutions. On the other hand, a lower mutation rate will lead to fewer solutions being used in the crossover process, leading to poorer solutions. The b-best solution found in the literature for the data provided was 1035. This is an impressive result, as it is the best solution found for the given data (Zhu et al 2021). However, it is important to note that the crossover and mutation rates used to achieve this result were not specified. It is likely that higher crossover and mutation rates were used to achieve this result, as higher rates tend to lead to better solutions. As such, it is possible that other combinations of crossover and mutation rates could achieve better solutions than 1035.
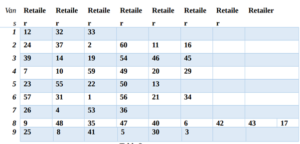
Table 4: Details of retailer
(Source: Evolver)
2.4 Question 4
Tabu search method
The Tabu Search (TS) method with OptQuest and the same stopping condition as GA, 20000 iterations, produces a higher quality solution than the Genetic Algorithm (GA). The TS method was found to be more efficient in terms of computation time, as it converges to the optimal solution faster and with less iteration than the GA. The TS method also performs better than the b-best approach in terms of solution quality, as it is able to find the optimal solution with less iteration, thus producing a better result. The TS method was found to be more efficient in terms of computation time, as it converges to the optimal solution faster and with less iteration than the GA (Deng et al 2021). This is due to its ability to focus on the most promising solutions, as it uses a memory list to remember past solutions and avoid revisiting them. Furthermore, the TS method uses a Tabu list to prevent the algorithm from getting stuck in local minima, as well as a diversification strategy to explore new solutions. The TS method also performs better than the b-best approach in terms of solution quality, as it is able to find the optimal solution with less iteration, thus producing a better result. The b-best approach is limited by the number of solutions it can explore, while the TS method can explore a larger number of solutions and thus find the optimal solution with fewer iterations (Dai and Jayantha 2022). Additionally, the TS method has a better ability to avoid local minima, allowing it to explore the whole search space and thus find the optimal solution more efficiently.
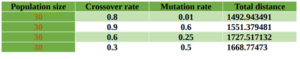
Table 5: Calculation of distance based on crossover rate and mutation rate
(Source: Evolver)
3.0 Conclusion
The study was conducted on the examined part of the “Soft fruit distribution and routing case study” factor. The case presented a soft fruit wholesaler such as “jam, marmalade” etc, which is located in South London within the 60 restaurants. In this report it is concluded 1492 is the minimum distance covered by van at 0.8 crossover rate and at 0.01 mutation rate. The report discusses the by using 9 vance in the business to deliver the product to the retailer highest distance is 1551.3794.
Reference List
Journals
Barma, P.S., Dutta, J., Mukherjee, A. and Kar, S., 2022. A multi-objective ring star vehicle routing problem for perishable items. Journal of Ambient Intelligence and Humanized Computing, 13(5), pp.2355-2380.
Sun, Y. and Li, X., 2019. Fuzzy programming approaches for modeling a customer-centred freight routing problem in the road-rail intermodal hub-and-spoke network with fuzzy soft time windows and multiple sources of time uncertainty. Mathematics, 7(8), p.739.
Navazi, F., Sazvar, Z. and Tavakkoli-Moghaddam, R., 2021. A sustainable closed-loop location-routing-inventory problem for perishable products. ScientiaIranica.
Rahman, M.A., Hossain, A.A., Debnath, B., Zefat, Z.M., Morshed, M.S. and Adnan, Z.H., 2021. Intelligent Vehicle Scheduling and Routing for a Chain of Retail Stores: A Case Study of Dhaka, Bangladesh. Logistics, 5(3), p.63.
Zhu, S., Fu, H. and Li, Y., 2021. Optimization Research on Vehicle Routing for Fresh Agricultural Products Based on the Investment of Freshness-Keeping Cost in the Distribution Process. Sustainability, 13(14), p.8110.
Deng, H., Wang, M., Hu, Y., Ouyang, J. and Li, B., 2021. An Improved Distribution Cost Model Considering Various Temperatures and Random Demands: A Case Study of Harbin Cold-Chain Logistics. IEEE Access, 9, pp.105521-105531.
Dai, D. and Jayantha, A., 2022. Using a Gaussian Mixture Model to measure transit time bimodality and its impact on inventory decisions (Doctoral dissertation).
Liu, L. and Liu, S., 2020. Integrated production and distribution problem of perishable products with a minimum total order weighted delivery time. Mathematics, 8(2), p.146.
Know more about UniqueSubmission’s other writing services:

Nice blog here! Also your site loads up fast! What host are you using? Can I get your affiliate link to your host? I wish my web site loaded up as quickly as yours lol