MAA111 Pilot Project Sample
1. Methodologies and Methods
1.1 Research Philosophy
The research has used a positivism philosophy in its method of study and setting a hypothesis. As per the views of Park et al. (2020), the paradigm of the positivism philosophy demands factual data and truth to use as an application for the research. Regarding the research study of creating a web application for grocery shopping, the hypothesis created by the philosophy is tested and the results are measured within a given set of laws. The philosophy strengthens the research with a degree of authority to place the study on a wide spectrum of academic nature leading to future progress. The philosophy benefited the study with different literary sources and the exchange of data within the complexities of designing a web application.
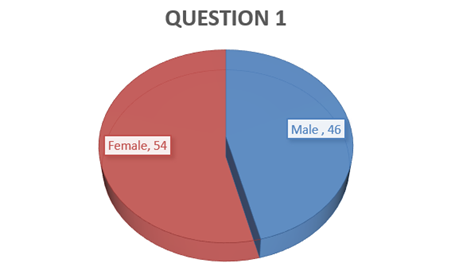
Figure 1: Process of creating Hypothesis in Positivism Philosophy

(Source: Park et al. 2020)
The study based on the aim of availing knowledge of price comparison in different stores to ease purchasing decisions is helped with the gained quantitative data. As opinionated by Park et al. (2020), the positivist philosophy is constrained to unrealistic standards in various complexities yet is beyond pure logic and mathematics. These philosophy features have helped the study set a potential ground for making claims of sufficiency in the discipline by a reliable and generalized data set. One of the main objectives of this research is to avail profound knowledge of price comparison for household grocery items in different stores. Positivism research philosophy has been beneficial for this research to analyse the collected data in such a way that helps to determine this result.
1.2 Research Approach
The research has used a deductive approach for removing the ambiguities present in the data set gained throughout. The approach has helped the study with the ability to explain the relationship between the qualitative concepts and quantitative variables. As per the views of Pearse (2019), the deductive approach underpins the validity and reliability of the developed theory by measuring the concepts and generalizing the variables. The approach aligns intending to facilitate a comprehensive understanding of the deals available in different stores by providing sufficient information concerning the fundamental concepts used in the existing literature.
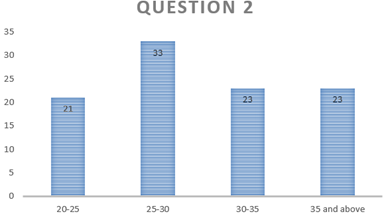
Figure 2: Deductive Profiling
(Source: Pearse, 2019)
Considering the inductive approach, the limitation lies in the procedure of proving something where the data may fail to support or even discredit a generalization. The abductive and inductive approach shows instability in clarity in terms of the selection of resources in comparison to a deductive approach (Lawhon and Truelove, 2020). On the other hand, a deductive approach seeks authentic knowledge and proves its validity in making specific outcomes, and hence is used in the research. Deductive research approach is beneficial in terms of establishing causal relationship among research concepts and variables. This research approach has been beneficial in gathering data from the survey and analyse them for obtaining answers for research questions. Based on the results obtained from this survey, relevant theories have been developed in this research.
Festinger’s cognitive dissonance theory can be linked to this research because this theory is beneficial in identifying the inconsistencies in customer’s decision-making ability and products purchasing behaviour. It is helpful in motivating customers to change their attitude while choosing a particular product or service while looking for that in the web-based software to select grocery items (Hinojosa et al. 2017). On the other hand, the contrast theory is reverse to the dissonance theory and this theory is beneficial to identify the attitude or expression of consumers in case they do not find the product as they expected before buying. It creates a sense of disgust among the customers and that affects the customer service quality of the organizations (Hossain et al. 2020). Therefore, the deductive approach has helped to generate these theories so that real picture and descriptions are added in the website for the grocery products and customers do not get disappointed.
1.3 Research Design
The present research has used an explanatory design, which allowed the researchers to provide a deep insight into the specific topic creating more opportunities. As per the opinion of Bowen et al. (2017), the design increases the scalability of the research by making the reader familiar with the topic of the study. This feature has helped the research in creating a hypothesis by the measured values of the variables found in the data to create a better opportunity for describing and illustrating. The design has strengthened the research in exploring the research questions in terms of assessing the impacts of changes occurring in the existing study.
The design amalgamates the research objectives and answers the research questions clarifying and explaining the existing issues to the reader. The research objectives include understanding of the deals of packaged groceries and versatile food ingredients that has been analysed in this research with the help of an explanatory research design (Rogus et al. 2020). This research design is effective in explaining the advantages of developing a web application to support customer’s buying practices and decision-making process.
1.4 Sample Size
Sample size refers to the number of samples selected for studying a phenomenon, a sample represents a larger group known as the population. According to Richards and Hemphill (2018), a sample of research is selected from a larger population that shares similar characteristics to better analyse the phenomenon. The sample size of the present study is 151 residents this has helped to better analyse the price differences and deals of goods.
1.4 Data Sampling Method
The sampling method used for selecting the sample in the present study is simple random sampling, simple random sampling was used to remove the sampling bias and provide everyone with an equal chance at participating in the research. According to Sharma (2017), the simple way of selecting samples in simple random sampling allows to reduce the time and enables the researcher to generally represent the population. The local 500 residents were provided with numbers from 1-500, a number generator was used to generate the sample; the first 151 numbers were selected as the samples. The other sampling methods such as snowball sampling and convenience sampling were not used; firstly, because it is a pilot study with a small amount of data and secondly because using snowball or convenience sampling can result in problems representing the population.
1.5 Data Collection method
The primary data collection method has been used for this study to understand the price differences in stores and the deals on grocery packaged items. The survey method was used to collect the data for the study. As per the views of Loomis and Paterson (2018), a survey allows clarification of the phenomenon and its characteristics to the researcher. The survey method was selected for this study as it enables the possibility of a higher response rate that ensures broader analysis and better conclusions. The survey method is less expensive and is faster than other primary methods such as interviews.
The data was collected with the help of Google forms, the form was created with 3 demographic questions and 9 questions in the Likert scale related to price difference and deals of products. The forms were sent via e-mail to the participants along with an explanation of why the study is being held and asking for their consent for participation.
1.6 Data Analysis
The quantitative data analysis was used for analysing the data, this helped to get a better understanding of the variable of the study and answer the research questions. The data was analysed with the help of MS Excel in this study. The percentage of responses was calculated to identify whether there are price differences and what kind of deals are available in the stores.
1.7 Ethical Consideration
The anonymity of the participants has been maintained in the research along with the consideration of both male and female participants in the study. The data collected for the research should not be used for any personal gain and used only in the research (Duplancic et al. 2019). The collection was not manipulated and no discrimination was made during data collection based on race, class, and gender. Data safety has been prioritized by following the Data Protection Act 2018of the UK.
2. Result and Analysis
2.1 Result Analysis
Question 1
Figure 3: Gender
(Source: MS Excel)
The following graph displays the gender of the respondents for this study, it can be seen that from a total of 151 respondents a total of 54 percent were females and 46 percent were male. This accounted for 70 male respondents and 81 female respondents.
Question 2
Figure 4: Age
(Source: MS Excel)
The above graphical representation displays the age of the respondents in this study, the age was categorized into 4 categories such as 20-25, 25-30, 30-35 well as 35 and above. From the graph, it can be stated that 21 percent of the respondents were between the age group of 20-25. The graph also demonstrates that 33 percent of the respondents belonged from the 25-30 age group. The respondents from the age group of 30-35 as well as 35 and above displayed 23 percent responses respectively. From the graph, it can be stated that the maximum number of respondents in this study belonged from the age group of 25-30.
Question 3
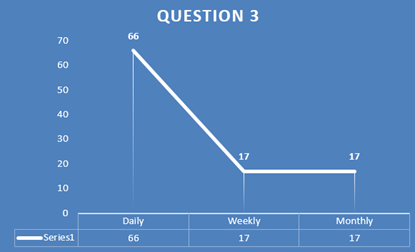
Figure 5: Grocery shopping frequency
(Source: MS Excel)
The above graph displays the frequency of visiting stores for grocery shopping, the data displays that out of 151 respondents 100 visit grocery stores on a daily basis accounting for 66 percent of the responses. 25 respondents show that they visit grocery stores weekly and accounted for 17 percent of the total responses. The graph also displays those 26 respondents shop from grocery stores monthly accounting for 17 percent of the responses. This analysis helped to understand the needs of customers towards grocery and the frequency of this need.
Question 4
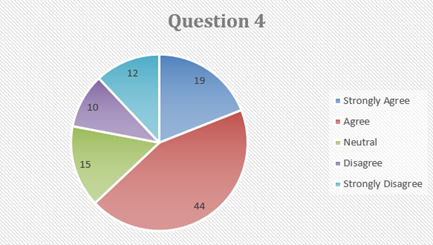
Figure 6: Difference in-store prices of products
(Source: MS Excel)
The above graphical representation displays that there is a variation in prices among different stores. 44 percent of the respondents have agreed to the fact there are differences in prices of products in the stores. 19 percent of the respondents have strongly agreed to the fact that the prices differ from store to store. As per the views of Rogus et al. (2020), the differences in product prices depend on various factors such as store location, product quality, as well as the brand image of the store. Thus, it can be stated that the difference in prices in the local grocery stores is dependent on the quality of products and the image of the brand.
Question 5
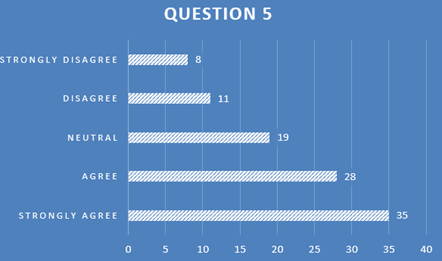
Figure 7: Price difference based on location
(Source: MS Excel)
The following figure displays the graphical representation of price differentiation depending on location. It can be seen from the data that 35 percent of the 151 respondents have strongly agreed that the prices of goods change depending on location. The data also shows that 28 percent of the respondents have agreed that location is a factor that affects price differences of products. According to Hosken et al. (2018), before pricing a product several factors such as cost of raw materials, labour costs, transportation, and inventory costs are taken into account. However, one major factor is demographic income, stores, and supermarkets price their products based on the location as well as based on the disposable income of the population. This affects the prices of products and thus a fluctuation can be seen which reflects the price differences of goods.
The graph also displays those 19 respondents provided a neutral response about the price differences. The table also sheds light on the fact that 11 percent of the respondents have disagreed that there are price differences and 8 percent have strongly disagreed.
Question 6
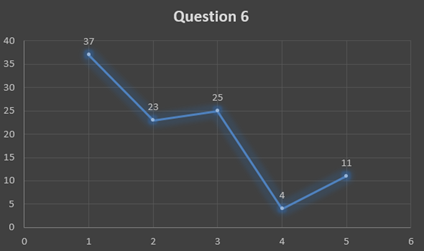
Figure 8: Price difference based on Seasons and availability
(Source: MS Excel)
The following graph displays the percentage of responses for price differences based on availability and seasons. It can be seen from the graph that most respondents have strongly agreed to the fact that prices differ based on seasons and availability. The graph shows that 37 percent of the participants have strongly agreed followed by 23 percent of respondents who agreed to the question. The graph further shows that 25 percent of the respondents have provided neutral results. According to Frank and Peschel (2020), seasonal deals and discounts allow stores to attract a large number of customers to the stores.
The increasing competition in the market also affects the pricing and discounts. It can be said from the data that during seasons the availability of some goods is more than others. Providing deals during such situations allows to establish a larger customer base and gain market advantage. The differences in the price of products depending on seasons and availability reflect the proper competition within the market as well as display the constant demand of the customer.
Question 7
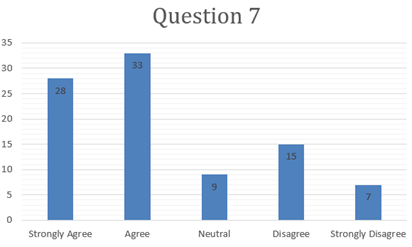
Figure 9: Price differences due to differences in quality
(Source: MS Excel)
The above graph displays the percentage of responses on the price differences due to differences in product quality. The graph shows that 33 percent of the participants agree that prices in different stores differ due to the quality of products. As per Pitts et al. (2018), customers are always looking for quality products at the best prices, focusing on maintaining product quality can help in enhancing customer satisfaction and help in earning more sales and increasing profits. Therefore, it can be said that the price difference of products depends on the quality of products. The graph further displays that 28 percent of the respondents have strongly agreed to the question, 15 percent have disagreed followed by 9 percent neutral responses. 7 percent of the respondents have strongly disagreed with the fact that the prices of similar products in different stores differ due to quality.
Question 8
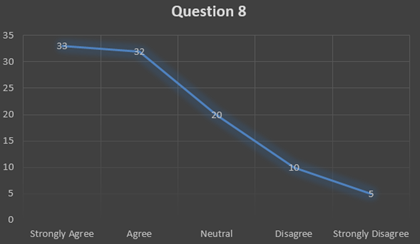
Figure10: Deals on grocery products
(Source: MS Excel)
The graph shows the response percentage for deals in grocery products, the chart shows 33 percent of the respondents have strongly agreed that all the local stores provide deals on grocery products. 32 percent agreed to this followed by 20 percent neutral responses. The graph further shows that 10 percent disagree that there are a lot of deals in all the stores along with 5 percent strongly disagreeing. As opined by Scheinbaum et al. (2020), grocery businesses as a strategy provide deals and discounts to customers on various products, offers and discounts have seen to increase the sales of the products significantly. Therefore, from this study, it can be said that deals and discounts are an important factor to attract customers. It is also seen in the study that there are a lot of deals in the different stores.
Question 9
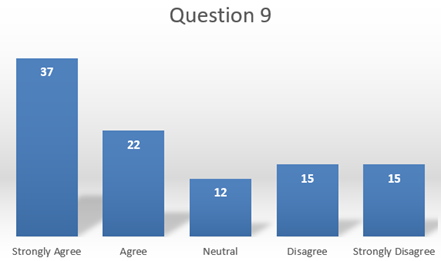
Figure 11: Deals on frozen food and meat items
(Source: MS Excel)
The following graph displays that 37 percent of the respondents have agreed that the discounts are mostly offered on meat items. 22 percent of the respondents have agreed to this followed by 15 percent of disagreements and 15 percent of strong disagreements. 12 percent of the participants have presented a neutral opinion about this question. The findings show that mostly the offers are on frozen food and meat items in the grocery stores.
Question 10
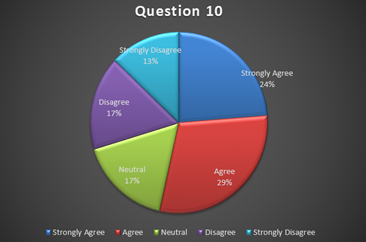
Figure 12: Seasonal deals on grocery
(Source: MS Excel)
The above graph displays that 24 percent and 29 percent of the respondents have respectively strongly agreed and agreed that seasonal deals are available on grocery items. 17 percent of the participants have disagreed followed by 17 percent neutral responses. 13 percent of the 151 participants have strongly disagreed that seasonal deals are not provided in stores.
Question 11
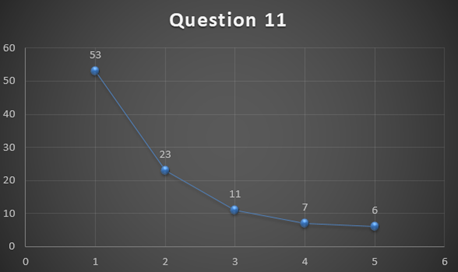
Figure 13: Providing deals throughout the year
(Source: MS Excel)
The above graph shows that 53 percent of the respondents have strongly agreed that they will buy from stores that provide deals and discounts on products throughout the year. According to Salisbury et al. (2018), suitable offers provided by stores that can potentially cater to their needs and satisfy customers can incline clients towards the store. 23 percent have agreed followed by 11 neutral responses. 7 percent have disagreed to buy from stores providing discounts throughout the year followed by 6 participants strongly disagreeing. As per the views of Namin and Dehdashti (2019), deals are an integral part that influences customer footfall in the stores.
Question 12
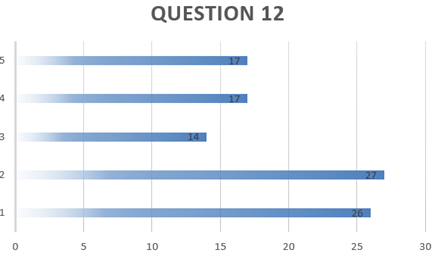
Figure14: Bundled grocery products deals
(Source: MS Excel)
The above table displays that 26 percent of the respondents have strongly agreed followed by 27 percent of respondents agreeing that deals on groceries are mostly on bundled groceries. 14 percent of respondents have provided neutral responses and 17 percent have disagreed. The remaining 17 percent strongly disagreed that deals are mostly on bundled groceries. From this, it can be stated that some stores provide offers mostly on bundled groceries, and some provide offers on single products.
2.2 Conclusion
Based on the above results it can be said that there is a price difference in products of different stores and are dependent on factors such as location, availability, seasons, and quality. Thus it is important to assess these factors before offering users proper purchasing help through the web application. Further, it is seen that deals are an integral part that influences customer footfall in the stores. Thus notifying customers about the best prices and deals in various stores will help the user to choose the most suitable store that can potentially cater to their needs and satisfy them.
References
Bowen, P., Rose, R. and Pilkington, A., 2017. Mixed methods-theory and practice. Sequential, explanatory approach. International Journal of Quantitative and Qualitative Research Methods, 5(2), pp.10-27. Available at: https://www.researchgate.net/profile/Phil_Bowen/publication/317545024_MIXED_METHODS-THEORY_AND_PRACTICE_SEQUENTIAL_EXPLANATORY_APPROACH/links/593e6667aca272e79e5baab1/MIXED-METHODS-THEORY-AND-PRACTICE-SEQUENTIAL-EXPLANATORY-APPROACH.pdf
Cebollada, J., Chu, Y., and Jiang, Z. 2019. Online category pricing at a multichannel grocery retailer. Journal of Interactive Marketing, 46(4), pp.52-69. https://www.researchgate.net/profile/Javier_Cebollada/publication/332788981_Online_Category_Pricing_at_a_Multichannel_Grocery_Retailer/links/5e4bf619a6fdccd965af3416/Online-Category-Pricing-at-a-Multichannel-Grocery-Retailer.pdf
Duplancic, C., Crough, T., Bell, S.C., Australian Non‐tuberculous Mycobacteria in Cystic Fibrosis Study Group, Thomson, R., Wainwright, C., Clements, A., Floto, A., Rogers, G., Sly, P. and Burr, L., 2019. Multi‐centre ethics and research governance review can impede non‐interventional clinical research. Internal medicine journal, 49(6), pp.722-728. https://openresearch-repository.anu.edu.au/bitstream/1885/213062/1/01_Duplancic_Multi-centre_ethics_and_2019.pdf
Frank, D.A. and Peschel, A.O., 2020. Sweetening the Deal: The Ingredients that Drive Consumer Adoption of Online Grocery Shopping. Journal of Food Products Marketing, 26(8), pp.535-544. https://www.tandfonline.com/doi/pdf/10.1080/10454446.2020.1829523
Hosken, D.S., Olson, L.M. and Smith, L.K., 2018. Do retail mergers affect competition? Evidence from grocery retailing. Journal of Economics & Management Strategy, 27(1), pp.3-22. https://www.ftc.gov/sites/default/files/attachments/guarding-consumers-pocketbooks/wp313.pdf
Lawhon, M. and Truelove, Y., 2020. Disambiguating the southern urban critique: Propositions, pathways and possibilities for a more global urban studies. Urban Studies, 57(1), pp.3-20. Available at: https://journals.sagepub.com/doi/pdf/10.1177/0042098019829412
Loomis, D. K., and Paterson, S. 2018. A comparison of data collection methods: Mail versus online surveys. Journal of Leisure Research, 49(2), pp.133-149. https://www.researchgate.net/profile/Shona_Paterson/publication/327459121_A_comparison_of_data_collection_methods_Mail_versus_online_surveys/links/5be9c05c4585150b2bb2344b/A-comparison-of-data-collection-methods-Mail-versus-online-surveys.pdf
Namin, A., and Dehdashti, Y. 2019. A “hidden” side of consumer grocery shopping choice. Journal of Retailing and Consumer Services, 48(2), pp.16-27. https://e-tarjome.com/storage/panel/fileuploads/2019-08-17/1566025952_E11570-e-tarjome.pdf
Park, Y.S., Konge, L. and Artino, A.R., 2020. The positivism paradigm of research. Academic Medicine, 95(5), pp.690-694. Available at: https://www.researchgate.net/profile/Anthony-Artino/publication/337693284_The_Positivism_Paradigm_of_Research/links/6051f803458515e8344ed4d2/The-Positivism-Paradigm-of-Research.pdf
Pearse, N., 2019, June. An illustration of deductive analysis in qualitative research. In 18th European Conference on Research Methodology for Business and Management Studies (p. 264). Available at: http://eprints.lincoln.ac.uk/36421/1/ECRM19-Proceedings-Download.pdf#page=279
Pitts, S.B.J., Ng, S.W., Blitstein, J.L., Gustafson, A. and Niculescu, M., 2018. Online grocery shopping: promise and pitfalls for healthier food and beverage purchases. Public health nutrition, 21(18), pp.3360-3376. https://www.cambridge.org/core/services/aop-cambridge-core/content/view/00D984E81BCD38FD733A35147078BC58/S1368980018002409a.pdf/online-grocery-shopping-promise-and-pitfalls-for-healthier-food-and-beverage-purchases.pdf
Richards, K. A. R., and Hemphill, M. A. 2018. A practical guide to collaborative qualitative data analysis. Journal of Teaching in Physical Education, 37(2), pp.225-231. https://www.researchgate.net/profile/K_Andrew_R_Richards/publication/320437826_A_Practical_Guide_to_Collaborative_Qualitative_Data_Analysis/links/5a886b04a6fdcc6b1a3f818c/A-Practical-Guide-to-Collaborative-Qualitative-Data-Analysis.pdf
Rogus, S., Guthrie, J.F., Niculescu, M. and Mancino, L., 2020. Online grocery shopping knowledge, attitudes, and behaviors among SNAP participants. Journal of nutrition education and behavior, 52(5), pp.539-545. https://www.sciencedirect.com/science/article/am/pii/S1499404619311352
Salisbury, K., Curtis, K., Pozo, V., and Durward, C. 2018. Is local produce more expensive? A comparison of direct market and conventional grocery produce pricing. Journal of Food Distribution Research, 49(856-2018-3105), pp.13-21. https://ageconsearch.umn.edu/record/274599/files/JFDR_49.1_4_Curtis.pdf
Scheinbaum, A.C., Shah, P., Kukar‐Kinney, M. and Copple, J., 2020. Regret and nonredemption of daily deals: Individual differences and contextual influences. Psychology & Marketing, 37(4), pp.535-555. https://www.researchgate.net/profile/Angeline_Close_Scheinbaum/publication/338337815_Regret_and_nonredemption_of_daily_deals_Individual_differences_and_contextual_influences/links/5ebc65f0a6fdcc90d674fb97/Regret-and-nonredemption-of-daily-deals-Individual-differences-and-contextual-influences.pdf
Sharma, G. 2017. Pros and cons of different sampling techniques. International journal of applied research, 3(7), pp.749-752. https://www.academia.edu/download/58765080/Pros_and_cons_of_sampling.pdf
Hinojosa, A.S., Gardner, W.L., Walker, H.J., Cogliser, C. and Gullifor, D., 2017. A review of cognitive dissonance theory in management research: Opportunities for further development. Journal of Management, 43(1), pp.170-199. https://www.academia.edu/download/52853155/Hinojosa_Et_al_2017_JOM_Cognitive_Dissonance_Theory_Review-Submitted_Manuscript.pdf
Hossain, M., Hamid, P., Abdul, A.B., Tat, P. and Hon, H., 2020. Influence Of Marketing Mix On Customer Satisfaction In Real Estate: Mediating Effect Of Technology & Moderating Effect Of Government & Building Process In Bangladesh. European Journal of Molecular & Clinical Medicine, 7(8), pp.80-96. https://ejmcm.com/article_2803_aae37845ca4f04e3f4787bf26922c78e.pdf
Know more about UniqueSubmission’s other writing services:
