
MANAGEMENT OPERATIONS
Development of businesses depending on the management process adopted by the company as it is the process of controlling business activities. A big organization is required to maintain several sectors and there is also a requirement of proper connection between businesses, so management controls the activities.
As per the view of Akhtaret al. (2018, p.45), a good guide can enhance the business performance, so it is expected from a managerial accountant to show the path towards the company goal. This assignment has been conducted on the basis of uses management skills in N-Tech UK Ltd which is a new Smartphone manufacturing company.

2. Role of Management Accounting in N-Tech UK Ltd.
Management of an organization has a widespread role in development, maintenance and also in coordination.
N-Tech is a Smartphone manufacturing and selling company which has a total of six departments, and it is necessary to maintain proper coordination between these sectors. As per the view of Butler, Szwejczewski and Sweeney (2018, p.387), it can be said that the management accountant has several roles in each department but there exist few common roles such as:
Preparing Plans: N-Tech has been developed in a short period of time and the company needs future plans in order to increase sales. As per the view of Choi, Chan and Yue (2016, p.85), management accounting helps to prepare plans based on the present market scenario and present internal business condition.
Hence, it can be said that in the management process managerial accountant takes an essential role as N-Tech UK Ltd. able to make a proper plan which will enhance the overall performance.
Make an appropriate decision: A company needs to make several decisions regarding production as well as strategies; management skills help a company to make a faster and appropriate decision (Eng’airo and Mate, 2020, p.45). N-Tech is a new company and market competition in the Smartphone market is huge, so a good decision can make a high growth of its products.
On the other side, lack of management accounting means a lack of financial and market analysis, so a company cannot succeed in the long run.
Tracing Problems and Solving:There are several issues while maintaining a big company but it is also necessary to fix them efficiently. As per the view of Holmströmet al. (2019, p.729), problem solving activities is one of the vital roles of a managerial accountant, so N-Tech UK Ltd. needs a managerial accountant to trace problems in the six sectors and to take steps towards solving such problems.
Resource management: Funding and resources are one of the basic needs for a newly established business firm however; a random selection can be dangerous for the firm (Hu, Williams, Mason and Found, 2019, p.867). It can be seen that there are two major sources of funds debt and equity so, after analyzing the capital structure the funding process required to proceed.
3. Management Accounting and Financial Accounting – Difference
A financial accountant involved in maintaining financial data of a company and through the financial report a financial accountant helps a company in numerous ways. On the other side, a managerial accountant is involved in controlling and maintenance related activities and provides guidance with the help of financial data.
As per the view of Larson and Foropon (2018, p.35), it can be said that a managerial accountant uses the data provided by the financial accountant in order to guide a company. Hence, based on the activity’s differentiation can be made between managerial accounting and financial accounting.
It can be said that the job of a financial accountant is mainly based on past activities and recording the data in a presentable and understandable manner is the main function. However, managerial accounting has a precise role in the organization as it utilizes financial data and tries to find out problems in the financial performance of the company.
As per the view of Lin and Taylor (2017, p.15), management accounting is a forward process as it involves making budgets, planning and strategies. Managerial accounting is a random process as it requires to look at the actual performance with the prescribed report. However, financial accounting occurs in a gap of six to one years in order to make an annual report or interim report.
4. Uses of costing models in operational management
4.1. Costing models in operational management
Maximizing profit by reducing expenses and increasing efficiency of labors is necessary for an organization. It can be seen that N-Tech UK Ltd. wants a return on capital employed to reach up to 22% and it can be possible by increasing the net profit.
According to Matthias, Fouweather, Gregory and Vernon (2017, p.55), activity-based costing model is a widely used method to track the expenses activities and act accordingly. Therefore, N-Tech is able to find out the high costs as a result, by reducing the costs of the company being able to attend the required percentage.
As per the view of McGovern, Small and Hicks (2017, p.15), monitoring present performance helps to make future plans and ABC models help management to measure the present performance of the company. Therefore, it can be said that N-Tech needs to use costing models in order to enhance the operational performance of the company.
- Break-even point analysing technique
| Sales per unit | 200 | 100% |
| Less: VC per unit | 150 | 75% |
| Contribution per unit | 50 | 25% |
| Total Fixed Costs | 2,500,000 | |
| BEP Unit | 50,000 | |
| BEP Sales | 10,000,000 |
Table 1: Break even Analysis
(Source: Created by researcher)
This is a technique to understand the point of sale which is required to produce in order to avoid losses. This technique has been implemented in the present cost structure of N-Tech UK Ltd.
It is observable that the company is currently selling its Smartphone at £200 per unit for which it costs £150 per unit. Apart from that, there exist fixed costs amounting £2,500,000 which is required to be taken into consideration. Based on the BEP calculation it has been found that the contribution per unit is £50, so the BEP unit is £2500000 / £50 or, 50,000 units.
Hence, the company needs to make a total sale of £10,000,000 in order to reach the BEP point.
5. Capital Investment Appraisal Technique
Analyzing the attractiveness of a project is necessary before investing in a project, so N-Tech Uk Ltd. requires to use investment appraisal techniques in order to select a proposal.
Based on the prediction of possible outcome from an investment process these appraisal techniques can be used. This assignment has a requirement of preparing three commonly used investment appraisal techniques, these are as follows:
| Proposal 1 | ||||||
| Cash flows (£ms) | Cash Flows | CCF | DCF @10% | PV (@10%) | DCF @30% | PV (@30%) |
| Year 0 | -24 | -24 | 1 | -24 | 1 | -24 |
| Year 1 | 16 | -8 | 0.91 | 14.56 | 0.77 | 12.32 |
| Year 2 | 12 | 4 | 0.83 | 9.96 | 0.59 | 7.08 |
| Year 3 | 8 | 12 | 0.75 | 6 | 0.46 | 3.68 |
| Year 4 | 4 | 16 | 0.68 | 2.72 | 0.35 | 1.4 |
| Year 5 | -8 | 8 | 0.62 | -4.96 | 0.27 | -2.16 |
| Residual value | 0 | 8 | 0.62 | 0 | 0.27 | 0 |
| NPV = | 4.28 | -1.68 | ||||
| PBP = | 1 | year | 8 | month | ||
| IRR = ra + {Na * (rb – ra) / (Na – Nb)} | ||||||
| Where, | ||||||
| ra = Lower DCF = | 10% | |||||
| rb = Higher DCF = | 30% | |||||
| Na = NPV at ra = | 4.28 | |||||
| Nb = NPV at rb = | -1.68 | |||||
| Therefore, | ||||||
| IRR = | 24.4% | |||||
Table 2: Proposal 1
(Source: Created by researcher)
| Proposal 2 | ||||||
| Cash flows (£ms) | Cash Flows | CCF | DCF @10% | PV (@10%) | DCF @30% | PV (@30%) |
| Year 0 | -19 | -19 | 1 | -19 | 1 | -19 |
| Year 1 | 2 | -17 | 0.91 | 1.82 | 0.77 | 1.54 |
| Year 2 | 8 | -9 | 0.83 | 6.64 | 0.59 | 4.72 |
| Year 3 | 8 | -1 | 0.75 | 6 | 0.46 | 3.68 |
| Year 4 | 12 | 11 | 0.68 | 8.16 | 0.35 | 4.2 |
| Year 5 | 10 | 21 | 0.62 | 6.2 | 0.27 | 2.7 |
| Residual value | 0 | 21 | 0.62 | 0 | 0.27 | 0 |
| NPV = | 9.82 | -2.16 | ||||
| PBP | 3 | year | 1 | month | ||
| IRR = ra + {Na * (rb – ra) / (Na – Nb)} | ||||||
| Where, | ||||||
| ra = Lower DCF = | 10% | |||||
| rb = Higher DCF = | 30% | |||||
| Na = NPV at ra = | 9.82 | |||||
| Nb = NPV at rb = | -2.16 | |||||
| Therefore, | ||||||
| IRR = | 26.4% | |||||
Table 3: Proposal 2
(Source: Created by researcher)
| Proposal 3 | ||||||
| Cash flows (£ms) | Cash Flows | CCF | DCF @10% | PV (@10%) | DCF @30% | PV (@30%) |
| Year 0 | -16 | -16 | 1 | -16 | 1 | -16 |
| Year 1 | 6 | -10 | 0.91 | 5.46 | 0.77 | 4.62 |
| Year 2 | 8 | -2 | 0.83 | 6.64 | 0.59 | 4.72 |
| Year 3 | 6 | 4 | 0.75 | 4.5 | 0.46 | 2.76 |
| Year 4 | 6 | 10 | 0.68 | 4.08 | 0.35 | 2.1 |
| Year 5 | 4 | 14 | 0.62 | 2.48 | 0.27 | 1.08 |
| Residual value | 0 | 14 | 0.62 | 0 | 0.27 | 0 |
| NPV = | 7.16 | -0.72 | ||||
| PBP | 2 | year | 4 | month | ||
| IRR = ra + {Na * (rb – ra) / (Na – Nb)} | ||||||
| Where, | ||||||
| ra = Lower DCF = | 10% | |||||
| rb = Higher DCF = | 30% | |||||
| Na = NPV at ra = | 7.16 | |||||
| Nb = NPV at rb = | -0.72 | |||||
| Therefore, | ||||||
| IRR = | 28.2% | |||||
Table 4: Proposal 3
(Source: Created by researcher)
| Proposal 4 | ||||||
| Cash flows (£ms) | Cash Flows | CCF | DCF @10% | PV (@10%) | DCF @30% | PV (@30%) |
| Year 0 | -32 | -32 | 1 | -32 | 1 | -32 |
| Year 1 | 6 | -26 | 0.91 | 5.46 | 0.77 | 4.62 |
| Year 2 | 10 | -16 | 0.83 | 8.3 | 0.59 | 5.9 |
| Year 3 | 18 | 2 | 0.75 | 13.5 | 0.46 | 8.28 |
| Year 4 | 16 | 18 | 0.68 | 10.88 | 0.35 | 5.6 |
| Year 5 | 12 | 30 | 0.62 | 7.44 | 0.27 | 3.24 |
| Residual value | 8 | 38 | 0.62 | 4.96 | 0.27 | 2.16 |
| NPV = | 18.54 | -2.2 | ||||
| PBP | 2 | year | 11 | month | ||
| IRR = ra + {Na * (rb – ra) / (Na – Nb)} | ||||||
| Where, | ||||||
| ra = Lower DCF = | 10% | |||||
| rb = Higher DCF = | 30% | |||||
| Na = NPV at ra = | 18.54 | |||||
| Nb = NPV at rb = | -2.2 | |||||
| Therefore, | ||||||
| IRR = | 27.9% | |||||
Table 5: Proposal 4
(Source: Created by researcher)
Payback Period: The requirement of calculating PBP is to identify the period which is going to take to cover the invested money from the cash inflow of projects (Meng, Purvis and Disney, 2018, p.2).
This calculation has been made by preparing cumulative cash flows for the five years of proposal program. It has been found that proposal 1 will take the shortest time to cover the initial investment and the period is 1 year and 8 months. Proposal 2 has the longest PBP; it is 3 years and 1 month followed by proposal 4 and then proposal 3.
Net Present Value: Calculation of NPV provides the idea of the income from the proposals in the present day’s value. As per the view of Ochienget al. (2018, p.5), it is a great capital budgeting tool as it helps management to make an appropriate decision.
N-Tech UK Ltd. has a cost of capital of 10% and this percentage has been taken as a discounting factor in this investment appraisal technique. Based on the calculation of NPV it can be seen that the proposal 4 has the highest net present value compared to the other three available options as it is £18.54. The least NPV has been found in proposal 1 which is £4.28 followed by proposal 3 and proposal 2.
Internal Rate of Return: N-Tech UK Ltd. requires to know the return rate of the proposal in order to estimate the profitability rate of the four available investment options. This calculation has been processed with an additional calculation of NPV while the discounting factor is 30%.
Based on the calculation it has been found that the highest IRR is approximately 28.2% from proposal 3. The next highest IRR is approximately 27.9% from proposal 4 followed by proposal 2 and the least is proposal 1.
- Decision
Based on analysing investment appraisal techniques it has been found that there are limitations in each proposal, so there is a requirement of selection based on rankings. It is observable that proposal 4 has a higher than average score in investment appraisal techniques, so proposal 4 is recommended among four available investment options.
Market competition is high in the business sector so a proper business plan is important to reduce the internal costs and products can be offered at a lower price.
As per the view of Seseni and Mbohwa (2017, p.32), the business plan is a process ensuring the path towards business goals, it includes an in-depth analysis of the market condition and internal financial condition. Budget is part of the business plan which provides an estimation of possible costs. Therefore, a budget provides the guidelines in the production sector and by meeting the target they ensure the path of profitability.
7. Role of Business Plan and Budget in operational management in N-Tech UK Ltd.
Management made budgets based on the possible future sales and by analyzing the price point of costs. As per the view of Smith and Bititci (2017, p.23), a good business plan accepts quality products thus budget required to be made by balancing the costs and quality.
It can be seen that N-Tech has a demand for obtaining a high profit so, proper business planning is necessary to reach the goal. Apart from that, it is necessary to have proper coordination between the production and selling department which can be obtained through a good business plan. Moreover, for high revenue earnings, it is necessary to follow a budget in order to reduce the costs.
Based on the analysis budget of N-Tech in the manufacturing department it is observable that there exists a negative variance in the budget report. Moreover, there is a lack of a proper business plan as there are missing the required total units to be sold in a year.
A budget needs to be prepared to focus on the business goal which is obtaining profits of £7,500,000. Therefore, the next requirement is calculating the required unit through which the required profit can be obtained. Based on the calculations it has been found that the company required to make revenue of £40,000,000 by selling 200,000 units of products.
The preparation of the monthly budget can be prepared by dividing the annual budget by 12 so; the monthly budget is 16,500 units.
Manufacturing units are required to know the final target of the company so that they are able to make supplies of finished products. Moreover, the utilization percentage helps them to monitor the percentage they have obtained in a month. Therefore, N-Tech UK Ltd. can implement the revised budget report into its system in order to make good coordination in requirements and supplies.
- Revised Budget Report
| Required Profit | £ 7,500,000.00 | |
| Add: Fixed costs | £ 2,500,000.00 | |
| Required Total Contribution | £ 10,000,000.00 | 25% |
| Add: Total Variable Costs | £ 30,000,000.00 | 75% |
| Required Total Sales | £ 40,000,000.00 | 100% |
| Required Units for sale | 200,000 |
| Annual Budget | Budget | Actual | Variances | Variances % | Utilization % | |
| Unit | 200,000 | 16,500 | 6,000 | 10,500 | 63.64% | 3.00% |
| COST:- | ||||||
| Material | 1,640,000.00 | 135,300.00 | 49,000.00 | 86,300.00 | 63.78% | 2.99% |
| Suppliers | 840,000.00 | 69,300.00 | 22,500.00 | 46,800.00 | 67.53% | 2.68% |
| Direct Labour | 400,000.00 | 33,000.00 | 10,500.00 | 22,500.00 | 68.18% | 2.63% |
| Indirect Labour | 240,000.00 | 19,800.00 | 6,200.00 | 13,600.00 | 68.69% | 2.58% |
| Depreciation | 120,000.00 | 9,900.00 | 3,000.00 | 6,900.00 | 69.70% | 2.50% |
| Share of sales costs | 180,000.00 | 14,850.00 | 4,800.00 | 10,050.00 | 67.68% | 2.67% |
| Apportioned overhead | 800,000.00 | 66,000.00 | 25,000.00 | 41,000.00 | 62.12% | 3.13% |
| TOTAL | 4,220,000.00 | 348,150.00 | 121,000.00 | 227,150.00 | 65.24% | 2.87% |
Table 6: Revised Budget Report
(Source: Created by researcher)
It is recommended to N-Tech UK Ltd. to establish a proper budget in their manufacturing process in order to improve the production power. Cost reduction is necessary to provide their product at a low price as a result demand for the product will be increased.
Apart from that, actual production has a potential efficiency to provide a high supply, so it is recommended to the company to enhance the production unit. A budget needs to be realistic and attainable, so N-Tech requires to analyze whether the production is possible in the current state of the production unit.
9. Balanced Scorecard Approach
Development of business plans and strategies is crucial for a big company, so it is necessary to use proper technique to enhance the performance. The balanced scorecard is a strategic management process which analysis mainly four sectors
- Learning and growths
- Customers
- Business process
- Financial
Based on analysing the condition of each decision can be made regarding its current position. It also includes the target in the scorecard, so targets are required to be obtainable. As per the view of Ward and Cook (2017, p.15), it can be said that through this process a company can obtain its target and be able to enhance performance and the growth can be measured.
10. Importance of Balanced Scorecard Approach
N-Tech UK Ltd. needs to use the balanced scorecard approach because of its importance and usefulness. This approach specifically analyses the present condition of a company, so a company is able to gain an idea about its status compared to other companies in the same field.
According to Butler, Szwejczewski and Sweeney (2018, p.389), it helps to improve the performance of the company from the point of view of customers. Hence, it can be said that the improvement of sales can be possible by enhancing customer’s services.
The balanced scorecard also provides indicators through which the company can confirm that strategic management is working. Initiatives can be taken based on the condition and it is easy to take initiative by analysing the objectives, measures and targets.
11. Balance Scorecard – N-Tech UK Ltd.
| Objectives | Measures | Targets | Initiatives | |
| Financial perspectives | Increasing the revenue and profit margin | Financial report analysis | Increase return on capital employed to 22% and profit before tax to £7.5 million | Increase in production and reduction of costs |
| Customer’s perspectives | Satisfying customers | Customer surveys within 4 weeks after the sale | Excellency report minimum 85% | Enhancing responses to the customers |
| Business process | Increasing the quality of products | Analyzing the finished products | Rectifying defective finished products at least by 3% | Introducing new quality measurement system |
| Learning and growth | Improvement in skills of technical staffs and increasing employee retention | Quality checking and retention rate | Qualifying employees to NVQ 4 to BSc honors | Reducing staff turnover from 35% to 25% and increasing the skilled staff’s turnover by 7.5% |
Based on the balanced scorecard of N-Tech UK Ltd. it can be said that a critical analysis of financial perspectives is necessary for the company. It can be seen that the company has a specific goal of obtaining PBT of £7.5 million hence though this scorecard the improvement can be traced. Satisfying customers is also necessary in order to increase the total number of sales thus through a fast response process the target can be obtained.
However, product quality improvement is necessary to satisfying customers thus a quality measuring system can be an effective way to enhance quality. Although overall quality improvement is possible with skilled technical employees, N-Tech is focusing on retaining highly qualified employees by offering them good salary increments.
Managerial activities have a high significance in the organization as based on their guidance a company steps forward towards the goal. N-Tech is a Smartphone company having a large number of departments thus there is a need for good management accounting. Therefore, it can be concluded that managerial accounting leads a company efficiently and skillfully.
Akhtar, P., Khan, Z., Frynas, J.G., Tse, Y.K. and Rao‐Nicholson, R., 2018. Essential micro‐foundations for contemporary business operations: top management tangible competencies, relationship‐based business networks and environmental sustainability. British Journal of Management, 29(1), pp.43-62.
Butler, M., Szwejczewski, M. and Sweeney, M., 2018. A model of continuous improvement programme management. Production Planning & Control, 29(5), pp.386-402.
Choi, T.M., Chan, H.K. and Yue, X., 2016.Recent development in big data analytics for business operations and risk management. IEEE transactions on cybernetics, 47(1), pp.81-92.
Eng’airo, P. and Mate, M.E., 2020. BUSINESS IMPROVEMENT MOTIVE OF HUMAN RESOURCE OUTSOURCING AND PERFORMANCE OUTCOMES AMONG MOBILE TELECOMMUNICATION FIRMS IN KENYA. African Journal of Emerging Issues, 2(3), pp.41-53.
Holmström, J., Holweg, M., Lawson, B., Pil, F.K. and Wagner, S.M., 2019. The digitalization of operations and supply chain management: Theoretical and methodological implications. Journal of Operations Management, 65(8), pp.728-734.
Hu, Q., Williams, S., Mason, R. and Found, P., 2019. Knowledge management in consultancy-involved process improvement projects: cases from Chinese SMEs. Production Planning & Control, 30(10-12), pp.866-880.
Larson, P.D. and Foropon, C., 2018. Process improvement in humanitarian operations: an organisational theory perspective. International Journal of Production Research, 56(21), pp.6828-6841.
Lin, Y. and Taylor, B., 2017. Use online training and development to improve staff performance as well as customer service in order to achieve business improvement.
Matthias, O., Fouweather, I., Gregory, I. and Vernon, A., 2017. Making sense of big data–can it transform operations management?. International Journal of Operations & Production Management.
McGovern, T., Small, A. and Hicks, C., 2017.Diffusion of process improvement methods in European SMEs. International Journal of Operations & Production Management.
Meng, X., Purvis, L. and Disney, S., 2018.Understanding your supply chain: dynamic value stream mapping for business improvement.
Ochieng, E.G., Ovbagbedia, O.O., Zuofa, T., Abdulai, R., Matipa, W., Ruan, X. and Oledinma, A., 2018.Utilising a systematic knowledge management based system to optimise project management operations in oil and gas organisations. Information Technology & People.
Seseni, L. and Mbohwa, C., 2017. The Use of Total Quality Management as a Business Improvement Strategy in Soweto Furniture Manufacturing SMMEs, South Africa.
Smith, M. and Bititci, U.S., 2017. Interplay between performance measurement and management, employee engagement and performance. International Journal of Operations & Production Management.
Ward, K. and Cook, I., 2017. Business improvement districts in the United Kingdom: Territorialising a ‘global’model?. In Territorial Policy and Governance (pp. 149-168). Routledge.
| Sales per unit | 200 | 100% |
| Less: VC per unit | 150 | 75% |
| Contribution per unit | 50 | 25% |
| Total Fixed Costs | 2,500,000 | |
| BEP Unit | 50,000 | |
| BEP Sales | 10,000,000 |
Table 1: Break even Analysis
(Source: Created by researcher)
| Proposal 1 | ||||||
| Cash flows (£ms) | Cash Flows | CCF | DCF @10% | PV (@10%) | DCF @30% | PV (@30%) |
| Year 0 | -24 | -24 | 1 | -24 | 1 | -24 |
| Year 1 | 16 | -8 | 0.91 | 14.56 | 0.77 | 12.32 |
| Year 2 | 12 | 4 | 0.83 | 9.96 | 0.59 | 7.08 |
| Year 3 | 8 | 12 | 0.75 | 6 | 0.46 | 3.68 |
| Year 4 | 4 | 16 | 0.68 | 2.72 | 0.35 | 1.4 |
| Year 5 | -8 | 8 | 0.62 | -4.96 | 0.27 | -2.16 |
| Residual value | 0 | 8 | 0.62 | 0 | 0.27 | 0 |
| NPV = | 4.28 | -1.68 | ||||
| PBP = | 1 | year | 8 | month | ||
| IRR = ra + {Na * (rb – ra) / (Na – Nb)} | ||||||
| Where, | ||||||
| ra = Lower DCF = | 10% | |||||
| rb = Higher DCF = | 30% | |||||
| Na = NPV at ra = | 4.28 | |||||
| Nb = NPV at rb = | -1.68 | |||||
| Therefore, | ||||||
| IRR = | 24.4% | |||||
Table 2: Proposal 1
(Source: Created by researcher)
Annexure 3
| Proposal 2 | ||||||
| Cash flows (£ms) | Cash Flows | CCF | DCF @10% | PV (@10%) | DCF @30% | PV (@30%) |
| Year 0 | -19 | -19 | 1 | -19 | 1 | -19 |
| Year 1 | 2 | -17 | 0.91 | 1.82 | 0.77 | 1.54 |
| Year 2 | 8 | -9 | 0.83 | 6.64 | 0.59 | 4.72 |
| Year 3 | 8 | -1 | 0.75 | 6 | 0.46 | 3.68 |
| Year 4 | 12 | 11 | 0.68 | 8.16 | 0.35 | 4.2 |
| Year 5 | 10 | 21 | 0.62 | 6.2 | 0.27 | 2.7 |
| Residual value | 0 | 21 | 0.62 | 0 | 0.27 | 0 |
| NPV = | 9.82 | -2.16 | ||||
| PBP | 3 | year | 1 | month | ||
| IRR = ra + {Na * (rb – ra) / (Na – Nb)} | ||||||
| Where, | ||||||
| ra = Lower DCF = | 10% | |||||
| rb = Higher DCF = | 30% | |||||
| Na = NPV at ra = | 9.82 | |||||
| Nb = NPV at rb = | -2.16 | |||||
| Therefore, | ||||||
| IRR = | 26.4% | |||||
Table 3: Proposal 2
(Source: Created by researcher)
| Proposal 3 | ||||||
| Cash flows (£ms) | Cash Flows | CCF | DCF @10% | PV (@10%) | DCF @30% | PV (@30%) |
| Year 0 | -16 | -16 | 1 | -16 | 1 | -16 |
| Year 1 | 6 | -10 | 0.91 | 5.46 | 0.77 | 4.62 |
| Year 2 | 8 | -2 | 0.83 | 6.64 | 0.59 | 4.72 |
| Year 3 | 6 | 4 | 0.75 | 4.5 | 0.46 | 2.76 |
| Year 4 | 6 | 10 | 0.68 | 4.08 | 0.35 | 2.1 |
| Year 5 | 4 | 14 | 0.62 | 2.48 | 0.27 | 1.08 |
| Residual value | 0 | 14 | 0.62 | 0 | 0.27 | 0 |
| NPV = | 7.16 | -0.72 | ||||
| PBP | 2 | year | 4 | month | ||
| IRR = ra + {Na * (rb – ra) / (Na – Nb)} | ||||||
| Where, | ||||||
| ra = Lower DCF = | 10% | |||||
| rb = Higher DCF = | 30% | |||||
| Na = NPV at ra = | 7.16 | |||||
| Nb = NPV at rb = | -0.72 | |||||
| Therefore, | ||||||
| IRR = | 28.2% | |||||
Table 4: Proposal 3
(Source: Created by researcher)
| Proposal 4 | ||||||
| Cash flows (£ms) | Cash Flows | CCF | DCF @10% | PV (@10%) | DCF @30% | PV (@30%) |
| Year 0 | -32 | -32 | 1 | -32 | 1 | -32 |
| Year 1 | 6 | -26 | 0.91 | 5.46 | 0.77 | 4.62 |
| Year 2 | 10 | -16 | 0.83 | 8.3 | 0.59 | 5.9 |
| Year 3 | 18 | 2 | 0.75 | 13.5 | 0.46 | 8.28 |
| Year 4 | 16 | 18 | 0.68 | 10.88 | 0.35 | 5.6 |
| Year 5 | 12 | 30 | 0.62 | 7.44 | 0.27 | 3.24 |
| Residual value | 8 | 38 | 0.62 | 4.96 | 0.27 | 2.16 |
| NPV = | 18.54 | -2.2 | ||||
| PBP | 2 | year | 11 | month | ||
| IRR = ra + {Na * (rb – ra) / (Na – Nb)} | ||||||
| Where, | ||||||
| ra = Lower DCF = | 10% | |||||
| rb = Higher DCF = | 30% | |||||
| Na = NPV at ra = | 18.54 | |||||
| Nb = NPV at rb = | -2.2 | |||||
| Therefore, | ||||||
| IRR = | 27.9% | |||||
Table 5: Proposal 4
(Source: Created by researcher)
| Required Profit | £ 7,500,000.00 | |
| Add: Fixed costs | £ 2,500,000.00 | |
| Required Total Contribution | £ 10,000,000.00 | 25% |
| Add: Total Variable Costs | £ 30,000,000.00 | 75% |
| Required Total Sales | £ 40,000,000.00 | 100% |
| Required Units for sale | 200,000 |
| Annual Budget | Budget | Actual | Variances | Variances % | Utilization % | |
| Unit | 200,000 | 16,500 | 6,000 | 10,500 | 63.64% | 3.00% |
| COST:- | ||||||
| Material | 1,640,000.00 | 135,300.00 | 49,000.00 | 86,300.00 | 63.78% | 2.99% |
| Suppliers | 840,000.00 | 69,300.00 | 22,500.00 | 46,800.00 | 67.53% | 2.68% |
| Direct Labour | 400,000.00 | 33,000.00 | 10,500.00 | 22,500.00 | 68.18% | 2.63% |
| Indirect Labour | 240,000.00 | 19,800.00 | 6,200.00 | 13,600.00 | 68.69% | 2.58% |
| Depreciation | 120,000.00 | 9,900.00 | 3,000.00 | 6,900.00 | 69.70% | 2.50% |
| Share of sales costs | 180,000.00 | 14,850.00 | 4,800.00 | 10,050.00 | 67.68% | 2.67% |
| Apportioned overhead | 800,000.00 | 66,000.00 | 25,000.00 | 41,000.00 | 62.12% | 3.13% |
| TOTAL | 4,220,000.00 | 348,150.00 | 121,000.00 | 227,150.00 | 65.24% | 2.87% |
Table 6: Revised Budget Report
(Source: Created by researcher)
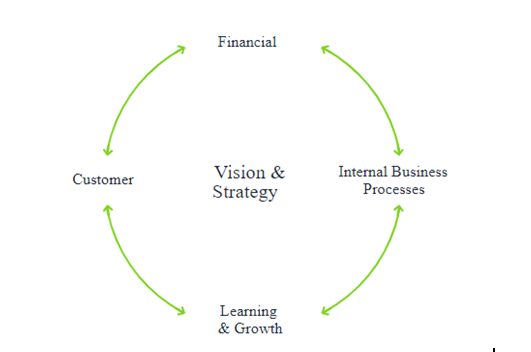
Figure 1: Balanced Scorecard Approach
(Source: Created by researcher)
