MN7002 – International Business Strategy with Simulation Assignment Sample
Module code and Title: MN7002 – International Business Strategy with Simulation Assignment Sample
Introduction
The present assessment is based on the financial analysis as well as the financial performance of the business of the “Red color team” named “Red warriors tech”. The analysis has been done based on the performance of the business over the “last 8 years” which is also helpful in the strategic planning of the business growth for the upcoming 3 years in the business process. All the “internal sources” of the business are taken into consideration for a better analysis process of the assignment which also highlights the dynamic capabilities of the business.
The assessment also helps to “review the environment of the business” including the “industrial environment” which is having a huge impact on the performance of the business. The strategic methods for the analysis of the competitive position of the business have been done based on reference of different strategic planning. The different methods of the investment over the production facilities as well as the strategy of the supplier and the production are also discussed in the assignments.
Performance over the past 8 years and your forecast for the next 3 years
Last 8 years’ performance
The business shows a fluctuating performance during the time of the last 8 years. The overall analysis can be done from the analysis of the given financial data of the business. The Business tends to be not much profitable during the fourth, 5th, and 6th years of operation, whereas an improvement can be seen during the time of the seventh and 8ty years of its operation.
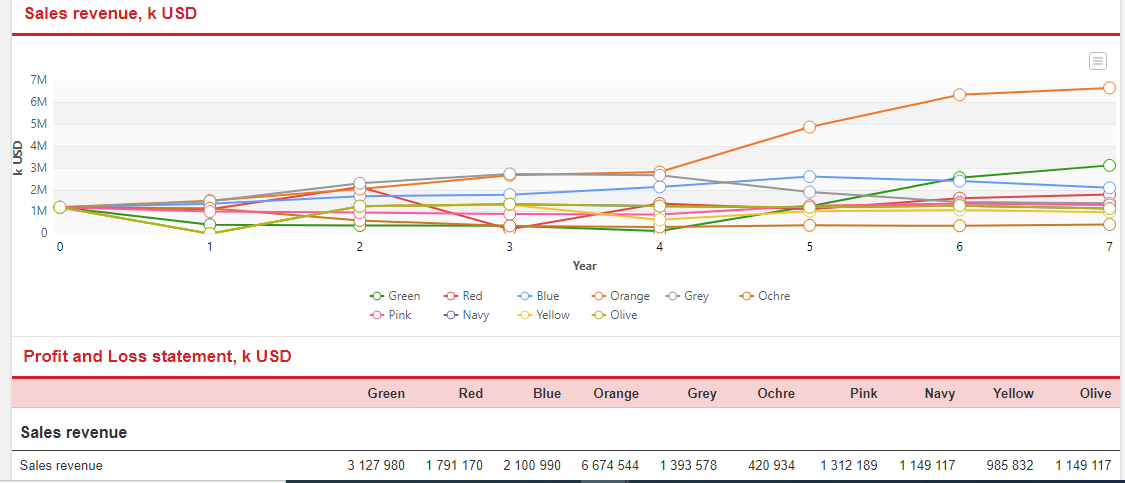 Figure 1: Sales performance of the business for the last 8 years (Source: Provided)

The above figure shows the level of sales revenue in the business operation of the Red warriors tech during the last 8 years. The above figure is helpful in the analysis of the level of sales as per the performance of the business tends to be improved along with the time span of 8 years. The sales revenue for the first year was $1314034, which shows a starting phase of the business. The next year the revenue generated was $1116461, which seems to be comparatively lower than the starting year.
Again, the revenue level rises in the 3rd year to $2134488. Again, the business shows a downfall in performance in the 3-4 years and an improvement can be assumed in the 8th year, which shows revenue of $1791170. This shows that the performance of the business as per the level of sales was not to the level of profitability during its operational years but during the 8th year, an improvement can be analyzed in the performance of the business.
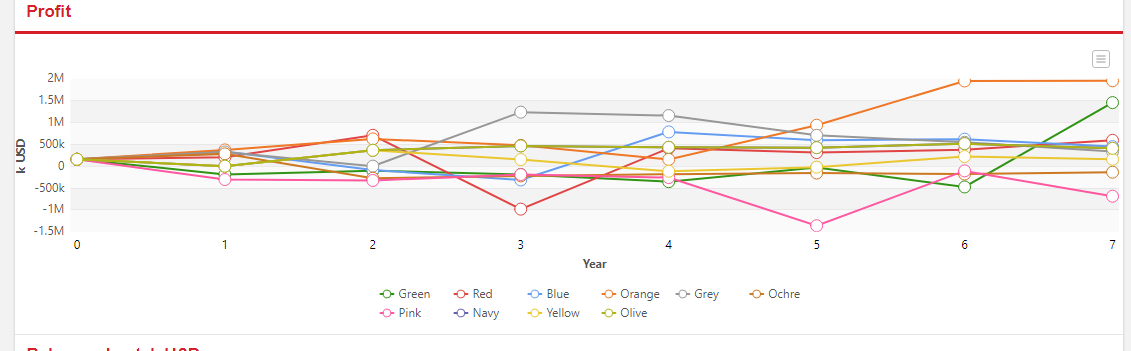 Figure 2: Profit fluctuation of the business for the last 8 years (Source: Provided)
The level of profit determines the financial stability as well as the financial position of the business. The above table depicts the profit level of the business for the last 8 years of the business operation. The level of profit can be easily analyzed as the profit assumed in the first year amounted to $396141, which shows a growth in the 3rd year of operation of the business showing the profit level as $706933.
The fourth year was not profitable but the improvement was seen in the 5th year as compared to the fourth year showing a profit level of $407782. Again, the 6th and 7th year was not profitable but the business was again earning a higher level of profit in the 8th year with an amount of $591989. This also shows that the business is moving towards improvement in the upcoming years if the business follows proper profitable strategies in the process.
Forecasting for the upcoming 3 years of the business operation
| Upcoming Year | Sales Revenue ($) | Profit ($) |
| 9th year of operation | 1895480 | 656584 |
| 10th year of operation | 1953650 | 698950 |
| 11th year of operation | 1995600 | 745640 |
Table1: Forecasting of sales and profit for upcoming 3 years (Source self-created)
The overall analysis of the business performance for the last 8 years can be helpful in the prediction of the upcoming situation of the business. The overall improvement in the sales and profit level of the business in the last year can be utilized for the upcoming performance. Therefore, the above table shows a prediction based on the sales revenue as well as the profit level of the business (Parast, 2020).
As the Sales revenue for the last year was $1791170, which was better than the previous year, it can be said that the sales revenue for the 9th year can be increased to $1895480, for the 10th year it can be $1953650 and for the 11th year can be $1995600. Again, on the other side, the level of profit can be increased to $656584 in the 9th year, $698950 in the 10th year, and $745640 in the 11th year of the business operation. Therefore, the performance can be shown as a positive result in the upcoming time.
Evaluation of strategy process and competitive position in the industry
Investment in R&D and products
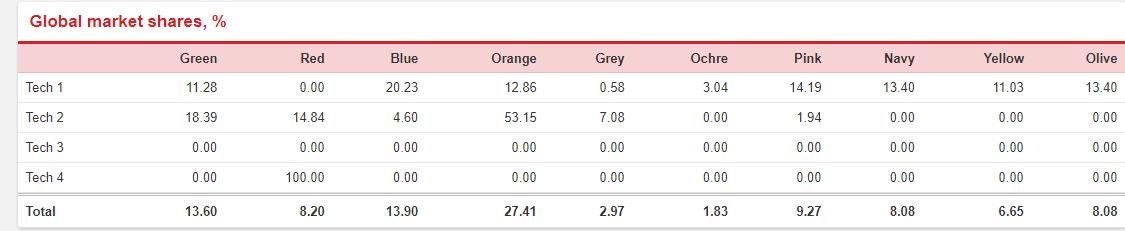 Figure 3: Global market shared investment (Source: Provided)
The above table depicts the level of investment that the team has done in the business market in order to survive in the competitive conditions of the market (Heij et al. 2020). The red team possesses different technological involvement in the business process for the research and development method. As per the table, there is no involvement of technology 1 in the business, but technology 2 is involved at a level of 14.84%, and technology 4 is at a level of 100%. Therefore, the total involvement of the technologies trends is 8.20%
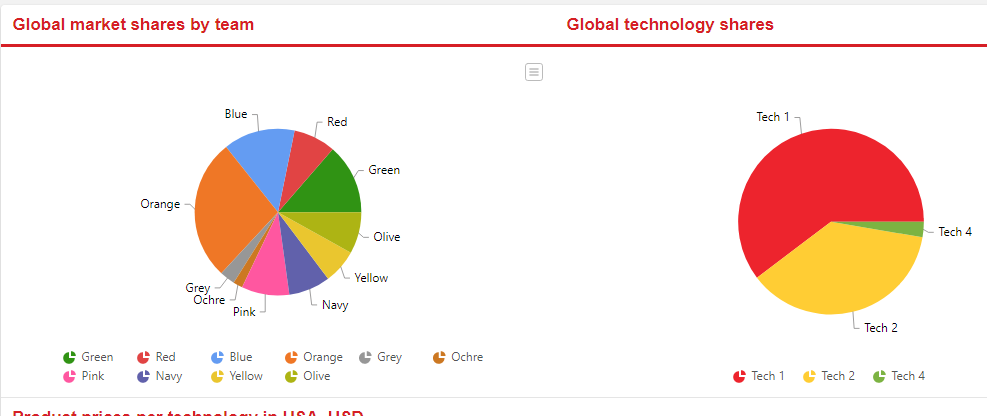 Figure 4: Global market share (Source: Provided)
The above figure depicts the involvement of the different teams in the global market shares as per the technological involvement in the business process. From the above image, it can be determined that the level of involvement of team Red and its business process is moderate as only two technological methods are involved in the process (Topchiy and Tokarskiy 2018).
Therefore it can be said that the business should move forward for further involvement of the different technological developments possessed for better performance of the business. The involvement of technology 1 has been used globally by most business entities but Team red has not been involved in the share of Technology 1. Hence, it can say that it there is an involvement of technology1, the business can move towards a better research and development process to increase the efficiency of the business operation.
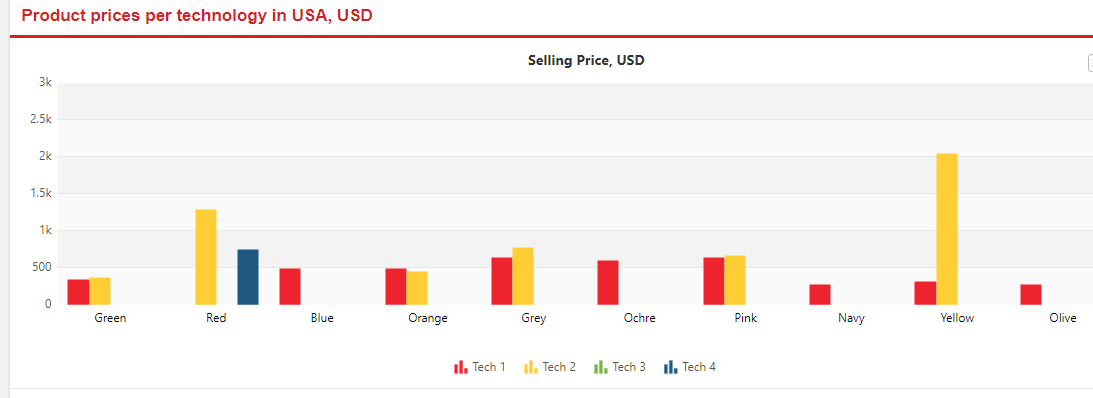 Figure 5: Product prices as per technology in the USA (Source: Provided)
The above figure depicts the price of the technological product in the business process. As compared to other businesses, the Red team tends to spend higher amounts of money in both technology 1 and 4, therefore it can be suggested to the business to reduce the product cost and introduce new methods of technology for better performance of the business.
Investment in production facilities
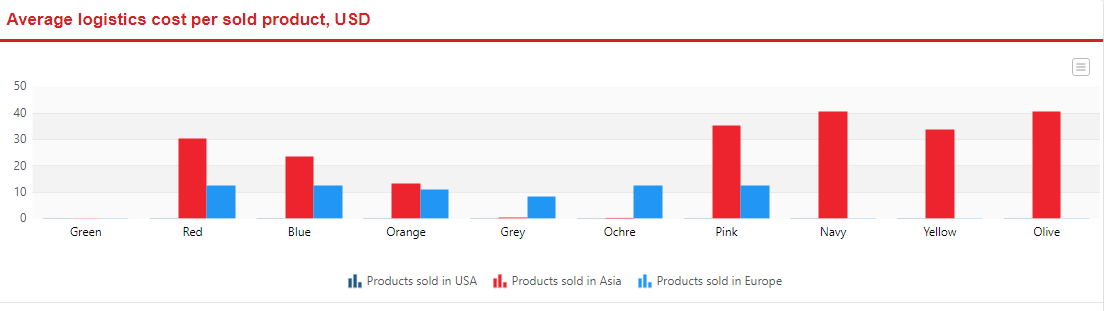 Figure 6: Cost per sold product (Source: Provided)
The above figure depicts the level of the sold product cost as per the area of the business operation. The analysis can be done based on the given information as the average logistics of the cost per sold product is high in Asia as compared to Europe (Nasridinovna, 2022). It can also be seen that there is no product valued in sales of the USA. The business operation of the present team Red is considered to have higher cost values in Asia as compared to Europe.
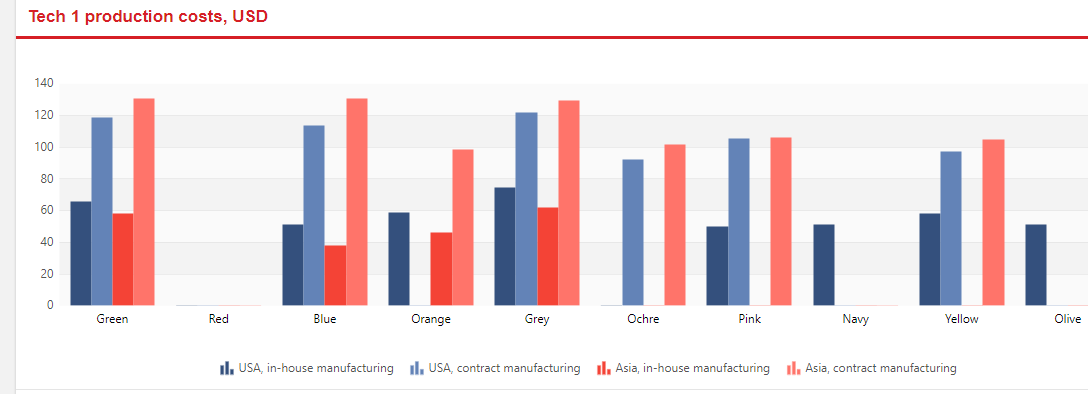 Figure 7: Production cost technology1 (Source: Provided)
The above figure shows the production cost of technology 1 as per basis in both countries on the basis of the in-house manufacturing process as well as the contract manufacturing method. As per the figure, it can be said that there is no involvement of production cost of Technology 1 by the present concerned team Red.
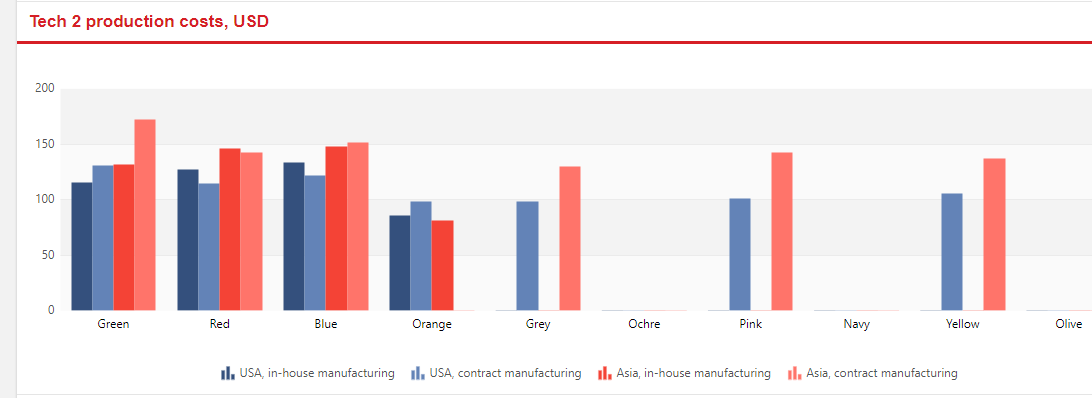 Figure 8: Production cost technology2 (Source: Provided)
Again, on the other hand it can be seen that the production cost of technology 2 is higher in Asia in both the aspect of the in-house manufacturing as well the contract manufacturing basis (Liu, et al. 2018). Therefore, the red team is responsible for bearing the cost of production as per booth the places of USA as well Asia.
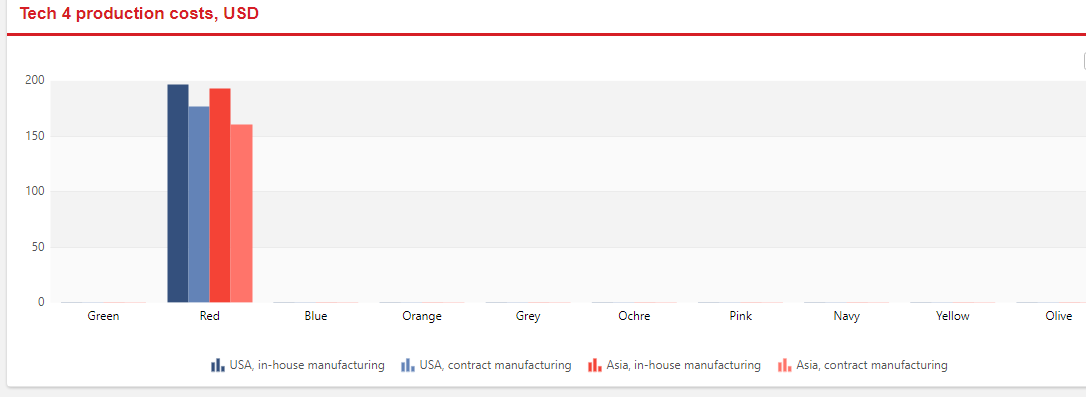 Figure 9: Production cost technology4 (Source: Provided)
The cost of production for the technology3 is not involved in the business process of the team. However, on the other side, the above table depicts the level of production cost of technology 4. The production of the technology4 is only bearable by team Red. The graph depicts that the in house manufacturing cost of the production tends to be higher as compared to the production of the contract manufacturing process.
Production strategy
There is a certain planning process for maintaining the cost of production. In the present situation of the business process, different production strategies like Chase strategy, Level production strategy, focus or Niche strategy as well as cost strategy can be implemented. In the present business, the implementation of the Cost strategy has been done (Bii and Namsonge, 2022).
The strategy can is beneficial in order to set the maximum as well as the minimum price level of the cost of production in the business process. Hence, the level of profit can be easily predictable as per the implementation of the cost-based pricing strategy of the business. Both the market-based cost, as well as the cost of manufacture, can be easily planned with the help of the cost strategy of the production method.
Use of outsourcing
Outsourcing method of strategy helps in the business process for the achievement of the goals and the objectives of the business, which also helps to add value for the enhancement of the resource base for the process of mitigating the level of risk in the business process. “Strategic outsourcing” in business refers to the involvement of the third party that is mainly involved in the management of the business entity (Niu et al. 2019). This strategy is mainly useful for the utilization of the different external resources in the best way to avail the maximum amount of profit. This also helps in leveraging the new technologies in the business industries for the improvement of the efficiency of the business.
Supplier Strategy
The evaluation of the supplier’s performance can be easily improved with the implementation of the supplier’s strategy in the business production process. The suppliers are responsible for the evaluation of the process in terms of both qualitative as well as quantitative measures of evaluation (Sako and Zylberberg, 2019). The performance of the supplier can be measured as per the production capacity of the business including the environmental impacts as well as the services provided to the customers.
In the present process of the business, the “Cost ratio method” of the supplier strategy can be followed including the “method of weighted average” for the analysis of the most frequently used commodities for the process of evolution in the business process. The evaluation of the supplier’s strategy is based on different criteria based on different elements of the business. The quality of the product, the performance of the business, the risk factors involved in the process as well as the environmental impact on the business are responsible for the evaluation process of the supplier’s
Conclusion
The above analysis of the business performance of the team Red depicts the financial position of the business. The analysis shows that the performance of the business in the last 8 years is not showing much improvement but the 8th year was comparatively better than the previous year, therefore the forecasting has been done based on last year’s performance.
Again on the other side, it is recommended to the business for using different strategic methods for the reduction of the cost of production in the business entity as well as method of Outsourcing strategies are also implemented for a better outcome for the business Red warriors tech. The Weighted average and Cost ratio method are suggested to implement as the supplier strategy to understand the requirement better and improve the business condition and enhance the production process.
Reference
Liu, J., Meyns, M., Zhang, T., Arbiol, J., Cabot, A. and Shavel, A., 2018. Triphenylphosphite as the phosphorus source for the scalable and cost-effective production of transition metal phosphides. Chemistry of Materials, 30(5), pp.1799-1807.
Nasridinovna, T.O., 2022. Use of main production facilities and economic activities of foreign textile enterprise. INTERNATIONAL JOURNAL OF RESEARCH IN COMMERCE, IT, ENGINEERING AND SOCIAL SCIENCES ISSN: 2349-7793 Impact Factor: 6.876, 16(01), pp.45-52.
Niu, B., Li, J., Zhang, J., Cheng, H.K. and Tan, Y., 2019. Strategic analysis of dual sourcing and dual channel with an unreliable alternative supplier. Production and Operations Management, 28(3), pp.570-587.
Parast, M.M., 2020. The impact of R&D investment on mitigating supply chain disruptions: Empirical evidence from US firms. International Journal of Production Economics, 227, p.107671.
Sako, M. and Zylberberg, E., 2019. Supplier strategy in global value chains: shaping governance and profiting from upgrading. Socio-Economic Review, 17(3), pp.687-707.
Topchiy, D. and Tokarskiy, A., 2018, June. Designing of structural and functional organizational systems, formed during the re-profiling of industrial facilities. In IOP Conference Series: Materials Science and Engineering (Vol. 365, No. 6, p. 062005). IOP Publishing.
Appendix 1: individual contribution log
| Activities | Individual contribution | Actual contribution |
| Presentation plan | Sanjay Rajput | Presentation agenda and summary slide preparation |
| Responsibility planning and division | JAINISH PATEL | Responsibility division |
| Financial performance analysis | Ashish Kasawala | Reports and graphs preparation and presentation |
| Competitive analysis | Amar Kumar | Team report collection |
| Market analysis with SWOT | KRISH BHAGAT | Swot analysis |
| Summary and final contribution list preparation | KRISH BHAGAT
MANDEEP GODARA |
Final overview report submisison |
Know more about UniqueSubmission’s other writing services:
