MSC Management Assignment Sample : Data driven decisions for business
a) Context
Data analysis is process of cleaning, transforming and modelling data for discovering useful information. Data analysis acts as crucial aspect for addressing requirements of Bangles. Key changes and trends for increasing importance of data analysis are technical capability, data literacy improving, increased commercial focus and better software and storage. Technical capabilities help in acquiring new technologies and resources for the purpose of research and development in company. As per Cagnin (2018), acquiring technical skills are useful for maintaining better productivity. For instance, Bangles can provide training for technical capabilities to employees for better data management. Data literacy improving facilitates iterative processes within an organization. It prioritizes which group of business needs training most and then learns and adjusts next group. Data literacy leads to increased importance of data analysis in organisations like Bangles. In contemporary business environment, increased commercial focus has enhanced understanding of companies about market. Developing commercial awareness signifies high level of interest, motivation and focus towards bottom line of business (Zhu et al. 2018). It acts as key trend that is important for data analysis in business. However, it is necessary for Bangles to prevent data theft and piracy for maintaining sound performance. Using better software helps in management and utilisation of business and industry data. In Bangles, using data management software is useful for conducting marketing campaigns fruitfully by effective use of data. Storage is efficient for storing, managing and utilising data in business. Impact of marketing campaigns can be well analysed in Bangles by effective use of data storage for storing marketing data.
Data analytics is useful for making sense of data (Marjani et al. 2017). Data analytics adds value to decision making of companies like Bangles by facilitating evidence-based decisions, faster decision making, better understanding of customer and market dynamics. Data analytics facilitates evidence-based decisions as each decision of an organisation is based on relevant data available. Therefore, application of data analytics in Bangles is useful for bringing success while operating in UK. As Bangles would be able to generate data about customers by help of data analytics, better understanding of customers can be obtained. Market dynamics act as forces that impact on behaviour of customers & producers and prices of commodities in the market. Data analytics provides a brief insight into market dynamics which can facilitate business (Erl et al. 2016). Faster decisions can be made by Bangles Company that can add value into data analysis of marketing campaigns.
b) Plan
Analytical approach is useful for breaking down an issue for solving it thoroughly. In case of Bangles Company, an analytical approach is needed for answering the question whether marketing campaigns have a positive impact on sales in UK. Therefore, analytical procedure like regression analysis can be used for answering questions. For instance, as per formative data, marketing campaigns have helped in increasing sales of bracelets, rings, necklaces, accessories and hair bands in UK. So, a positive impact of marketing campaigns can be found on sale. It can be shown by the analytical process “Regression analysis”.

Data analytics act as useful approach for answering marketing question of Bangles. Using Data Analytics Utility Lifecycle as data analytic framework acts as useful approach for answering question of Bangles. It provides comprehensive summary of data analysis of project. Data Analytics Utility Lifecycle has been discussed as under:
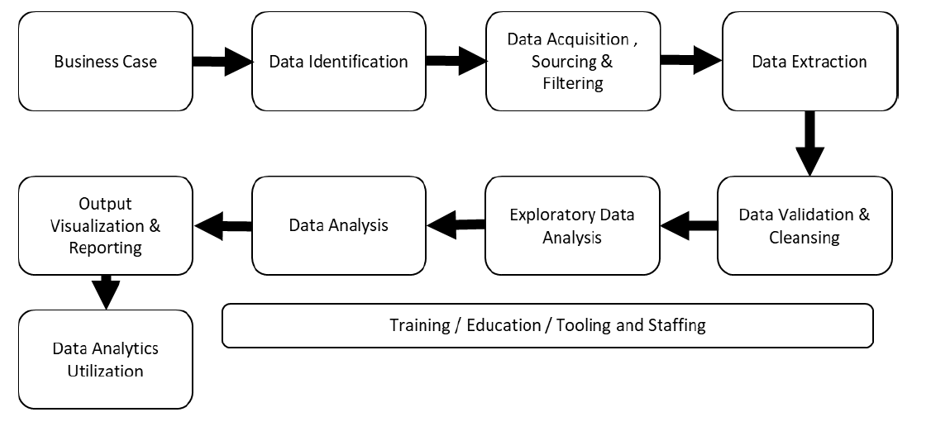
Using this framework is useful for enhancing focus on data-based decisions. Key types of data as per this framework includes financial & non-financial, structured & unstructured and qualitative & quantitative data (Bhattacharjee et al. 2019). Unstructured data is helpful for development of big data as it can be converted from data to wisdom. The framework is useful for assessing diagnostic, predictive and prescriptive analytics. For instance, fact based data on marketing campaigns, causes of marketing campaigns, impact of campaigns on sale in the UK and detailed specific action and recommendations due to campaigns can be analysed through this framework. This analytical framework is beneficial for Bangles Company as it is designed for understanding big data issues. Through this framework, main stages of data analysis are analysed by Bangles. Data of both pre-process and process data can be well utilised by the company for understanding the positive impact of marketing on sale in UK. The framework is based on relative lifecycle. Thus, the phases of project can overlap or happen sequentially according to requirement of Bangles Company. However, the framework does not include the deployment process and therefore, justification and verification of results can be tough. Processes can be skipped in this type of data analytic framework. Overall, the framework would be useful for addressing question of Bangles Company.
c) Analysis
i. Data cleaning steps
Data cleaning is process of determining and correcting inaccurate or corrupt data from record set. Data cleaning is necessary for data analysis as presence of incorrect data may hinder the process of providing correct results (Ge et al. 2020). Data cleaning is important for answering marketing campaign related questions of Bangles Company. Data cleaning can take place from the following steps:
Removing irrelevant observations includes determining if there exists any irrelevant data in database. Understanding duplicate observation or data which are not related to requirements of business are unwanted data. Thorough observation of database can be useful for identification of errors.
Fixing structural errors are measurement or transferring of data that shows strange conversion, or incorrect capitalisation. Such inconsistency can cause mislabelled categories of class. For instance, of sales volume and sales unit both appear in database, they should be treated as one class instead of two.
Filtering unwanted outliers does not appear to fit within data analysis of organisations. With legitimate reasons for removing unwanted outliers, elements like improper data entry, incorrect sales amount or data not related to the 5th month of 2020 can be filtered by Bangles Company.
Handling missing data acts as crucial step for assessing marketing data of 2020 month 5. Under this step, observations were dropped as per missing values and inputs of missing value are estimated for determining impact of marketing on sales in UK.
Validating and quality assurance is end of data cleaning process. At this stage, impact of data, efficiency of data as per rules for the field, importance of data on bringing light on aspects and trends in data can be analysed. Maintaining quality assurance aspects is useful for preventing data quality issues (Ao and Chirkova, 2019). Through these steps, data cleaning can take place for Bangles Company.
ii. Analytical techniques
Analytical technique i.e. regression analysis is useful for assessing whether marketing campaign of Bangles Company has positive impact on sales in UK. Use of table and charts can be made for visualisation impact of marketing campaign on sale in UK. As per data analysis, marketing acts as an independent variable and sales is a dependent variable.
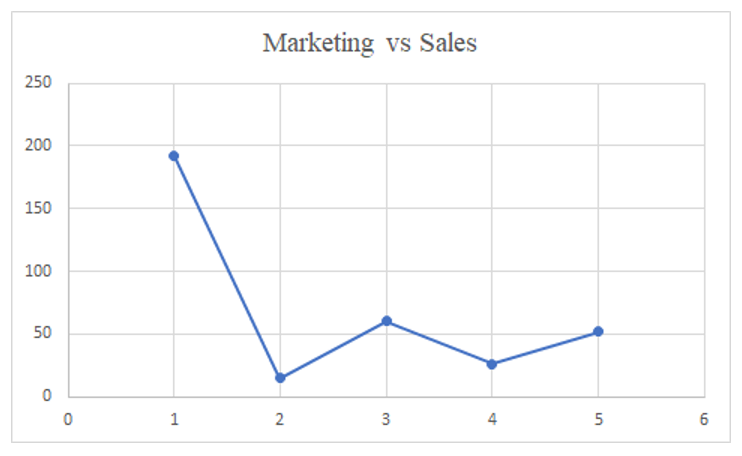
By pattern of dots, clear relationship between marketing campaign and sale of product category can be analysed in UK. A positive relationship between marketing campaign and sales can be assessed through data visualisation. Moreover, statistical measures can be used for measuring strength of relationship between two variables: sale volume (X) and sale value (Y). If relationship was 1 then all of increase in sales value is explained by changes in sale volume, as they are perfectly correlated.
| Marketing campaign in UK market in month 5 2020 (For Bangles Company) | ||||
| Year | Month | Category | Sales Volume | Sales Value |
| 2020 | 5 | Bracelet | 192 | 189949 |
| Ring | 15 | 18253 | ||
| Necklace | 60 | 90032 | ||
| Accessory | 26 | 47912.4 | ||
| Hair band | 52 | 53761.8 | ||
For this dataset formula to quantify relationships can be used. As per basic algebra, Y = a + bX. Here, a is straight line cuts Y axis. We know this is case because when X = 0, Y must equal a. On the other hand, b is gradient of line, so every time increase in X by i.e. 1 point on line goes up by b.
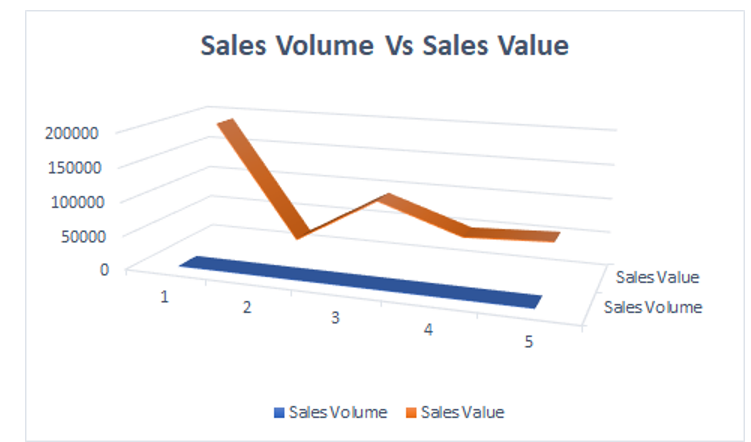
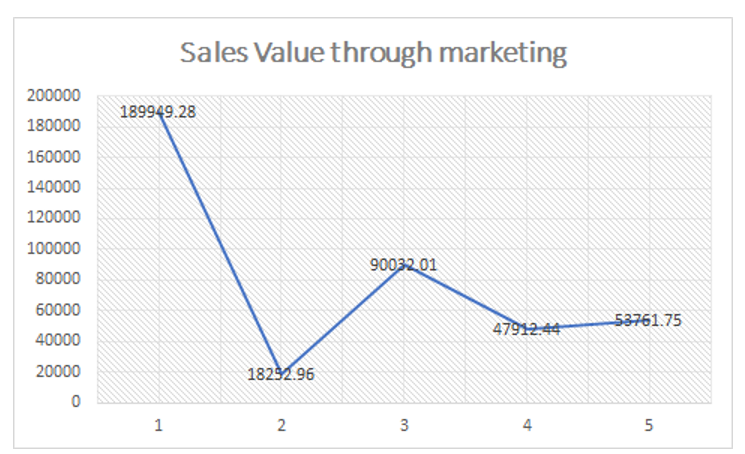
As per the dataset, increment in sale volume has significant increment in sale value. For instance, in 5 month marketing campaign database, sales volume of bracelet is 192 and sale value is 189949. It signifies an increasing trend from past years. As per analytical approach, regression and correlation analysis, dependent variable is sale value and independent variable is sale volume. So, positive approach in these factors has been found.
Management commentary
Data analysis of marketing campaign shows positive relationship between meeting campaign and sale in UK. Marketing campaign has positive impact on dale volume which has helped in increasing sale value of categories like bracelet, rings, necklace, accessories and hair bands. So, it shows efficiency of Bangles Company’s marketing campaign.
d) Conclusion and next steps
i. Conclusions & Recommendations
Key insight: Data driven decision making can be analysed as an approach that guides strategic business decision making. It aligns data with goals, objectives and initiatives of organisation. The data analysis report by data analyst of consultancy called Wood from the Trees (WFTT) addresses marketing related questions of Bangles Company. The business question is “Did the marketing campaign have a positive impact on sales performance in the UK”. Data analysis acts as crucial aspects for addressing the business question. Key trends or changes influencing data analysis are storage, technical capability, and better software, data literacy improving and increased commercial focus. Application of data analysis has helped Bangles Company in meeting key requirements of customers in market by use of big data. Use of data analytics is helpful for maintaining faster decision making, evidence based decisions making better understanding of marketing dynamics and customers for Bangles Company. Analytical procedures like regression analysis can be used for answering the question “Did the marketing campaign have a positive impact on sales performance in the UK”. Data Analytics Utility Lifecycle acts as a relevant framework that helps in analysing structured & unstructured, qualitative & quantitative data and financial & non-financial. Causes of marketing campaigns, fact based data on marketing campaigns, impact of campaigns on sale in the UK and detailed specific action and recommendations due to campaigns can be analysed through Data Analytics Utility Lifecycle framework. Key steps for data cleaning includes removing irrelevant observations, fixing structural errors, filtering unwanted outliers, handling missing data and validating and quality assurance. Besides, analytical procedure helps in analysing relationships between key variables for the business question of Bangles Company. Regression analysis is useful for assessing whether the marketing campaign of Bangles Company has a positive impact on sales in the UK. So, a positive impact of marketing campaign has been found on sale in the UK.
Recommendations: Utilisation of market data is seem to be beneficial for addressing business questions of Bangles Company. However, collecting additional data of marketing campaigns would be beneficial for conducting better data analysis.
- Evaluating market competition in regards to marketing campaigns and sales in the UK would be helpful. Knowing stakeholders and meeting stakeholder expectations would be useful for conducting better data analysis.
- As the question is to analyse impact of marketing campaign on sales UK, gathering additional data as per requirements of direct and indirect stakeholders would be helpful for effective completion of project.
- While gathering data, core focus should be provided on ethics and regulations. A key regulation in UK that relates to use of data in companies is “General Data Protection Regulation” (uk, 2021). It should be aligned with data collection and analysis tasks for generating appropriate data.
- Maintaining transparency, legitimacy, data minimisation, accuracy, confidentiality and limitation of storage term would help in maintaining ethics consideration in additional data collection approach.
Highlights criticalities or concerns: Current available data for addressing business questions of Bangles Company does not seem to be rough. The data only focuses on one market i.e. UK and specifies 5th month marketing campaign results. However, additional data would be needed for strengthening data analysis and decision making of the company. Absence of enough data available for a proper analysis act as hurdle behind answering business question of Bangles Company. As per Lowe et al. (2018), the presence of wide range of data is sufficient for supporting data analysis and decision making of organisations. Therefore, additional data on marketing campaigns would be needed for Bangles Company.
ii. Next steps
The next step of data analysis includes usage of advanced techniques such as econometric analysis in further analysing the effectiveness of the UK marketing campaign. Such advanced techniques are complex to use. It is important to determine basic techniques and principles for utilising this approach. It includes underpinning algorithms and machine learning which facilitates business decision making. Econometrics can be also analysed as multiple linear regression (Ciulla and D’Amico, 2019). It can be used for determining relationships of multiple dependent variables with independent variables. Combination of different variables at different times can be analysed by econometric analysis. For instance, fluctuation in sales volume through different marketing activities can be analysed with the help of this technique. However, usage of such advanced techniques requires a much longer data set with appropriate techniques to analyse the effect of marketing campaigns on sales in the UK. Critical evaluation of econometric analysis can be made by help of its advantages and disadvantages.
Advantages: This technique is useful for converting data into a specific model for the purpose of developing a decision that supports empirical data. Accurate forecast of sale and economic condition can be possible by help of this technique. It includes building regression equations for estimating sale data and general future events according to requirements of the company. This approach is efficient for obtaining accurate quantitative data as per business need (Olive, 2017). It specifies interaction between various variables, so forecast is developed by solving these variables. Using this method in case of Bangles Company would require to develop linear equation on sales and marketing. It would allow the management to conduct effective use of market data for gaining analytical data on business questions. Positive or negative impact of marketing campaigns on sale in the UK can be analysed by Bangles Company by help of this system. It can be recommended to Bangles Company that usage of computers and software would be helpful for conducting data analysis by econometric analysis.
Disadvantages: This technique requires appropriate expertise and large historical data for developing equations. The method could be complex for small and medium size organisations (Jomnonkwao et al. 2020). Any error in the equation can result in the wrong outcome from the data. It generally assumes fixed prices in the market. Statistical multipliers only represent a snapshot economy at given point of time. Elements like supply constraints, competitiveness changes and other demographic factors are neglected in this approach. Historical patterns may not be the best indicator for predicting data and answering business questions. It requires medium to high cost for implementation in business. Also, the company is required to maintain skilled and expert staff members who have an idea of econometric analysis. The method assumes a straight line relationship between independent and independent variables. However, it can be incorrect in many times. So, the approach does not seem to be efficient for assessing positive impact of marketing campaigns on sale in the UK.
References
Ao, J. and Chirkova, R., (2019), July. Effective and Efficient Data Cleaning for Entity Matching. In Proceedings of the Workshop on Human-In-the-Loop Data Analytics, 3(1), pp. 1-7.
Bhattacharjee, A., Barve, Y., Khare, S., Bao, S., Gokhale, A. and Damiano, T., (2019). Stratum: A serverless framework for the lifecycle management of machine learning-based data analytics tasks. In (2019) Conference on Operational Machine Learning, 1(9), pp. 59-61.
Cagnin, C., (2018). Developing a transformative business strategy through the combination of design thinking and futures literacy. Technology Analysis & Strategic Management, 30(5), pp.524-539.
Ciulla, G. and D’Amico, A., (2019). Building energy performance forecasting: A multiple linear regression approach. Applied Energy, 25(2), p.113500.
Erl, T. Khattak, W. Buhler, P. (2016) Big Data Fundamentals: Concepts, Drivers & Techniques. ISBN-13: 978-0-13-429107-9
Ge, C., Gao, Y., Miao, X., Yao, B. and Wang, H., (2020). A Hybrid Data Cleaning Framework Using Markov Logic Networks. IEEE Transactions on Knowledge and Data Engineering, 3(2), pp.55-57.
Gov.uk, (2021). About Data Protection Regulation in UK. Available at: https://www.gov.uk/data-protection#:~:text=The%20Data%20Protection%20Act%202018%20is%20the%20UK’s%20implementation%20of,used%20fairly%2C%20lawfully%20and%20transparently[Accessed on 10th May 2021]
Jomnonkwao, S., Uttra, S. and Ratanavaraha, V., (2020). Forecasting road traffic deaths in Thailand: Applications of time-series, curve estimation, multiple linear regression, and path analysis models. Sustainability, 12(1), pp.395-340.
Lowe, A., Norris, A.C., Farris, A.J. and Babbage, D.R., (2018). Quantifying thematic saturation in qualitative data analysis. Field Methods, 30(3), pp.191-207.
Marjani, M., Nasaruddin, F., Gani, A., Karim, A., Hashem, I.A.T., Siddiqa, A. and Yaqoob, I., (2017). Big IoT data analytics: architecture, opportunities, and open research challenges. ieee access, 5(2), pp.5247-5261.
Olive, D.J., (2017). Multiple linear regression. In Linear regression, 3(2), pp. 17-83.
Zhu, L., Yu, F.R., Wang, Y., Ning, B. and Tang, T., (2018). Big data analytics in intelligent transportation systems: A survey. IEEE Transactions on Intelligent Transportation Systems, 20(1), pp.383-398.
Know more about UniqueSubmission’s other writing services:

You ought to be a part of a contest for one of the finest websites on the web. I will highly recommend this blog!
https://twrd.in/x479tzi